Running a DIY home improvement store today requires more than great products and friendly service. Customers expect quick checkout, competitive prices, accurate availability, and smooth shopping experiences across all store locations. Managers must track sales trends, profit margins, returns, discounts, customer satisfaction, supplier performance, and regional patterns—without spending hours analyzing spreadsheets.
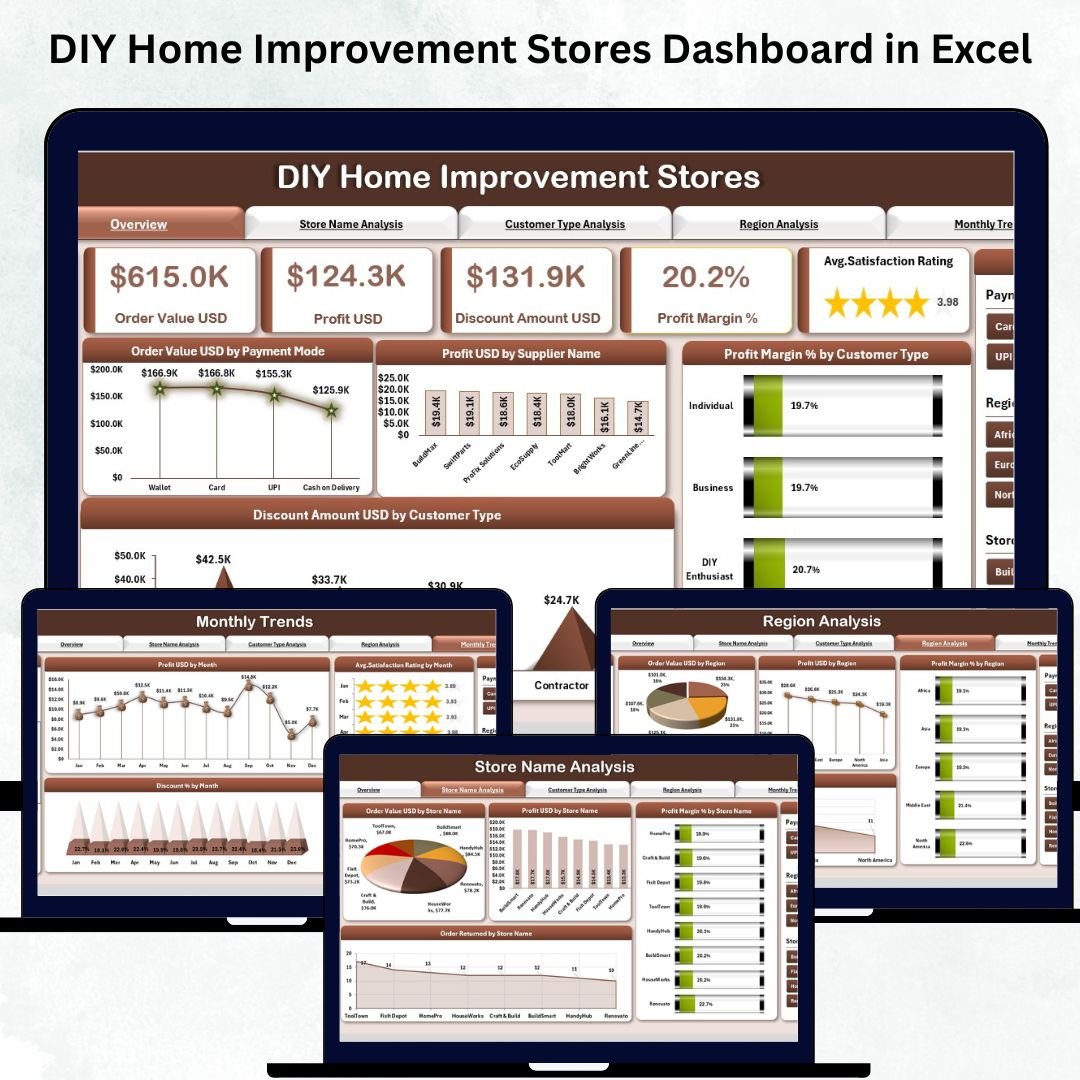
The DIY Home Improvement Stores Dashboard in Excel solves this challenge instantly. It brings every important KPI into one interactive Excel dashboard so store owners, regional managers, and analysts can make fast, data-driven decisions. With slicers, dynamic charts, clear KPI cards, and neatly structured pages, this dashboard simplifies store monitoring and gives you 360° visibility of your business.
Whether you manage a single store or a chain of DIY outlets, this ready-to-use Excel template helps you understand your customers, compare stores, evaluate regions, improve profitability, and plan smarter strategies—all without technical skills or expensive software.
✨ Key Features of the DIY Home Improvement Stores Dashboard in Excel
📊 Overview Page – Instant Store Performance Snapshot
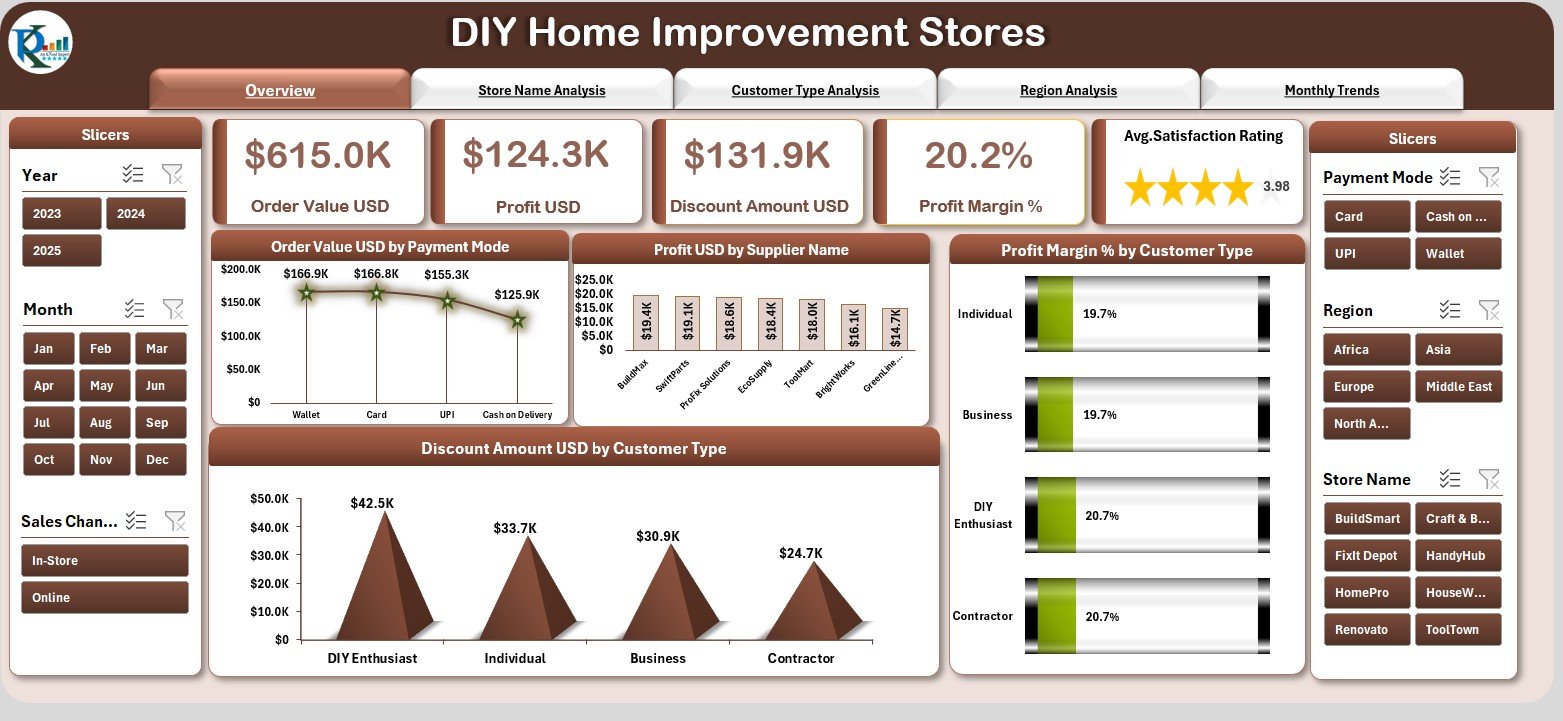
The Overview Page works as your main reporting screen.
Using the slicer panel on the right, you can filter performance by:
-
Month
-
Region
-
Store Name
-
Customer Type
-
Supplier
-
Payment Mode
The page also showcases five powerful KPI cards:
-
Total Order Value (USD)
-
Total Profit (USD)
-
Average Profit Margin (%)
-
Total Discount Amount (USD)
-
Orders Returned (%)
Below these KPI cards, four essential charts highlight revenue drivers, customer behavior, and discount patterns. Everything updates dynamically based on your selections.
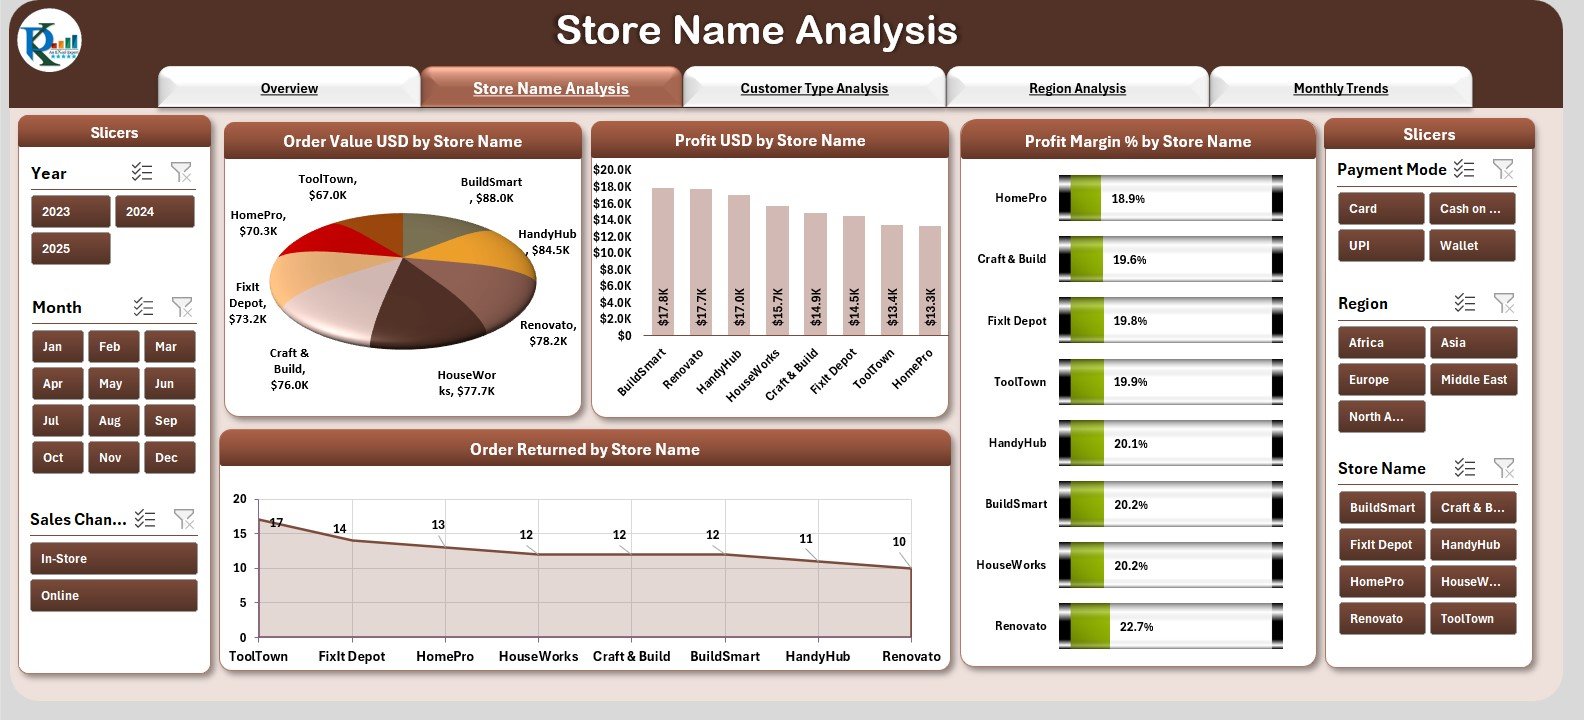
🏬 Store Name Analysis – Compare Store-to-Store Performance
This page helps you identify which stores perform best across your network. View charts for:
-
Order Value by Store
-
Profit by Store
-
Profit Margin (%) by Store
-
Returns by Store
Use this data to determine which store needs training, inventory adjustments, or performance incentives.
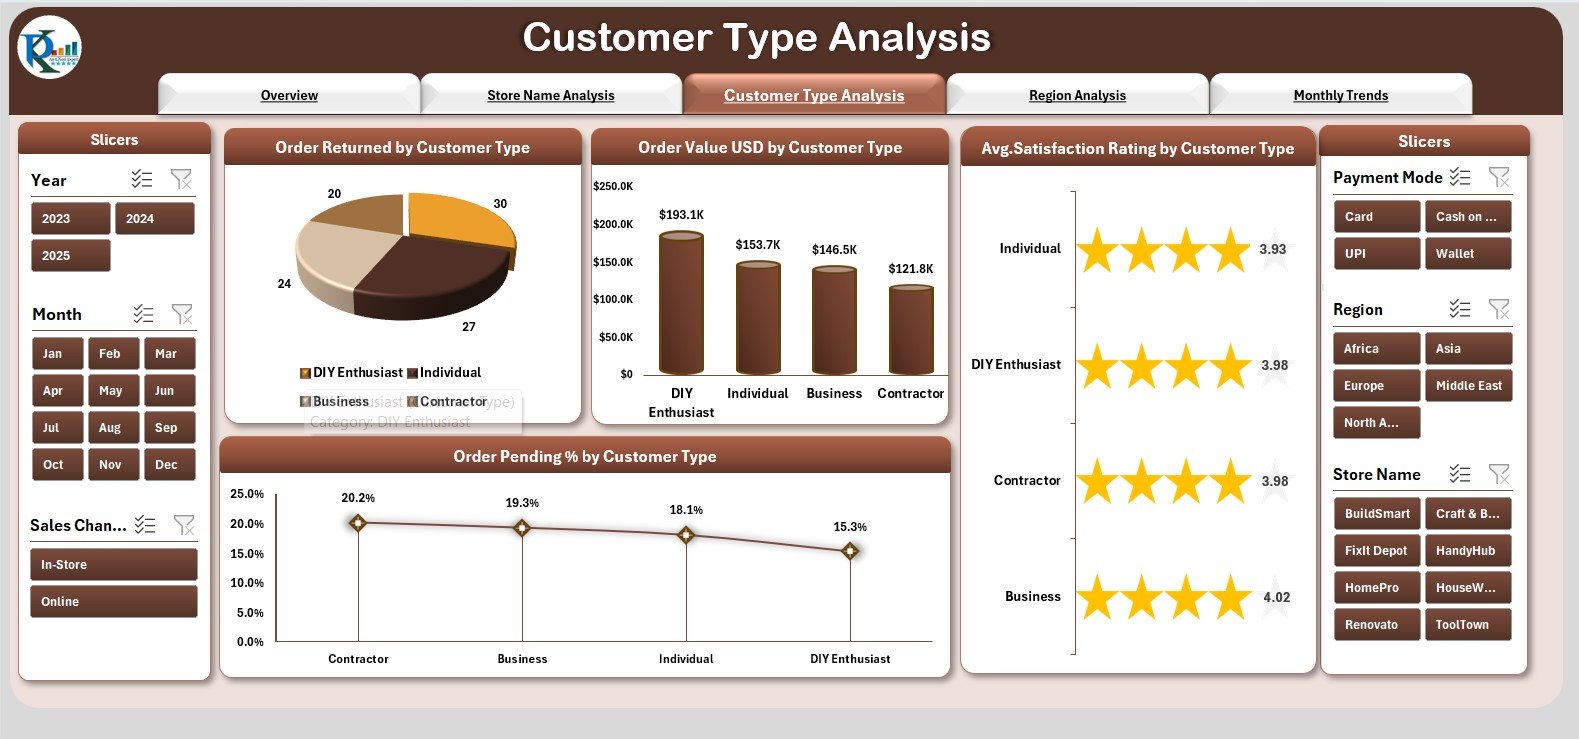
👥 Customer Type Analysis – Understand Your Buyers Better
Every DIY store caters to different customer groups like:
Homeowners, Contractors, Interior Designers, Electricians, and Plumbers.
This page includes charts for:
-
Returns by Customer Type
-
Order Value by Customer Type
-
Satisfaction Rating by Customer Type
-
Pending Orders % by Customer Type
These insights help you optimize marketing, pricing, and promotional strategies for each segment.
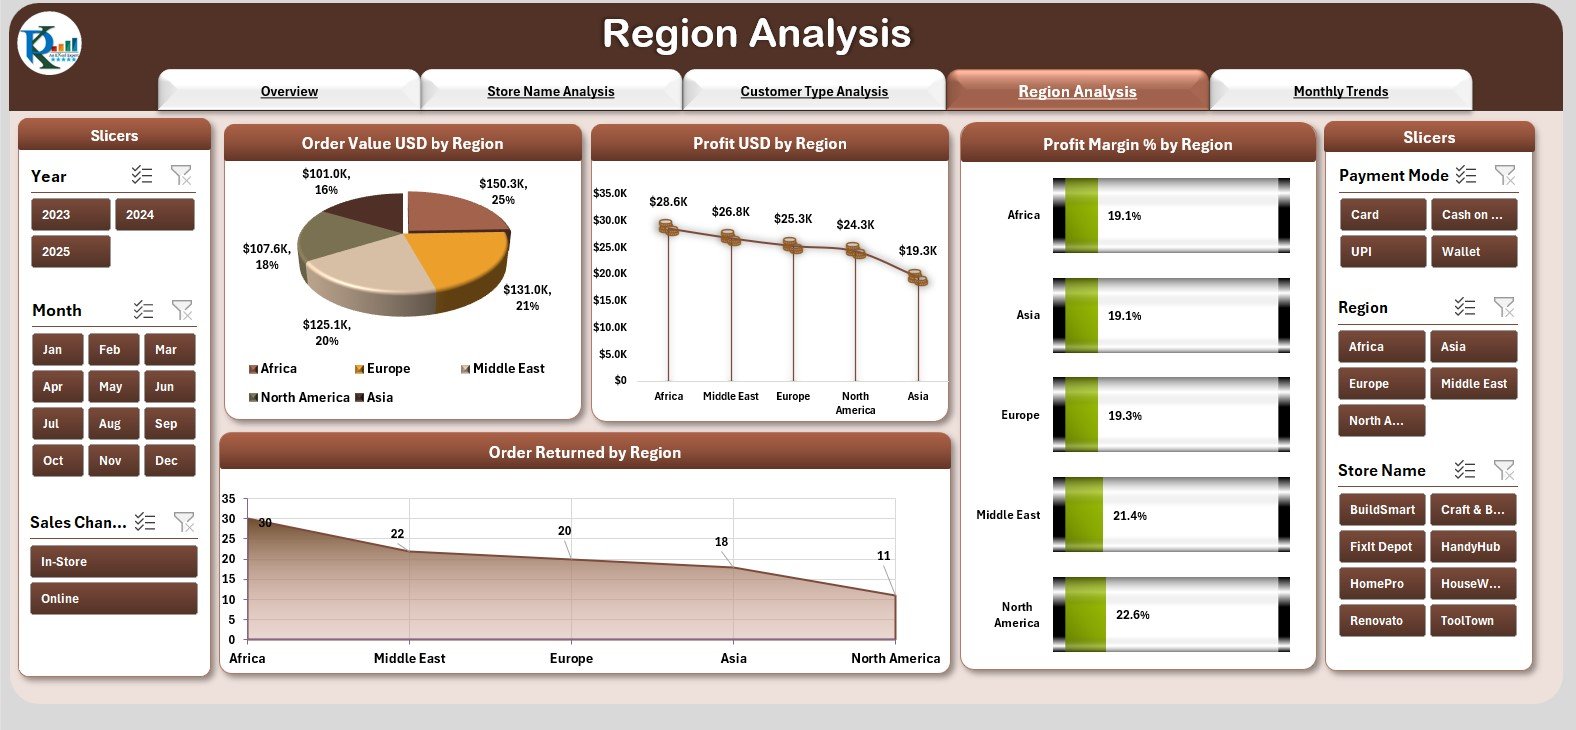
🌎 Region Analysis – Track Performance Across All Regions
Different regions show different buying behavior and performance trends.
Find out:
-
Which regions generate the highest sales
-
Which ones produce the best profits
-
Where profit margins are falling
-
Where customer returns are rising
These visuals help managers make region-specific operational decisions.
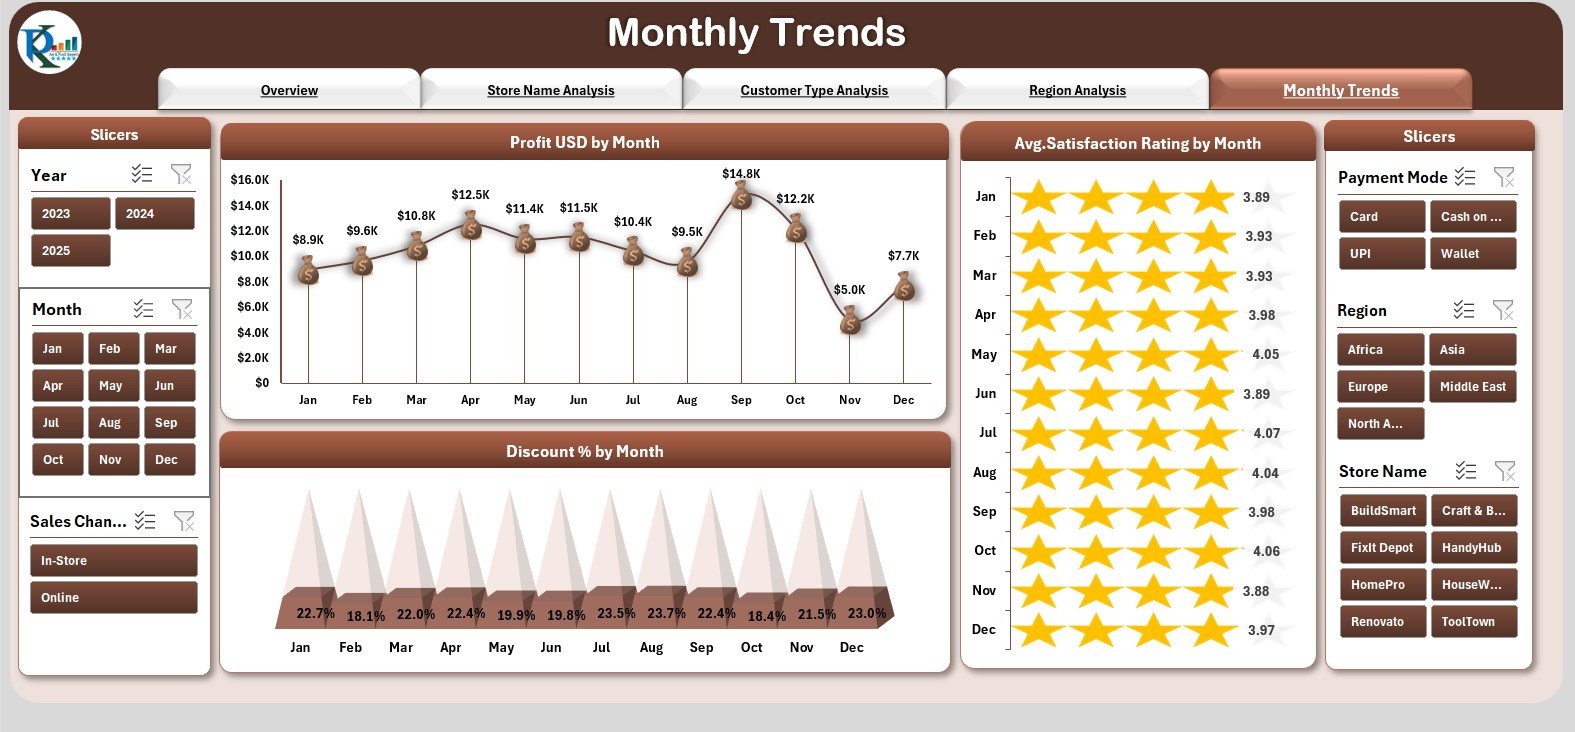
📅 Monthly Trends – Analyze Month-to-Month Performance
This page focuses on seasonal performance changes with three essential charts:
-
Profit (USD) by Month
-
Average Satisfaction Rating by Month
-
Discount (%) by Month
These trends help plan promotional campaigns, budget forecasts, and performance improvement strategies.
📘 What’s Inside the DIY Home Improvement Stores Dashboard in Excel
Support Sheet
Contains dropdown lists, KPI mappings, and other background tables to ensure smooth functionality.
Data Sheet
Stores all transactional data, including:
-
Orders
-
Payment Mode
-
Customer Type
-
Profit
-
Supplier
-
Region
-
Satisfaction Rating
-
Returned Status
This sheet forms the backbone of your dashboard and updates all visuals automatically.
🛠 How to Use the DIY Home Improvement Stores Dashboard in Excel
Step 1: Enter Data in the Data Sheet
Paste your order and customer data without changing column names.
Step 2: Refresh All
Go to Data → Refresh All to update all charts and visuals instantly.
Step 3: Use the Slicers
Choose Month, Region, or Customer Type to view filtered insights.
Step 4: Analyze Each Page
Move across Overview, Store, Customer, Region, and Monthly pages using the navigator.
Step 5: Customize If Needed
Add more KPIs, charts, or slicers depending on your store needs.
🎯 Who Can Benefit from This DIY Home Improvement Stores Dashboard
🛒 DIY Store Owners
Monitor store performance, profit, customer satisfaction, and inventory behavior.
📈 Business Analysts & Reporting Teams
Save hours every week by using automated KPIs and slicers.
🌍 Regional Managers
Compare stores across locations and identify development opportunities.
🧑🤝🧑 Customer Service Teams
Improve satisfaction ratings and reduce returns by understanding customer patterns.
🧮 Finance & Strategy Teams
View discount impact, profit margins, and sales trends for budgeting and planning.


Reviews
There are no reviews yet.