
Digital marketing produces massive amounts of data every single day. Impressions, clicks, conversions, spend, revenue, and ROI often live inside different ad platforms and reports. When this data is not consolidated, teams struggle to understand whether campaigns are truly performing or simply consuming budget.
That is exactly why the Digital Marketing KPI Scorecard in Google Sheets becomes a powerful and practical solution for modern marketing teams.
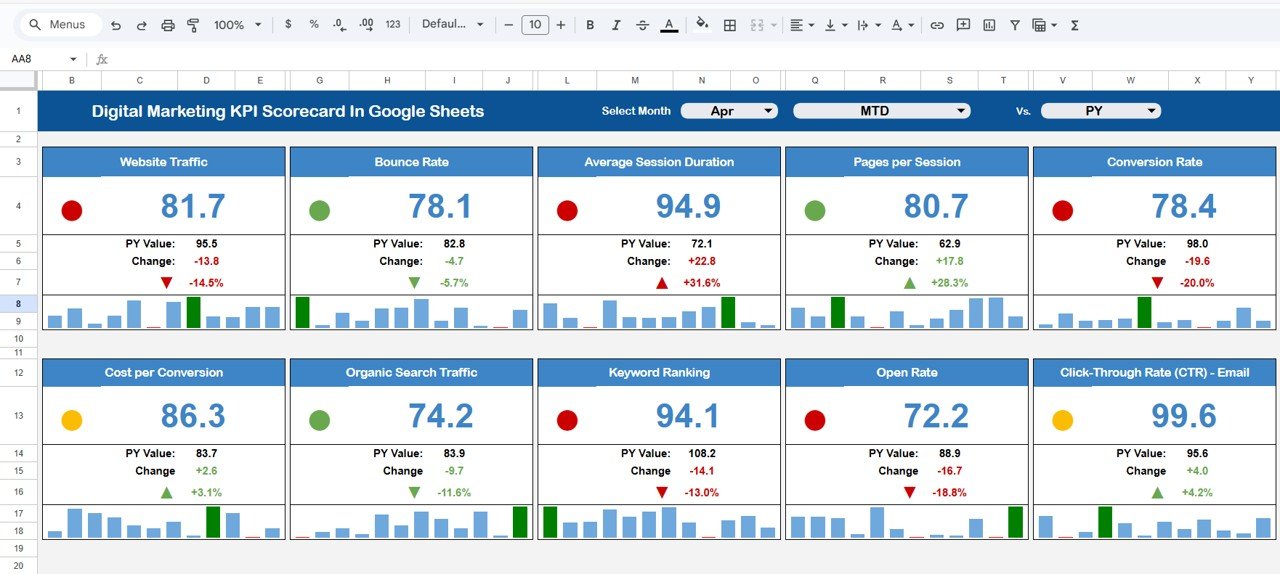
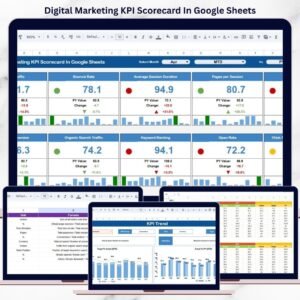
This ready-to-use KPI scorecard transforms scattered marketing data into a clean, structured, and visual performance summary. It tracks 10 essential digital marketing KPIs in one place and presents them using traffic lights, percentage change indicators, and MTD/YTD views. Instead of building complex dashboards, teams get instant clarity on what is working, what needs attention, and where optimization is required.
Because the scorecard runs entirely in Google Sheets, it offers real-time updates, easy collaboration, automatic calculations, and zero dependency on expensive BI or marketing tools.
✨ Key Features of the Digital Marketing KPI Scorecard in Google Sheets
📊 1. One-Page Marketing Performance Snapshot
Get a complete view of digital marketing health in a single scorecard—no switching between dashboards.
🚦 2. Traffic Light Performance Indicators
Green, yellow, and red indicators instantly show strong, average, or poor KPI performance.
📈 3. Percentage Change Indicators
Up and down arrows clearly highlight performance improvement or decline compared to the previous period.
📅 4. MTD & YTD Performance Toggle
Switch between Month-to-Date and Year-to-Date views to analyze short-term results and long-term trends.
🤝 5. Google Sheets-Based Collaboration
Marketing, growth, and leadership teams collaborate in real time with controlled access.
📦 What’s Inside the Digital Marketing KPI Scorecard
🖥️ Scorecard Overview – Performance at a Glance
This is the main scorecard view where all KPIs are displayed clearly and visually.
📌 Monthly KPI Selection
-
A Month dropdown at the top allows users to select any month
-
Once selected, all KPI values update automatically
📌 KPIs Covered (10 Core Metrics)
-
Impressions
-
Clicks
-
Click-Through Rate (CTR)
-
Conversions
-
Conversion Rate
-
Cost per Click (CPC)
-
Cost per Conversion
-
Marketing Spend
-
Revenue from Marketing
-
Marketing ROI
Each KPI shows:
-
Actual value
-
Traffic light performance status
-
Percentage change indicator
This layout makes performance interpretation immediate and intuitive.
📊 Traffic Lights & Performance Indicators
The scorecard uses visual cues to simplify analysis:
-
🟢 Green – Strong performance
-
🟡 Yellow – Average or watch-list performance
-
🔴 Red – Poor performance requiring action
Percentage arrows indicate whether performance has improved or declined compared to the previous period.
📅 MTD & YTD Toggle
-
MTD (Month-to-Date): Analyze current month performance
-
YTD (Year-to-Date): Analyze cumulative yearly performance
This toggle helps teams balance tactical campaign optimization with strategic growth analysis.
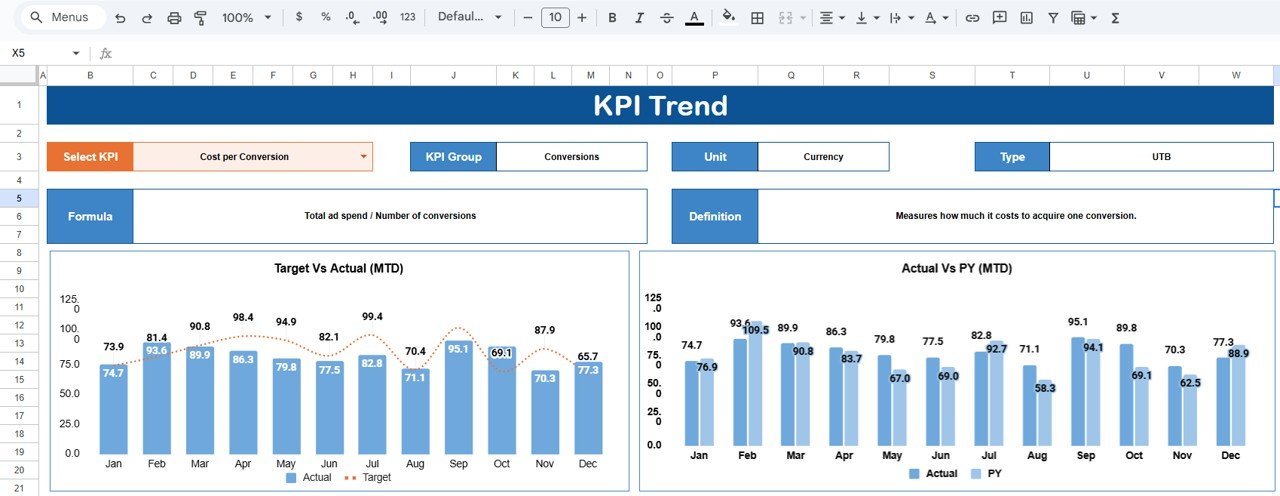
📈 KPI Trend Sheet Tab
This sheet provides deeper KPI understanding.
🔍 KPI Selection
-
Select a KPI from the dropdown in cell C3
📘 KPI Details Displayed
-
KPI Group
-
Unit of Measurement
-
KPI Type (Lower the Better / Upper the Better)
-
KPI Formula
-
KPI Definition
This ensures consistent KPI interpretation across teams.
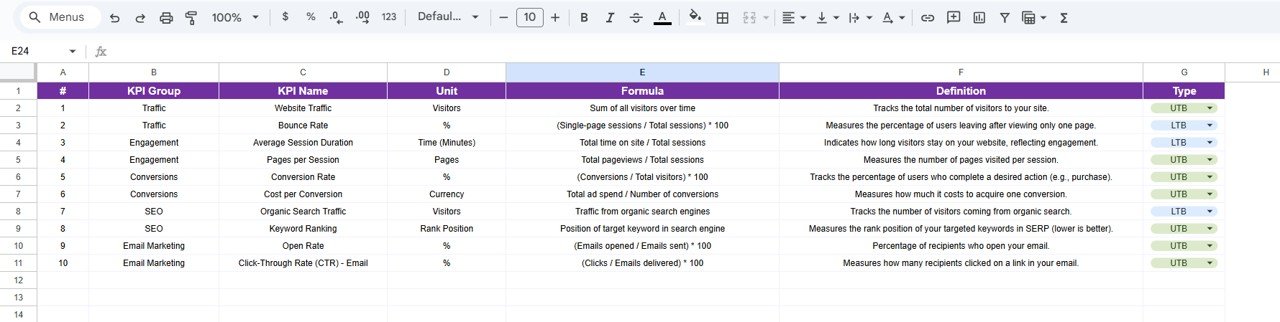
📘 KPI Definition Sheet Tab
Acts as the master KPI reference with:
-
KPI Name
-
KPI Group
-
Unit
-
Formula
-
KPI Definition
This improves governance and avoids confusion.
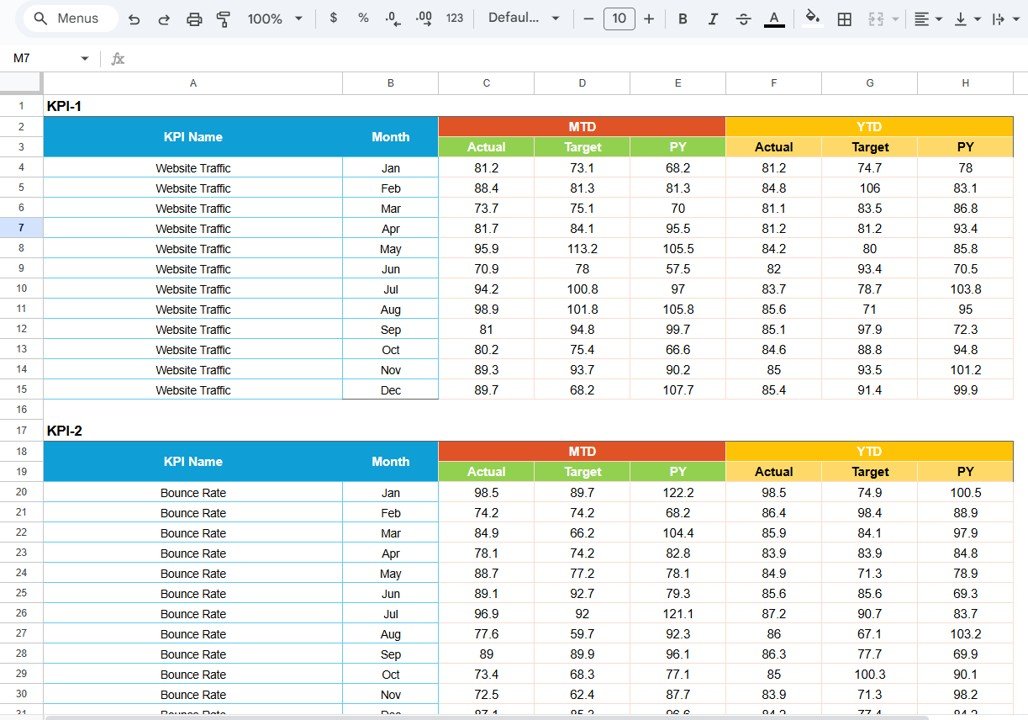
📄 Data Input Sheet Tab
This sheet stores raw marketing data.
Typical columns include:
-
Date / Month
-
Channel
-
Campaign
-
Impressions
-
Clicks
-
Spend
-
Conversions
-
Revenue
Once data is updated, the scorecard refreshes automatically.
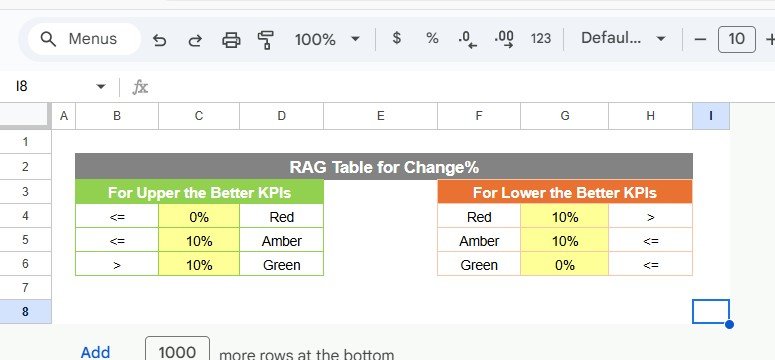
🎨 Colour Settings Section
Customize:
-
Traffic light thresholds
-
Performance rules
-
Indicator colors
This flexibility allows alignment with your business goals.
🎯 Who Can Benefit from This Digital Marketing KPI Scorecard
📣 Digital Marketers
Track campaign health instantly.
🚀 Growth Teams
Identify optimization opportunities quickly.
📊 Marketing Managers
Review performance without complex reports.
👔 Business Owners & Leaders
Understand marketing ROI at a glance.
🏢 Agencies
Use as a standardized client reporting tool.
### Click here to read the Detailed blog post
Watch the step-by-step video tutorial:


Reviews
There are no reviews yet.