Running a department store today requires balancing sales growth, cost control, customer satisfaction, and promotional effectiveness across multiple departments and locations. However, many retail teams still rely on scattered Excel sheets, manual summaries, and static reports. As a result, they struggle to understand what is really driving performance and where improvements are needed. That is exactly why the Department Stores Dashboard in Excel becomes a powerful and practical solution for modern retail management.
This ready-to-use Excel dashboard transforms raw retail data into a centralized, interactive, and visually clear performance management system. Instead of opening multiple spreadsheets for sales, costs, promotions, and customer feedback, store managers and leadership teams can analyze everything from one structured dashboard. Consequently, trends become visible faster, problem areas stand out clearly, and decisions become more confident.
Because this dashboard is built entirely in Microsoft Excel, it remains cost-effective, flexible, and easy to adopt. You do not need expensive BI tools, complex systems, or advanced technical skills. Simply update the data, use slicers, and gain instant insights into your department store operations.
🔑 Key Features of Department Stores Dashboard in Excel
🏬 Centralized Retail Performance View – Track sales, costs, customers, and promotions in one Excel dashboard.
📊 Executive KPI Cards & Charts – Understand performance instantly using clear KPI cards and visuals.
🎛️ Interactive Right-Side Slicers – Filter data by store, department, customer type, promotion type, or month.
📈 Multi-Dimensional Analysis – Analyze performance across departments, customers, promotions, and time.
⚡ Automated Excel Reporting – Reduce manual reporting effort and improve accuracy.
📂 What’s Inside the Department Stores Dashboard in Excel
This professionally designed dashboard includes five structured analytical pages, supported by backend data sheets:
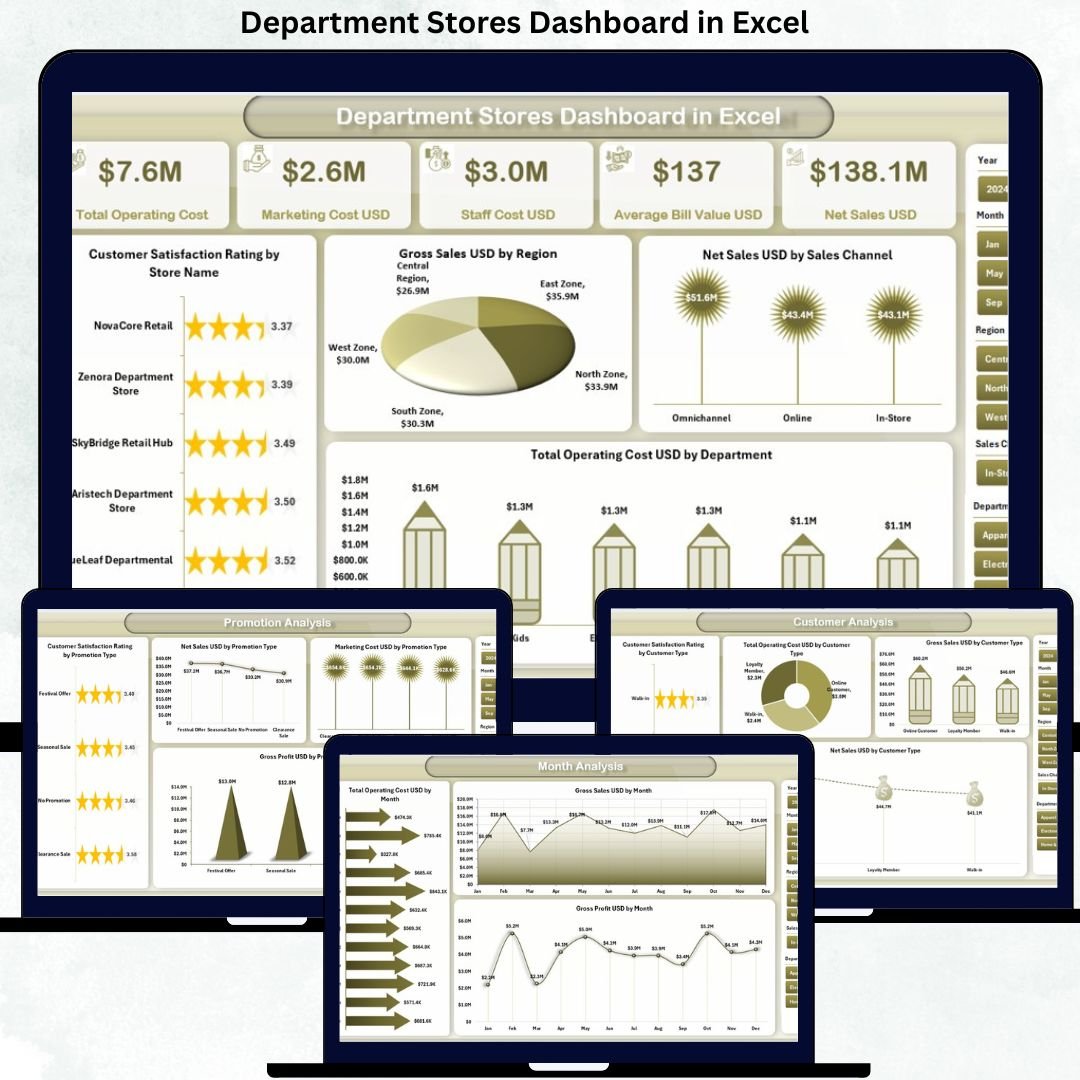
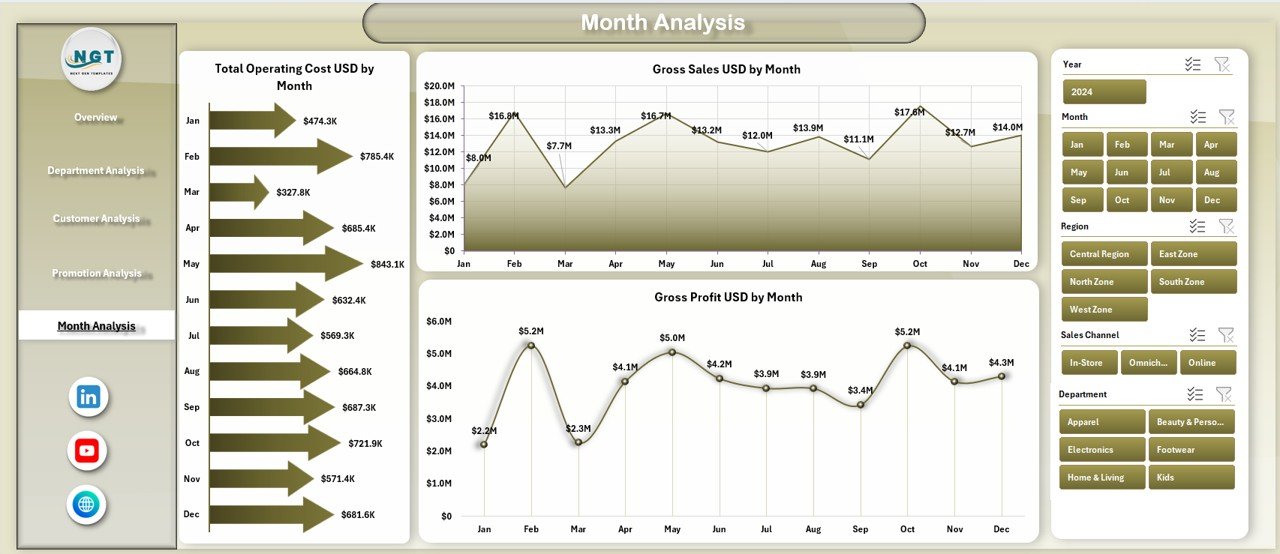
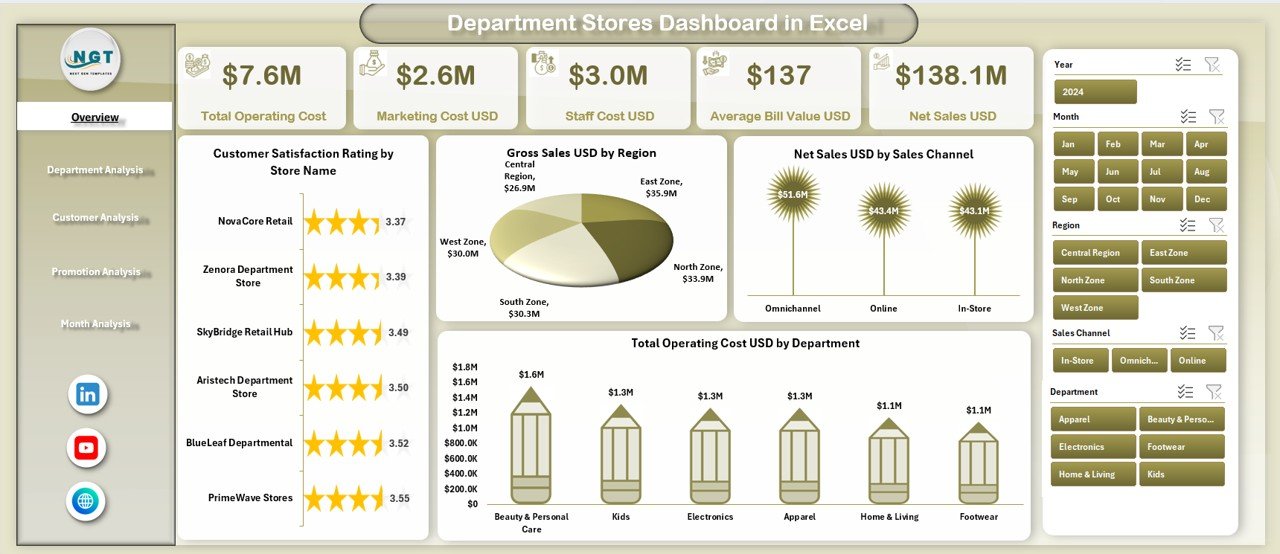
📊 Overview Page – A high-level summary with KPI cards and charts such as Customer Satisfaction Rating by Store Name, Gross Sales by Region, Net Sales by Sales Channel, and Total Operating Cost by Department.
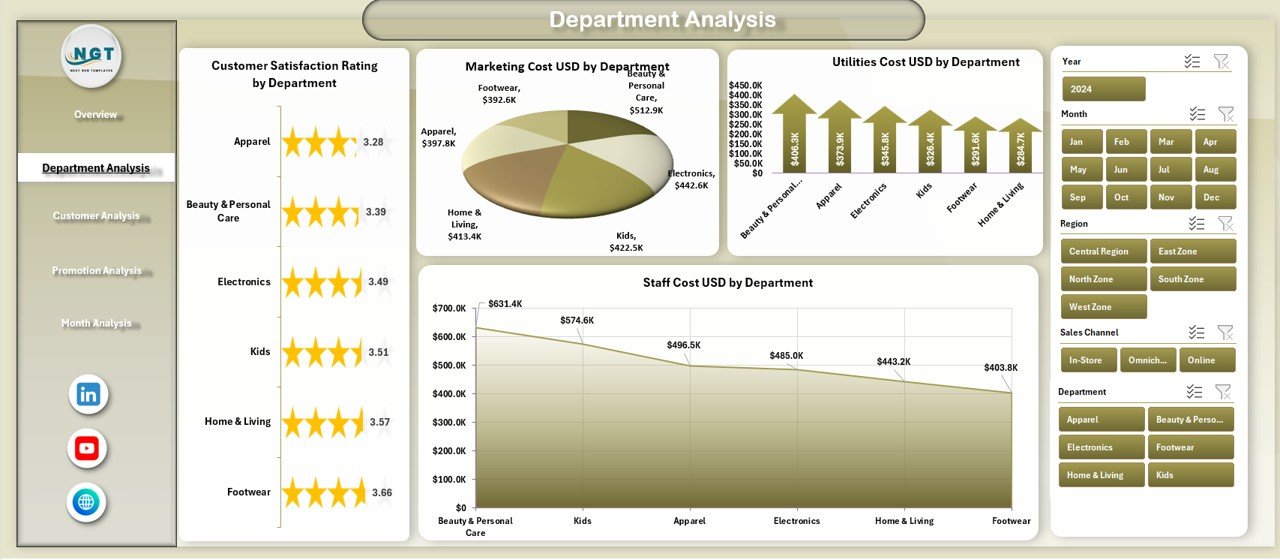
🏷️ Department Analysis Page – Compare departments using Customer Satisfaction Rating, Marketing Cost, Utilities Cost, and Staff Cost to identify cost-heavy or underperforming departments.
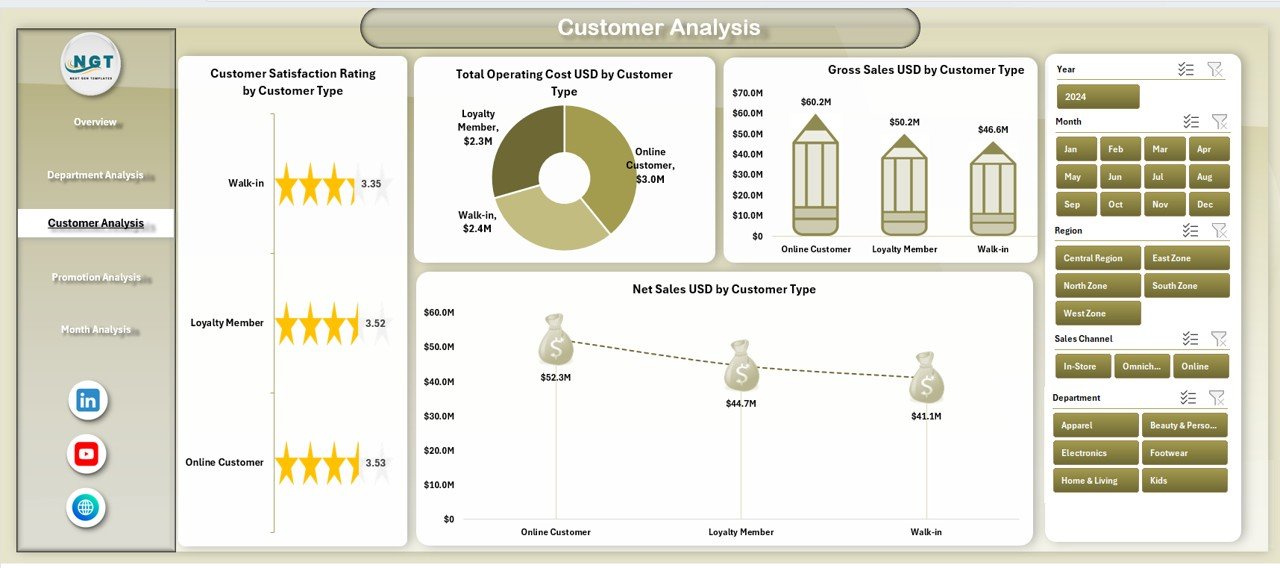
👥 Customer Analysis Page – Analyze Customer Satisfaction, Gross Sales, Net Sales, and Operating Cost by Customer Type to understand customer profitability.
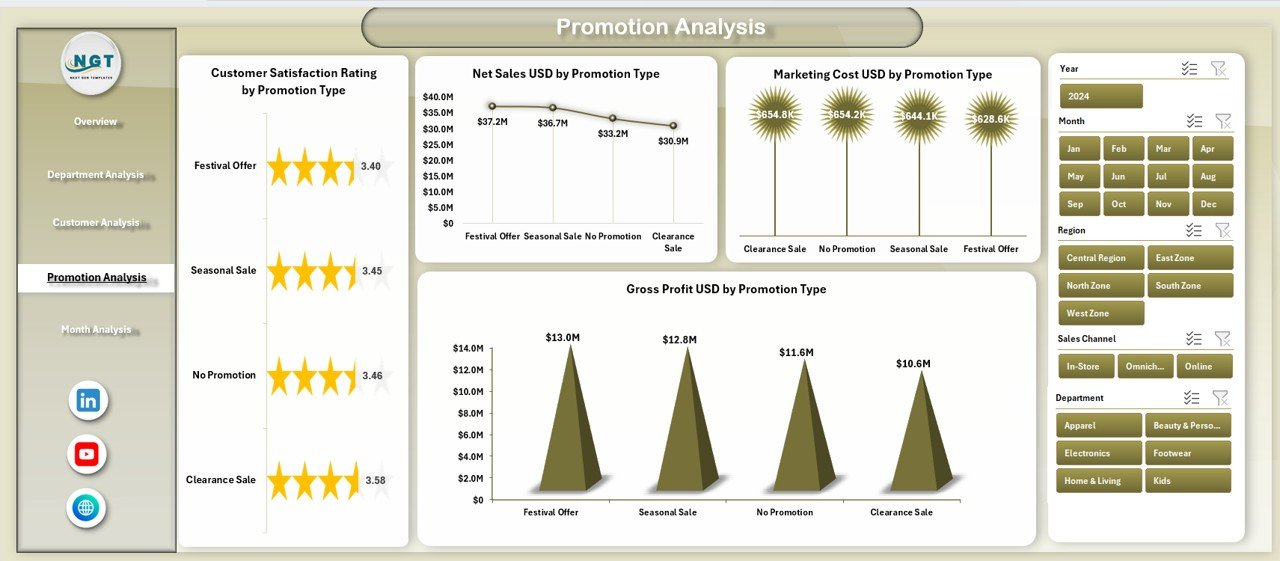
🎯 Promotion Analysis Page – Evaluate promotion effectiveness using Net Sales, Marketing Cost, Gross Profit, and Satisfaction Rating by Promotion Type.
📅 Month Analysis Page – Track trends with Gross Sales, Gross Profit, and Total Operating Cost by Month.
📄 Data Sheet – Central location to enter or paste raw retail data.
🛠 Support Sheet – Helper tables and calculations to ensure smooth dashboard performance.
Each page updates instantly when slicers are applied, allowing seamless movement from summary views to detailed analysis.
▶️ How to Use the Department Stores Dashboard in Excel
Using this dashboard is simple and business-friendly:
1️⃣ Enter or paste retail data into the Data Sheet.
2️⃣ Review automated calculations supported by the Support Sheet.
3️⃣ Navigate between pages using the page navigator.
4️⃣ Apply slicers to filter data by store, department, customer type, promotion, or month.
5️⃣ Analyze KPIs and charts to take data-driven actions.
No advanced Excel skills are required—basic Excel knowledge is sufficient.
👥 Who Can Benefit from This Department Stores Dashboard in Excel
This dashboard is ideal for:
🏬 Department Store Owners
🧾 Retail & Store Managers
💰 Finance & Operations Teams
📢 Marketing Managers
📊 Business Analysts
🏢 Senior Leadership
Each stakeholder gains clarity, control, and confidence in retail decision-making.
### 👉 Click here to read the Detailed Blog Post
Visit our YouTube channel to learn step-by-step video tutorials.


Reviews
There are no reviews yet.