Cybersecurity has become one of the most critical priorities for modern organizations. As companies rely more on digital platforms, cloud services, and connected devices, the risk of cyber threats continues to increase. Cyberattacks such as ransomware, phishing attempts, malware infections, and data breaches can severely impact business operations, cause financial losses, and damage organizational reputation.
Therefore, organizations must continuously monitor cybersecurity incidents and evaluate how effectively their security teams respond to threats. However, many security departments still rely on manual reports, scattered spreadsheets, and delayed analysis. As a result, it becomes difficult for decision-makers to track cybersecurity incidents, evaluate response performance, and identify emerging threats.
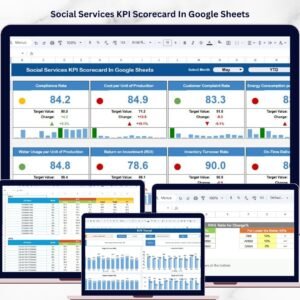
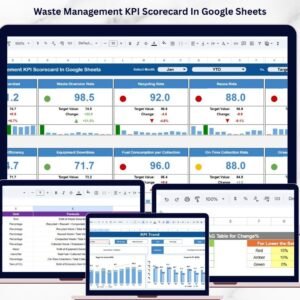
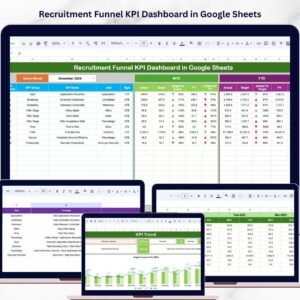
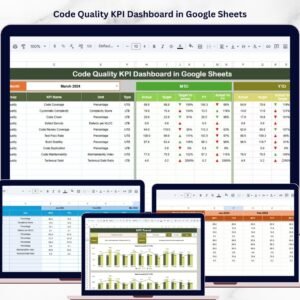
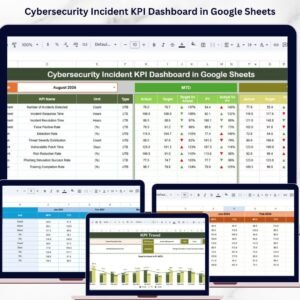
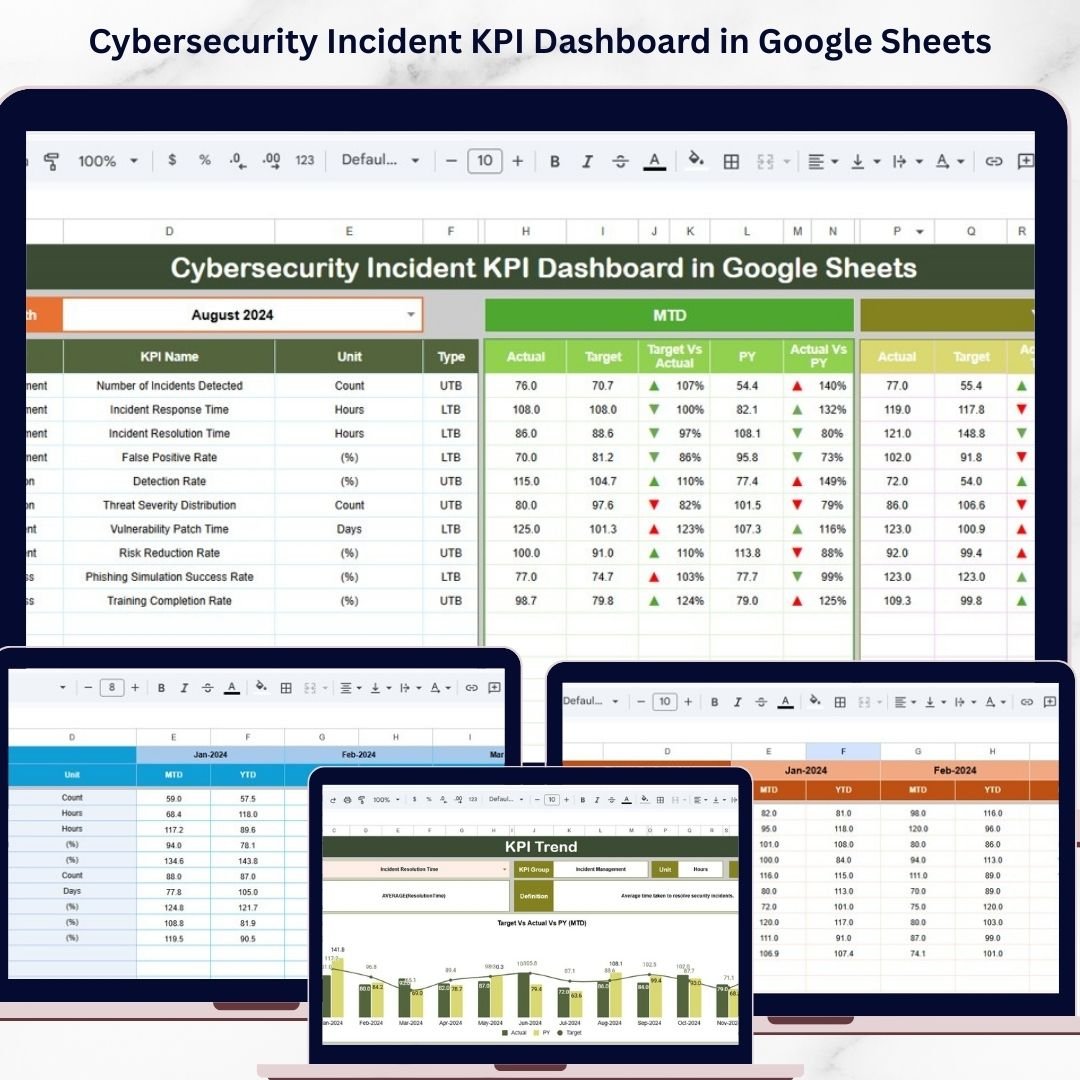
The Cybersecurity Incident KPI Dashboard in Google Sheets is a powerful and ready-to-use monitoring template designed to help organizations track cybersecurity performance using structured Key Performance Indicators (KPIs). This dashboard provides an interactive environment where security teams can analyze incident trends, compare performance against targets, and monitor security operations efficiently.
Instead of manually analyzing security data, this dashboard converts raw cybersecurity metrics into meaningful insights using structured dashboards, trend analysis, and visual indicators. Managers can instantly see how cybersecurity operations are performing and quickly identify areas that require attention.
Because the template runs on Google Sheets, teams can collaborate in real time, update data from anywhere, and maintain a centralized cybersecurity performance monitoring system. As a result, organizations can strengthen their security posture and respond to cyber threats more effectively.
Key Feature of Cybersecurity Incident KPI Dashboard in Google Sheets 🔐
The Cybersecurity Incident KPI Dashboard in Google Sheets includes several powerful features that simplify cybersecurity monitoring and incident management.
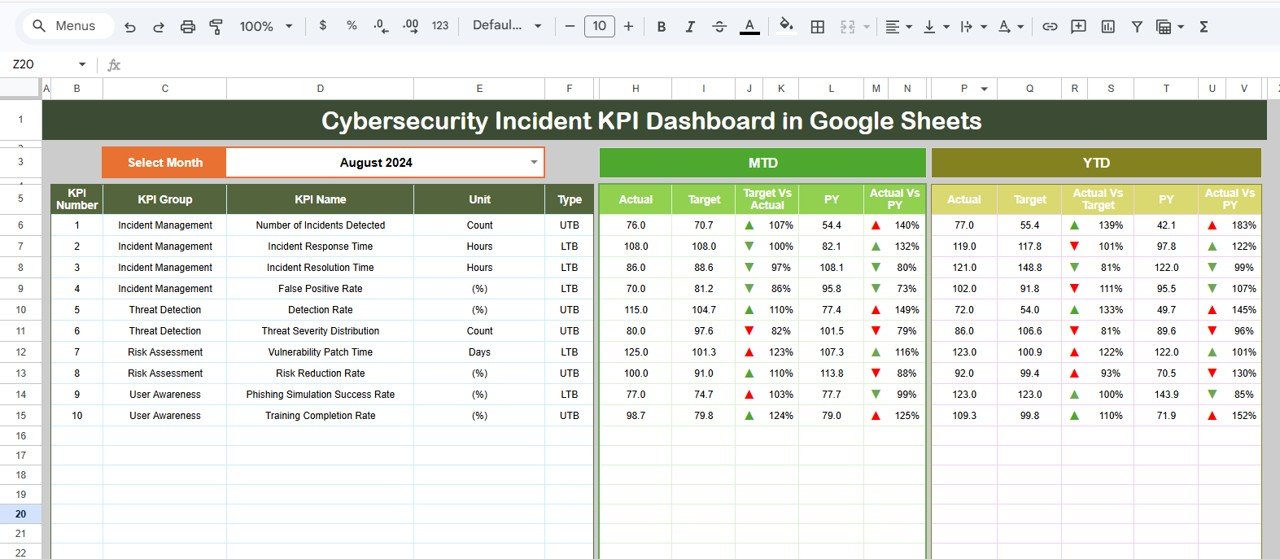
📊 Interactive Cybersecurity KPI Dashboard
The dashboard provides a centralized view of cybersecurity incidents and performance metrics.
📅 Dynamic Monthly Analysis
Users can select any month from the dropdown menu, and the entire dashboard automatically updates.
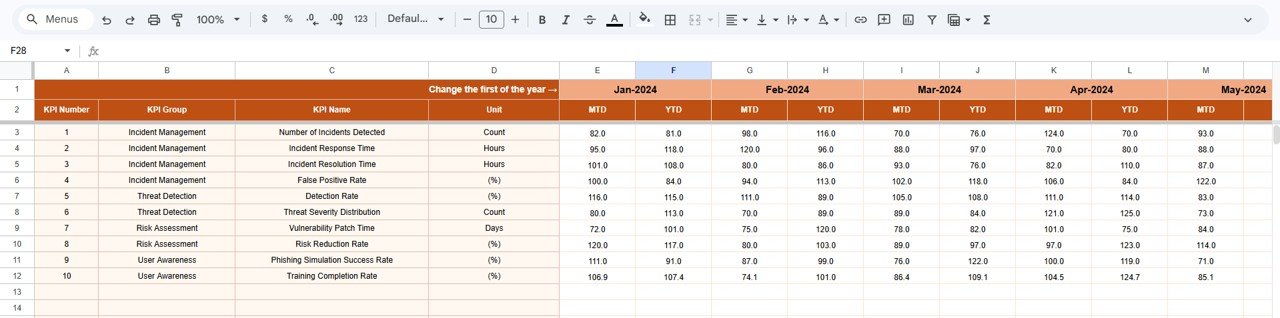
📈 MTD and YTD Performance Monitoring
Track both Month-To-Date (MTD) and Year-To-Date (YTD) cybersecurity performance metrics.
🎯 Actual vs Target Performance Comparison
The dashboard compares actual cybersecurity performance with predefined targets.
📉 Previous Year Performance Analysis
Security teams can compare current results with previous year performance to measure improvement.
⬆️⬇️ Performance Trend Indicators
Green upward arrows and red downward arrows visually display improvements or declines in performance.
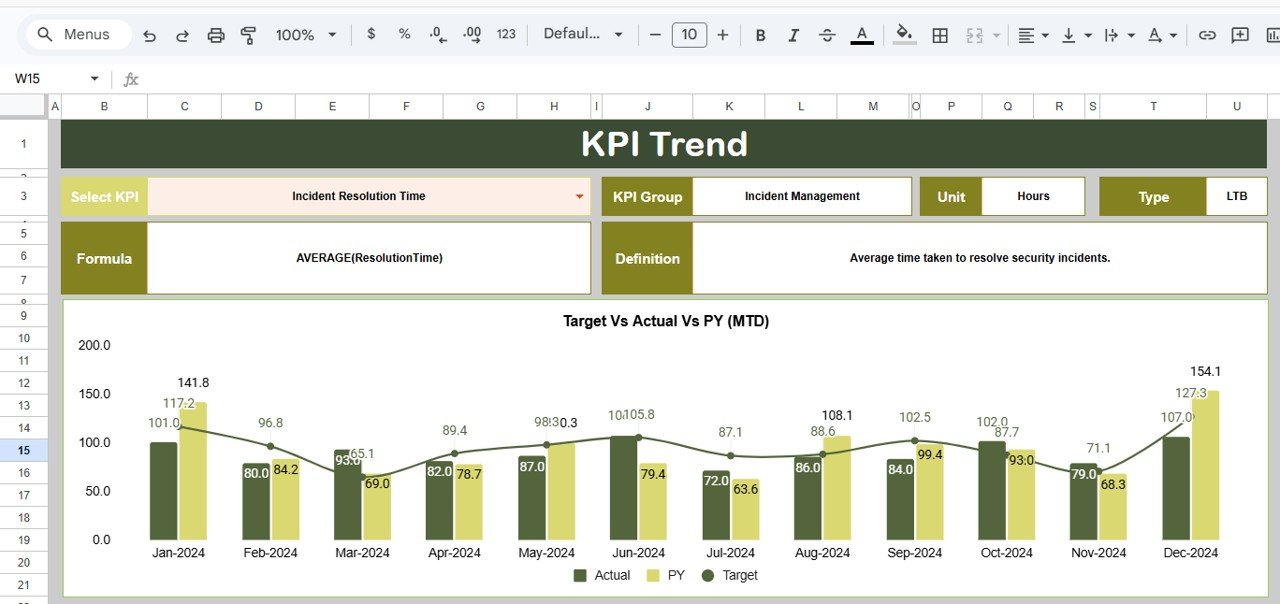
📊 Cybersecurity KPI Trend Analysis
Dedicated trend analysis helps organizations evaluate how cybersecurity metrics evolve over time.
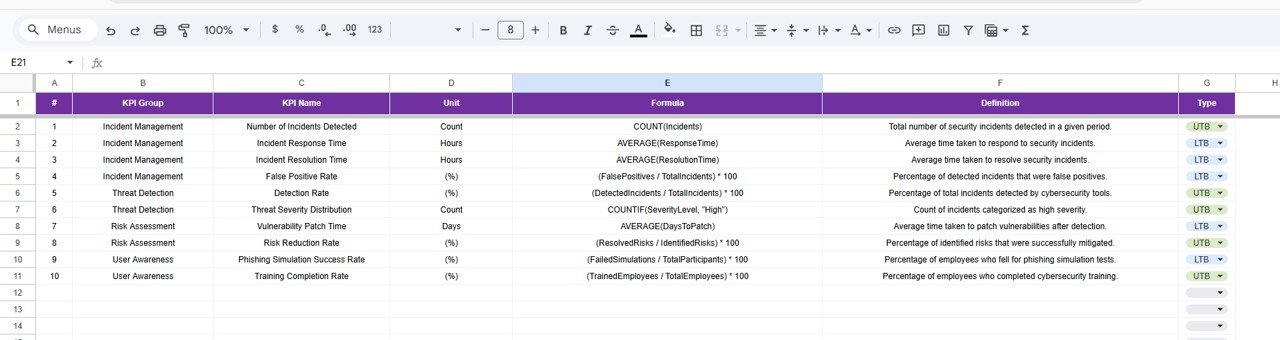
📘 KPI Documentation System
Each KPI includes a detailed definition, formula, and measurement unit to ensure transparency.
☁️ Cloud-Based Collaboration
Because the dashboard runs on Google Sheets, multiple team members can update and analyze data simultaneously.
⚙️ Automated KPI Calculations
Built-in formulas automatically calculate performance metrics, reducing manual analysis.
What’s Inside the Cybersecurity Incident KPI Dashboard in Google Sheets 📂
This dashboard includes six structured worksheets, each designed to support cybersecurity monitoring and analysis.
📊 Dashboard Sheet
The main page that provides a comprehensive overview of cybersecurity KPIs and performance indicators.
📈 KPI Trend Sheet
Allows users to analyze the performance trend of individual KPIs over time.
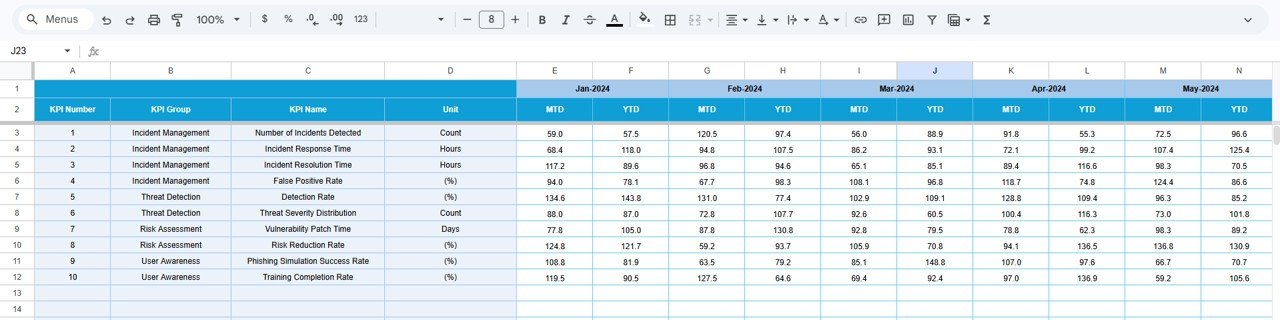
📥 Actual Numbers Sheet
The primary data entry sheet where users enter current year cybersecurity performance values.
🎯 Target Sheet
Stores KPI target values used to measure security performance.
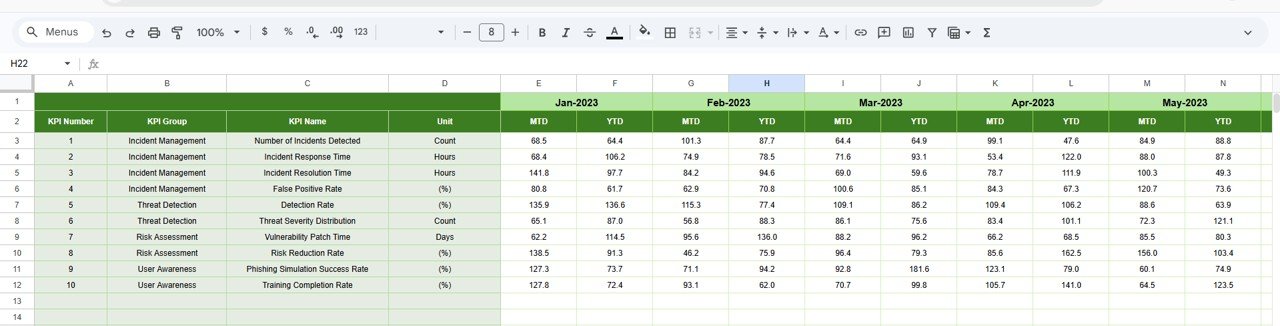
📊 Previous Year Numbers Sheet
Contains historical cybersecurity performance data for comparison.
📘 KPI Definition Sheet
A documentation library that stores KPI formulas, definitions, and measurement units.
Together, these sheets create a complete cybersecurity performance monitoring system.
How to Use the Cybersecurity Incident KPI Dashboard in Google Sheets ⚙️
Using this dashboard is simple and requires only basic Google Sheets knowledge.
1️⃣ Open the dashboard template in Google Sheets.
2️⃣ Enter current cybersecurity performance data in the Actual Numbers Sheet.
3️⃣ Enter KPI targets in the Target Sheet.
4️⃣ Add previous year data in the Previous Year Numbers Sheet.
5️⃣ Select a month from the dropdown menu in the Dashboard Sheet.
6️⃣ Review KPI indicators, performance comparisons, and trend arrows.
7️⃣ Use the KPI Trend Sheet to analyze individual KPI performance.
Because the dashboard automatically calculates results, security teams can quickly evaluate cybersecurity performance.
Who Can Benefit from This Cybersecurity Incident KPI Dashboard in Google Sheets 👥
This dashboard is ideal for organizations that want to monitor cybersecurity performance and incident response efficiency.
🛡 Cybersecurity Teams – Track incident response metrics and threat detection performance.
🏢 IT Security Departments – Monitor system vulnerabilities and security incidents.
🏦 Financial Institutions – Track cybersecurity performance for regulatory compliance.
🏥 Healthcare Organizations – Monitor cybersecurity risks related to sensitive data.
🏭 Corporate IT Teams – Improve incident management and security monitoring.
📊 Security Consultants – Analyze cybersecurity performance for client organizations.
Organizations that prioritize cybersecurity monitoring and risk management can greatly benefit from this dashboard.
Click hare to read the Detailed blog post
Watch the step-by-step video tutorial:
Visit our YouTube channel to learn step-by-step video tutorials
🔗 https://youtube.com/@NeotechNavigators