


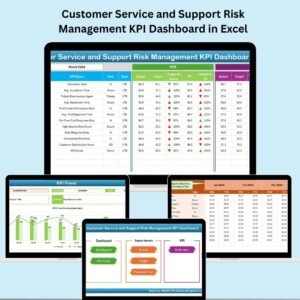
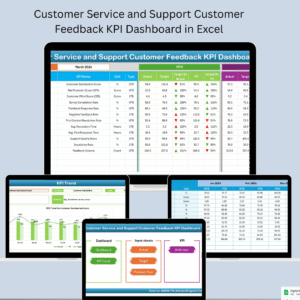
In today’s Customer Service and Support Customer Feedback KPI Dashboard hyper-competitive landscape, businesses must do more than just collect feedback—they must act on it. This dynamic, ready-to-use Excel dashboard helps your team track and improve performance by turning raw feedback into meaningful KPIs that drive real decisions.
💡 Key Features of Customer Feedback KPI Dashboard in Excel
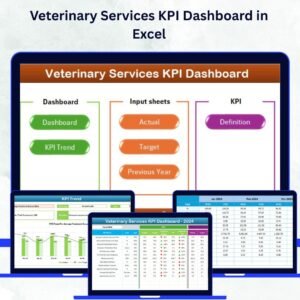
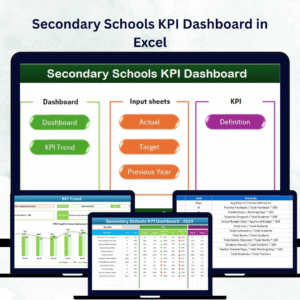
🧭 Home Sheet – Your Navigation Hub

-
Quick-access buttons to navigate all dashboard tabs
-
Simple, clean layout for non-tech users
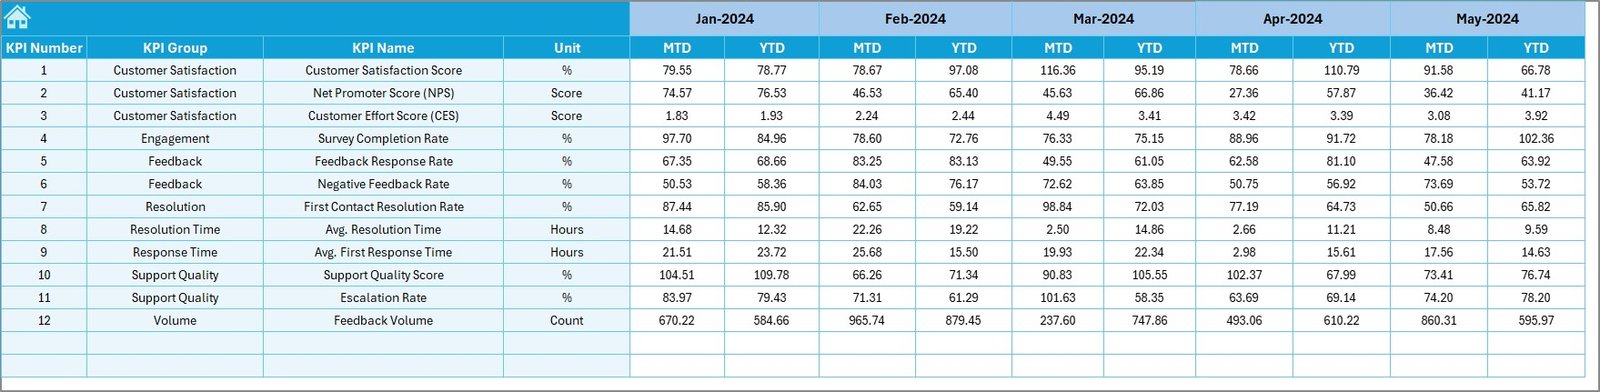
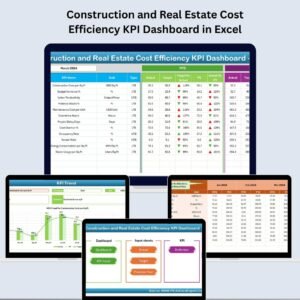
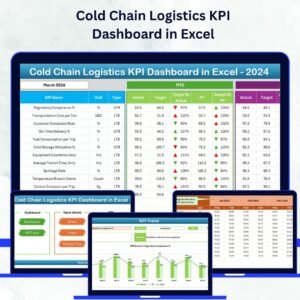
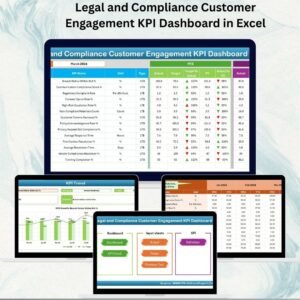
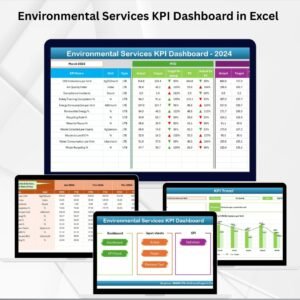
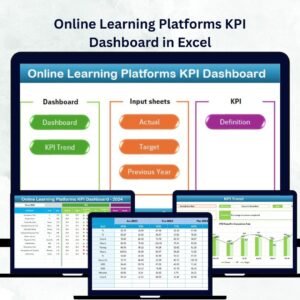
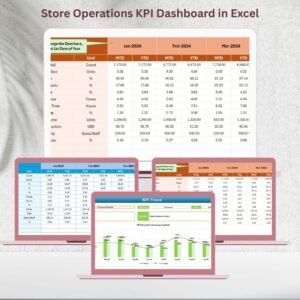
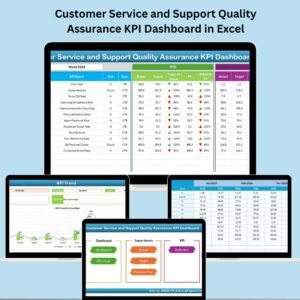
📈 Dashboard Sheet – Real-Time KPI Summary
-
View MTD (Month-to-Date) and YTD (Year-to-Date) metrics
-
Conditional formatting with arrows to show trends vs. targets
-
One-click month selection to auto-update visuals
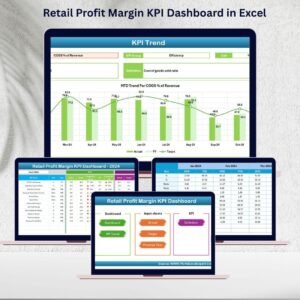
📊 KPI Trend Sheet – Analyze Specific KPIs
-
Drill down into each KPI using a selector
-
View trends across MTD, YTD, and PY (Previous Year)
-
Includes clear chart visuals for all KPI types
✍️ Input & Control Sheets
-
Actual Numbers Input: Feed monthly actuals easily
-
Target Sheet: Define goals for MTD and YTD
-
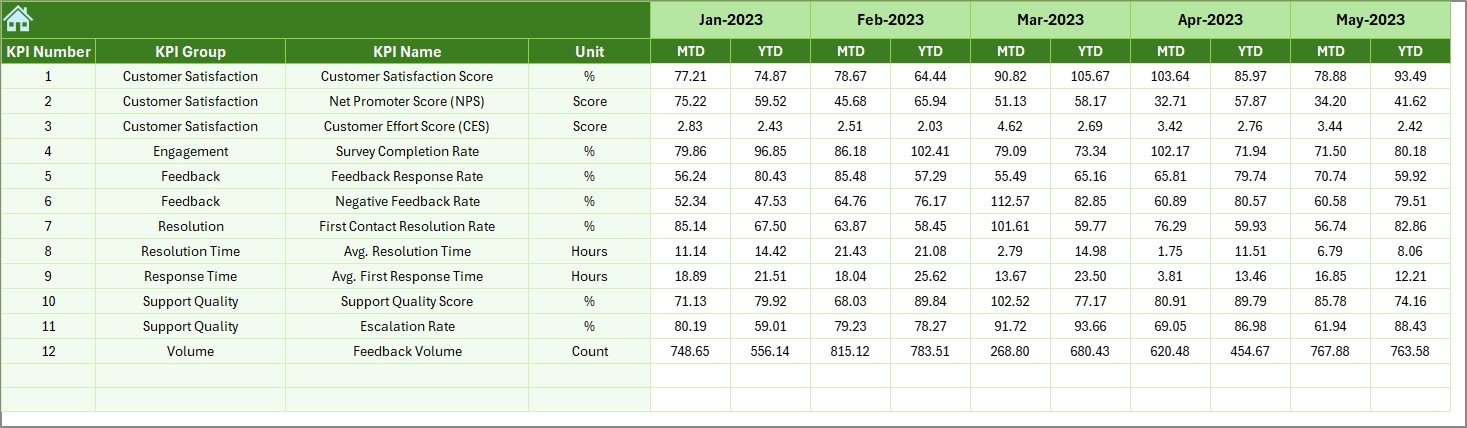
Previous Year Sheet: Benchmark against past performance
-
KPI Definition Sheet: Set standard formulas, units, and definitions for full team clarity
📦 What’s Inside the Customer Feedback KPI Dashboard in Excel
This Excel template includes 7 robust worksheets:
-
✅ Home Sheet – Index to access all pages
-
✅ Dashboard Sheet – Main visual KPI summary
-
✅ KPI Trend Sheet – Deep dive into individual KPIs
-
✅ Actual Numbers Input – Feed your monthly actuals
-
✅ Target Sheet – Enter your KPI goals
-
✅ Previous Year Numbers – Year-over-year comparisons
-
✅ KPI Definition Sheet – Standardize your KPIs
No hidden formulas. No clutter. Just plug in your data and go!
🛠️ How to Use the Customer Feedback KPI Dashboard in Excel
-
📥 Download the Excel dashboard template
-
🧾 Add actual KPI data in the “Actual Numbers Input” tab
-
🎯 Define monthly and yearly targets in the “Target” sheet
-
📅 Input last year’s data in the “Previous Year” tab
-
📌 Use the dropdown to select any month or KPI to analyze
-
📊 View the visual dashboard to track progress
It’s that simple! No tech expertise needed.
👥 Who Can Benefit from This Customer Feedback Dashboard?
This Excel dashboard is perfect for:
-
🎧 Customer Service Managers – Monitor performance with ease
-
💼 Operations Teams – Ensure service quality trends stay on track
-
🧑💻 Support Agents – See how their work impacts results
-
🏢 Small Businesses – Avoid costly BI tools, get actionable insights
-
🧩 Call Centers & Helpdesks – Visualize feedback data for smarter staffing
-
🧠 Quality Assurance Teams – Identify improvement areas fast
-
👥 Customer Success Teams – Align service efforts with customer satisfaction
🔍 Click here to read the Detailed blog post
🎥 Visit our YouTube channel to learn step-by-step video tutorials
👉 YouTube.com/@PKAnExcelExpert


Reviews
There are no reviews yet.