Delivering an exceptional customer experience is at the heart of every successful business. 💡 The Customer Experience (CX) KPI Dashboard in Excel is your ultimate tool to monitor, measure, and enhance customer satisfaction, retention, and loyalty — all in one interactive and easy-to-use Excel template. 📊
This ready-to-use dashboard helps businesses analyze performance across multiple KPIs such as Customer Satisfaction (CSAT), Net Promoter Score (NPS), Customer Retention Rate, Response Time, and more — empowering teams to make data-driven decisions that elevate the customer journey. 🚀
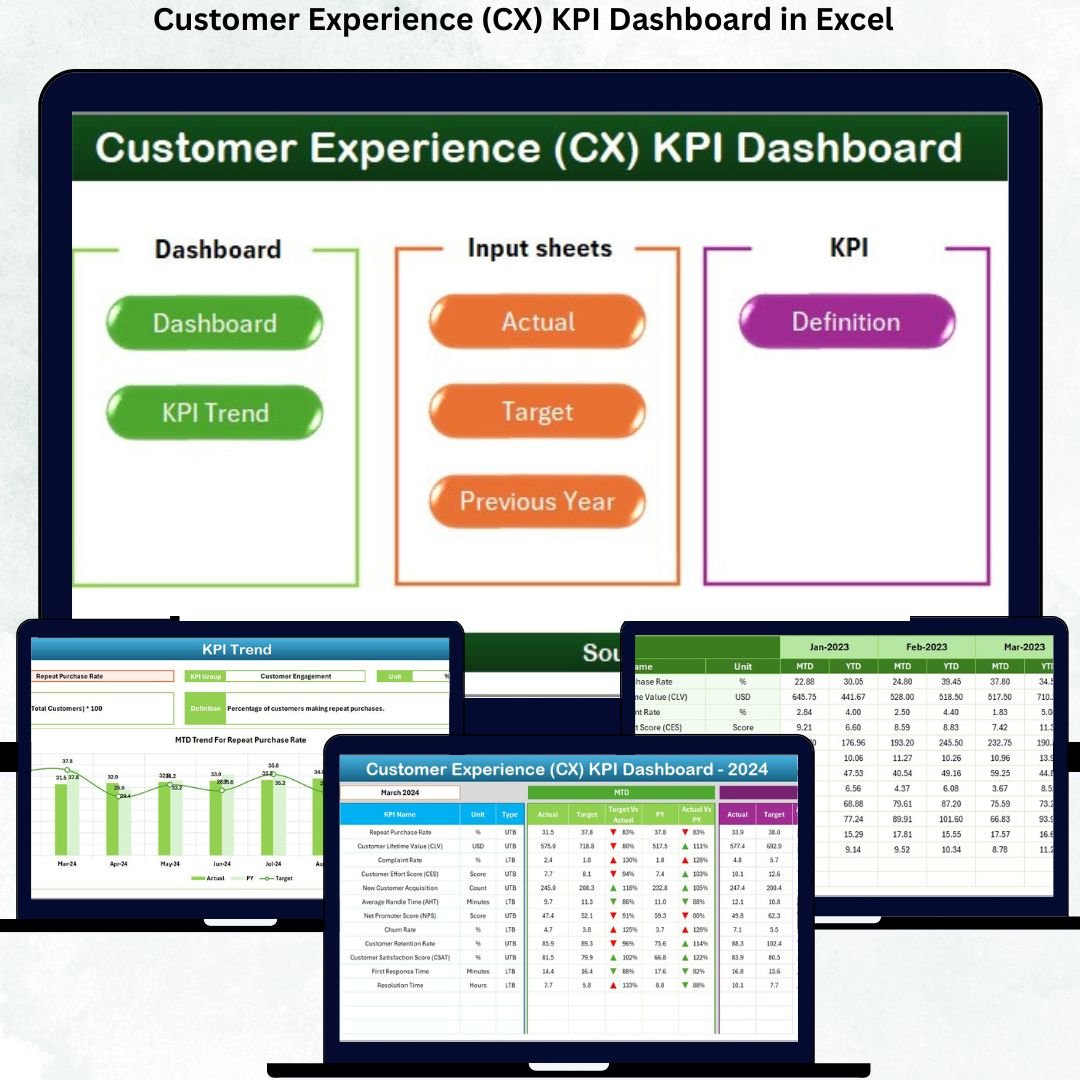
✨ Key Features of Customer Experience (CX) KPI Dashboard in Excel
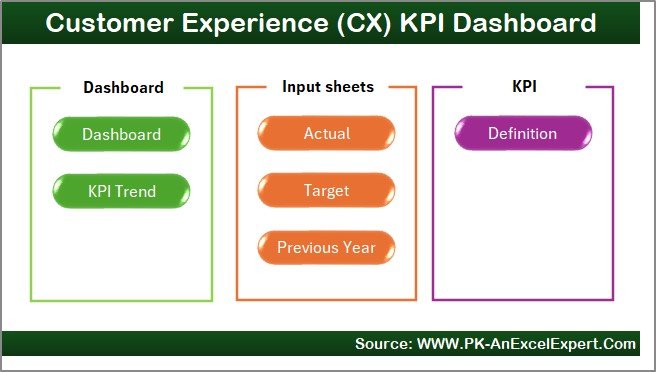
✅ Comprehensive 7-Sheet Structure — The dashboard includes seven well-designed worksheets, each crafted to simplify your CX performance tracking.
✅ Dynamic KPI Visualization — Monitor Month-to-Date (MTD) and Year-to-Date (YTD) results with smart visuals, trend charts, and up/down arrows for instant performance interpretation.
✅ Interactive Month Selection — Easily switch between months from the dropdown in cell D3 and watch all visuals update instantly.
✅ MTD & YTD Comparisons — Compare Actual vs Target and Current Year vs Previous Year for each KPI, highlighted with intuitive conditional formatting.
✅ Clean Navigation — Jump to any sheet directly from the Home Page with interactive buttons for seamless navigation.
✅ Formula-Driven Design — Built with pre-set formulas for accuracy, automation, and zero manual effort.
✅ Fully Customizable — Add or modify KPIs, targets, and visuals to align with your specific business needs.
📂 What’s Inside the Customer Experience (CX) KPI Dashboard in Excel
📘 1. Home Sheet:
A user-friendly index sheet with six buttons that instantly navigate you to all major dashboard sections.
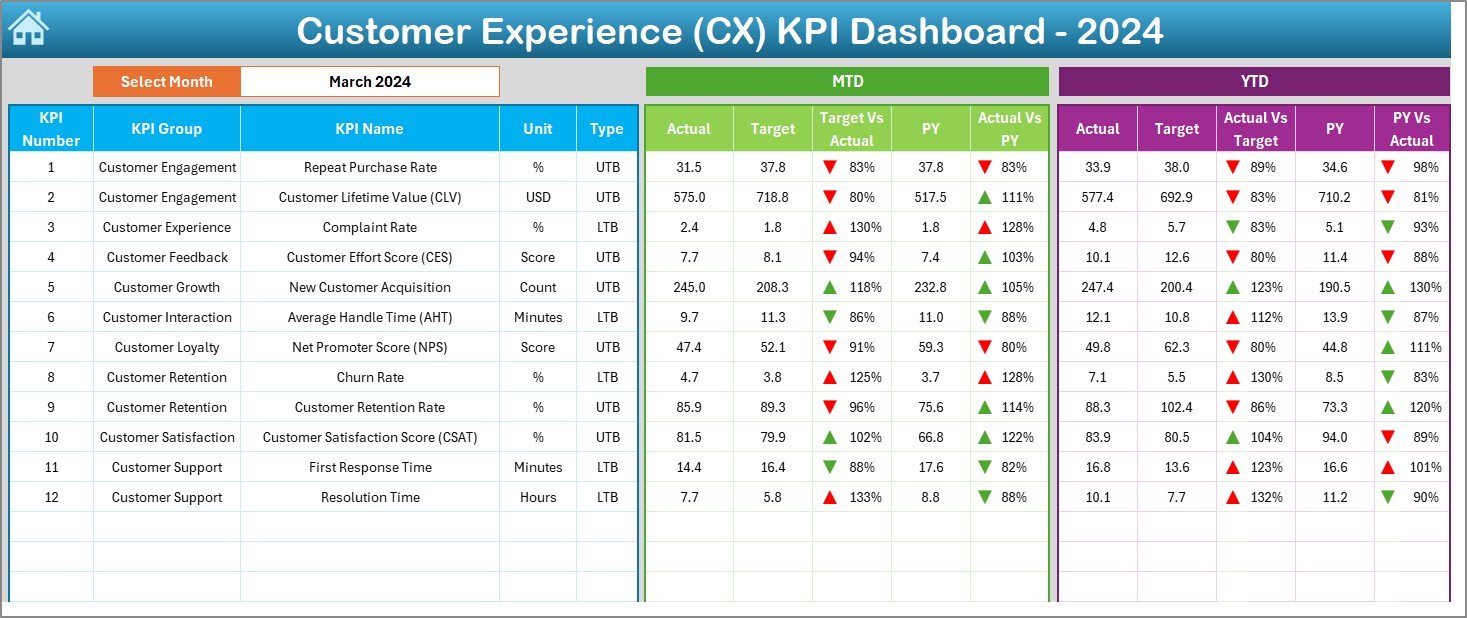
📊 2. Dashboard Sheet Tab:
This is the core of your CX monitoring system. View all KPI metrics — MTD and YTD — with Actual, Target, and Previous Year (PY) comparisons. Conditional formatting arrows highlight improvements 🔺 or declines 🔻 for quick visual insights.
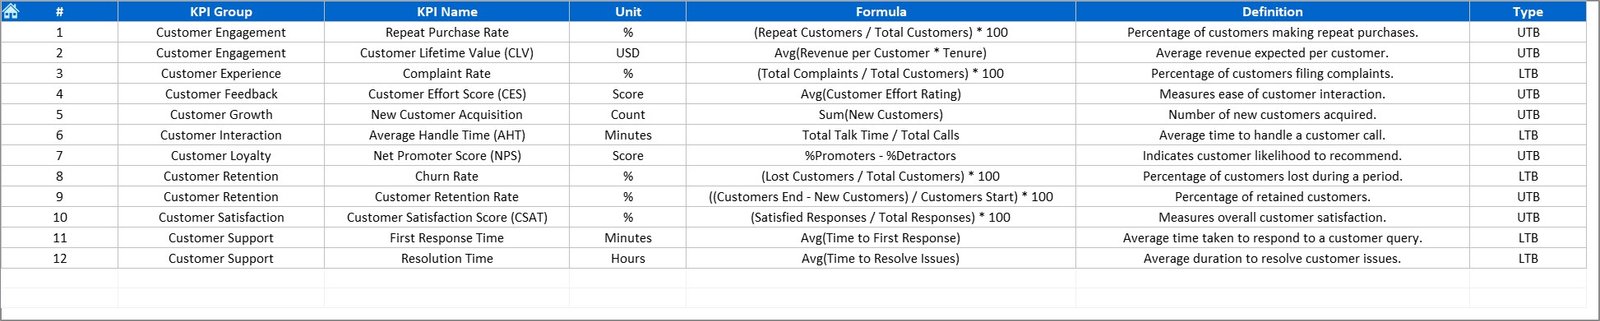
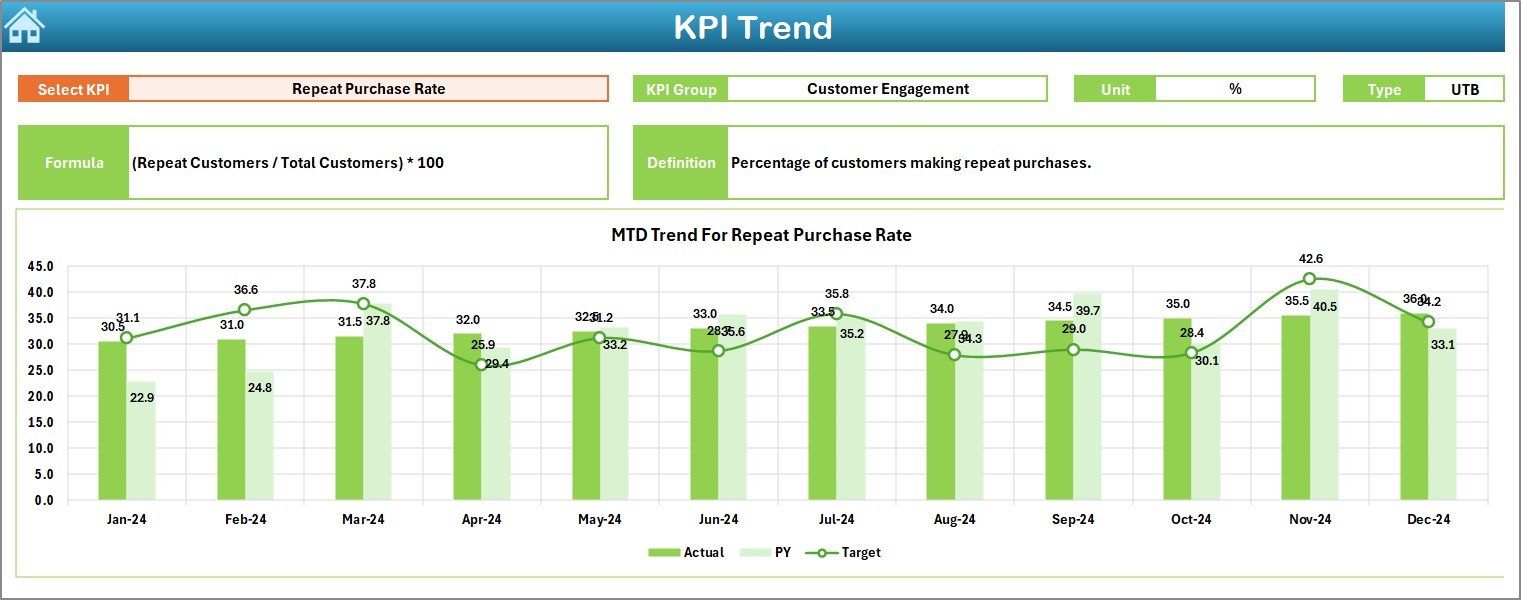
📈 3. KPI Trend Sheet Tab:
Analyze individual KPI trends using the dropdown in cell C3. The sheet displays each KPI’s Group, Unit, Type (LTB or UTB), Formula, and Definition, along with visually engaging trend charts for MTD and YTD data.
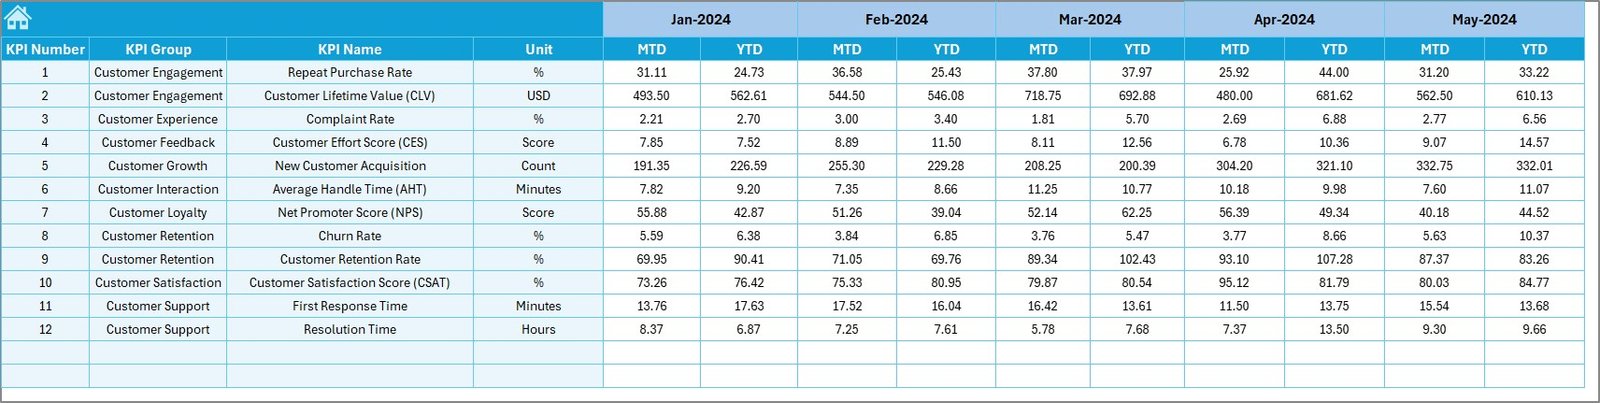
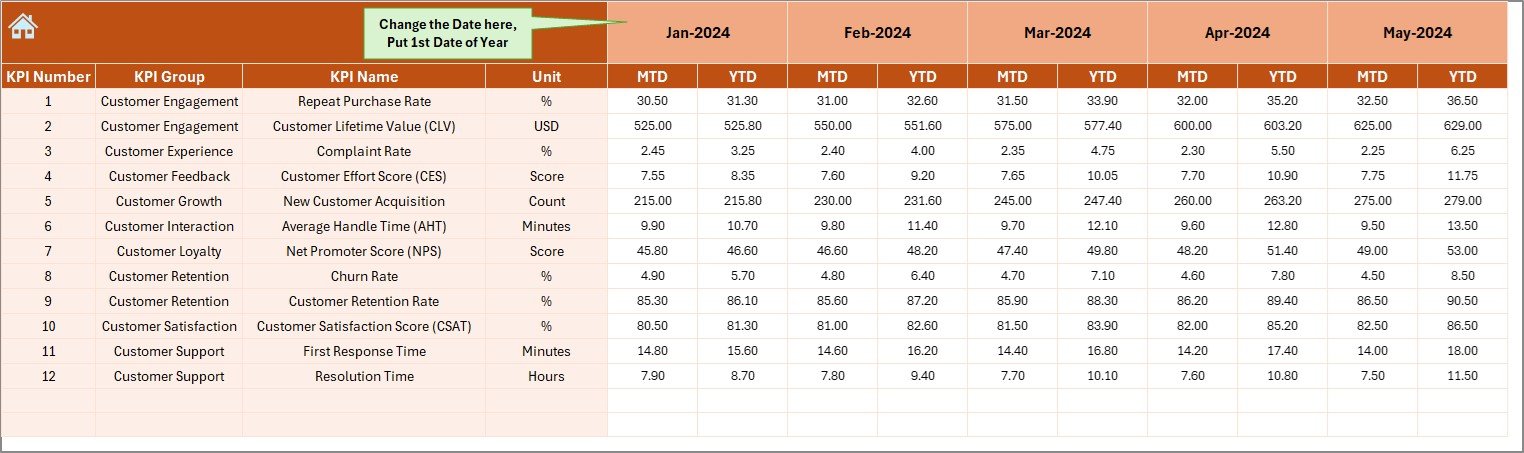
🧾 4. Actual Numbers Input Sheet:
Input MTD and YTD data for each month. You can easily set the starting month in cell E1 to align your fiscal year.
🎯 5. Target Sheet Tab:
Define monthly MTD and YTD target numbers for every KPI here — ensuring your goals are clearly benchmarked.
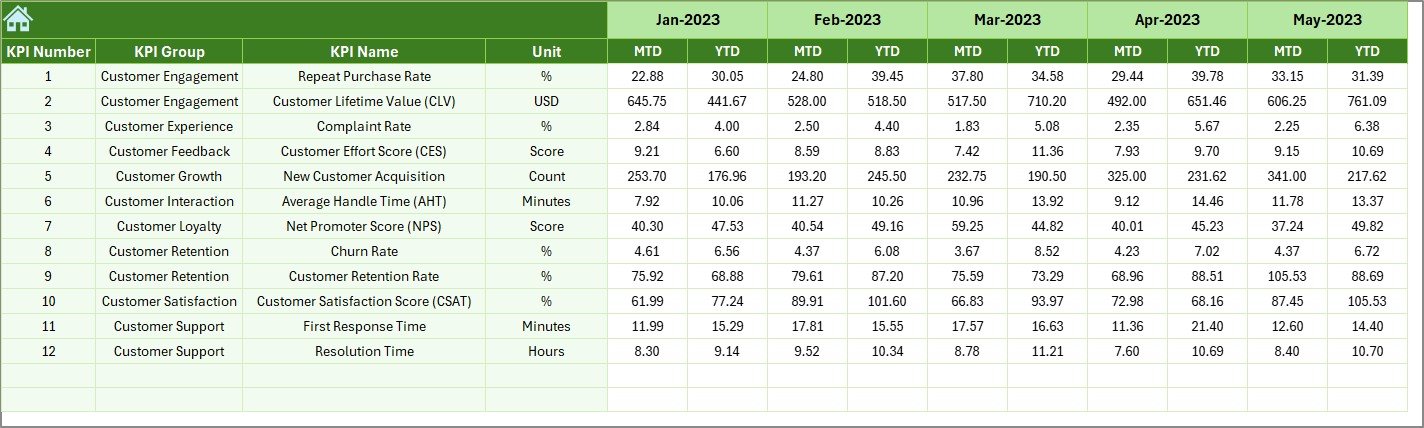
📅 6. Previous Year Numbers Sheet Tab:
Enter historical performance data from the previous year for accurate year-over-year (YoY) comparisons.
📘 7. KPI Definition Sheet Tab:
Record all KPI details, including KPI Name, Group, Unit, Formula, and Definition, creating a reference hub for performance evaluation.
🧭 How to Use the Customer Experience (CX) KPI Dashboard in Excel
1️⃣ Step 1: Open the Excel file and go to the Home Sheet.
2️⃣ Step 2: Click the relevant button to navigate to your desired sheet.
3️⃣ Step 3: Enter your monthly actuals in the Actual Numbers Input Sheet.
4️⃣ Step 4: Update targets in the Target Sheet and previous data in the Previous Year Sheet.
5️⃣ Step 5: Explore the Dashboard Sheet to analyze MTD and YTD results, with color-coded visuals and arrows indicating performance trends.
6️⃣ Step 6: Use the KPI Trend Sheet to review historical patterns and spot areas for improvement.
This structured flow ensures you always have an accurate and visually rich overview of your CX performance. 🌟
👥 Who Can Benefit from This Customer Experience (CX) KPI Dashboard
💼 Customer Experience Managers: Gain instant insights into customer satisfaction, loyalty, and retention trends.
🏢 Marketing Teams: Track brand perception and engagement metrics to fine-tune campaigns.
🧠 Business Analysts: Identify data patterns and measure the impact of customer strategies.
📣 Customer Support Heads: Monitor response times, issue resolution rates, and feedback quality.
💻 CX Consultants & Agencies: Use this dashboard as a ready-to-deliver professional analytics tool for clients.
📊 Executives & Decision-Makers: Get a high-level view of customer performance in one visual report.


Reviews
There are no reviews yet.