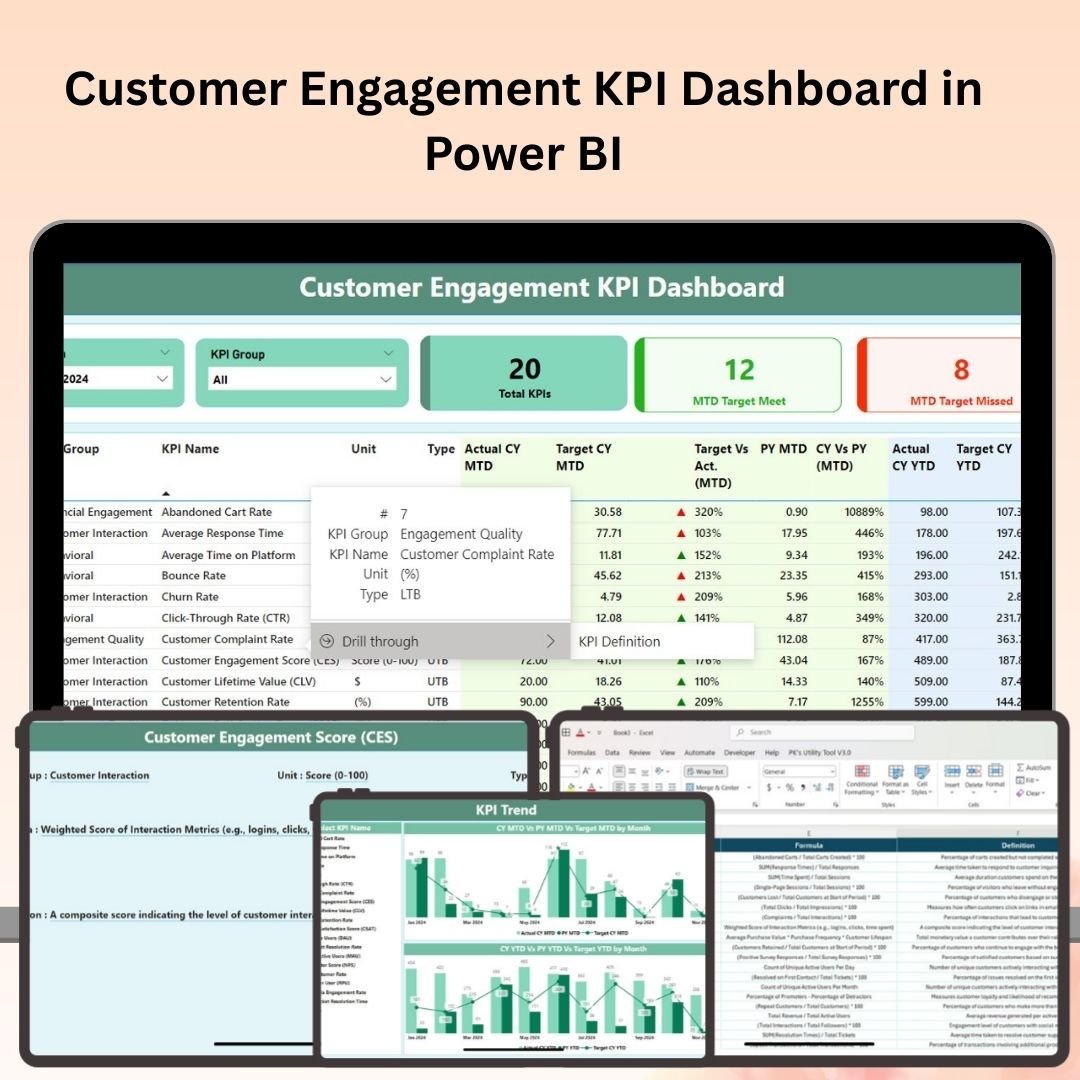


The Customer Engagement KPI Dashboard in Power BI is a comprehensive tool designed to help businesses track, analyze, and optimize customer engagement across various channels. Whether you’re focused on e-commerce, digital marketing, or customer success, this Power BI dashboard provides actionable insights to enhance customer interactions, improve retention rates, and increase overall engagement.
With real-time tracking and visual analytics, this dashboard allows you to measure key customer engagement metrics such as user activity, time spent on site, social media interactions, and customer feedback. It’s designed to empower decision-makers with the data they need to refine strategies, boost engagement, and drive customer loyalty.

Key Features of the Customer Engagement KPI Dashboard in Power BI:
📊 Comprehensive Engagement Metrics
Track critical customer engagement KPIs such as website visits, page views, session duration, bounce rate, and interaction levels across various touchpoints.
🔄 Real-Time Tracking
Monitor real-time customer activity and engagement across different platforms, including websites, mobile apps, social media, and email campaigns, to gain instant insights into your customers’ behavior.
📈 Social Media and Campaign Analysis
Analyze customer engagement from social media platforms (Facebook, Twitter, Instagram, etc.) and digital campaigns to understand how your efforts are resonating with your audience.
💬 Customer Feedback and Sentiment Tracking
Track customer feedback and sentiment from surveys, reviews, and support tickets to measure satisfaction and engagement, identifying areas for improvement.
📅 Customizable Reports and Dashboards
Create interactive and customized reports to present key engagement metrics to stakeholders, helping you optimize customer strategies based on data-driven insights.
🚀 Why You’ll Love the Customer Engagement KPI Dashboard in Power BI:
✅ Optimize Customer Engagement – Track critical engagement metrics to understand how customers interact with your brand and optimize your strategies accordingly.
✅ Boost Retention and Loyalty – Use engagement insights to drive better customer retention and build lasting loyalty.
✅ Real-Time Insights – Access real-time data on customer activity to make timely decisions that positively impact engagement.
✅ Measure Campaign Success – Evaluate the success of marketing and engagement campaigns, including social media interactions, website performance, and email campaigns.
✅ Comprehensive Data Visualization – Use dynamic charts, graphs, and KPIs to visualize customer engagement data and identify trends and opportunities for improvement.
✅ Customizable and Flexible – Tailor the dashboard to suit your business’s unique customer engagement goals, whether you’re focused on a single channel or a multi-platform strategy.
What’s Inside the Customer Engagement KPI Dashboard in Power BI:
- Customer Activity Tracker: Monitor key metrics such as page views, time spent on site, session duration, and interactions across multiple touchpoints.
- Social Media Engagement: Track social media interactions, likes, shares, comments, and overall engagement across various platforms.
- Customer Feedback and Sentiment: Analyze customer satisfaction using feedback, reviews, and sentiment analysis to gauge engagement quality.
- Campaign Performance: Measure the success of marketing campaigns, email outreach, and promotions by analyzing KPIs such as open rates, click-through rates, and conversions.
- Custom Reports and Insights: Generate customizable, interactive reports to visualize engagement data and optimize strategies for improved results.
How to Use the Customer Engagement KPI Dashboard in Power BI:
1️⃣ Download the Template – Access your Power BI file upon purchase.
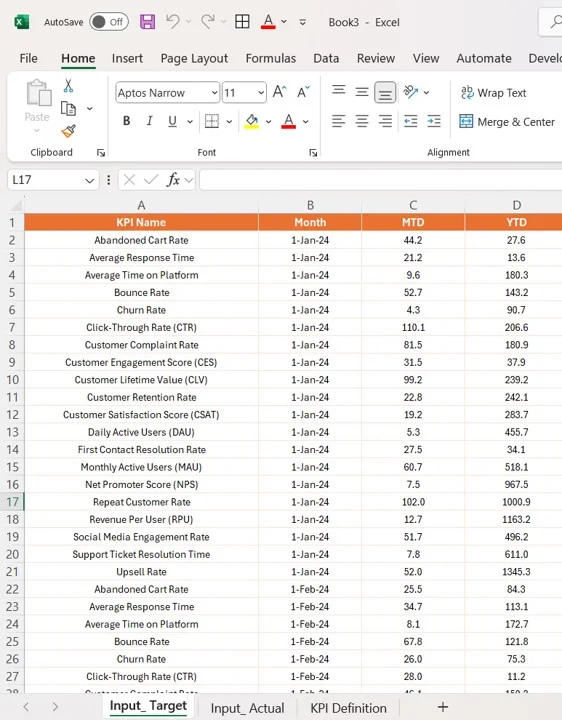
2️⃣ Input Data – Import customer activity data, social media metrics, campaign performance data, and feedback into the dashboard.
3️⃣ Track Engagement Metrics – Use the dashboard to monitor key engagement metrics such as visits, clicks, and interactions in real-time.
4️⃣ Analyze Campaign Performance – Evaluate the effectiveness of your marketing campaigns and engagement strategies to optimize future efforts.
5️⃣ Generate Reports – Create detailed, customizable reports to share insights with stakeholders and enhance customer engagement efforts.
Who Can Benefit from the Customer Engagement KPI Dashboard in Power BI:
- Marketing Managers
- Customer Success Teams
- Digital Marketing Agencies
- E-commerce Businesses
- Brand Managers
- Social Media Managers
- Business Owners
- Data Analysts
The Customer Engagement KPI Dashboard in Power BI is the ideal tool for businesses looking to optimize their customer engagement strategies, track performance, and gain insights that drive better decision-making and increased customer loyalty.
Click here to read the Detailed blog post
https://www.pk-anexcelexpert.com/customer-engagement-kpi-dashboard-in-power-bi/
Visit our YouTube channel to learn step-by-step video tutorials
Youtube.com/@PKAnExcelExpert


Reviews
There are no reviews yet.