
Increasing revenue does not always require acquiring new customers. In fact, one of the most profitable growth strategies for any business is cross-selling—selling additional or complementary products to existing customers. When done correctly, cross-selling improves customer lifetime value, boosts margins, and strengthens customer relationships.Cross-Selling KPI Dashboard in Google Sheets
However, many organizations struggle to track cross-selling performance accurately. Sales teams often rely on raw sales reports that lack clarity, trends, and actionable insights. Without proper visibility, opportunities remain hidden and strategies become guesswork.Cross-Selling KPI Dashboard in Google Sheets
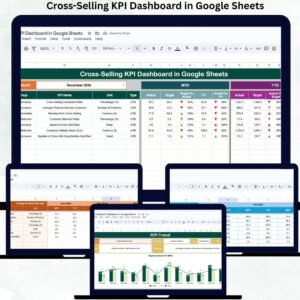
The Cross-Selling KPI Dashboard in Google Sheets solves this problem by converting raw sales data into meaningful, performance-driven KPIs. This ready-to-use dashboard allows sales leaders, marketing teams, and business managers to monitor cross-selling effectiveness, track targets, and compare performance across months and years. Because it runs entirely in Google Sheets, the dashboard remains flexible, collaborative, and easy to maintain—without expensive BI tools.
🚀 Key Features of the Cross-Selling KPI Dashboard
✅ Centralized cross-selling performance tracking
✅ MTD and YTD KPI monitoring
✅ Target vs actual comparison
✅ Previous year benchmarking
✅ KPI trend analysis
✅ Clear KPI definitions for governance
✅ Automated calculations
✅ Fully built in Google Sheets
This dashboard helps teams turn cross-selling data into revenue-driving insights.
📊 What’s Inside the Cross-Selling KPI Dashboard
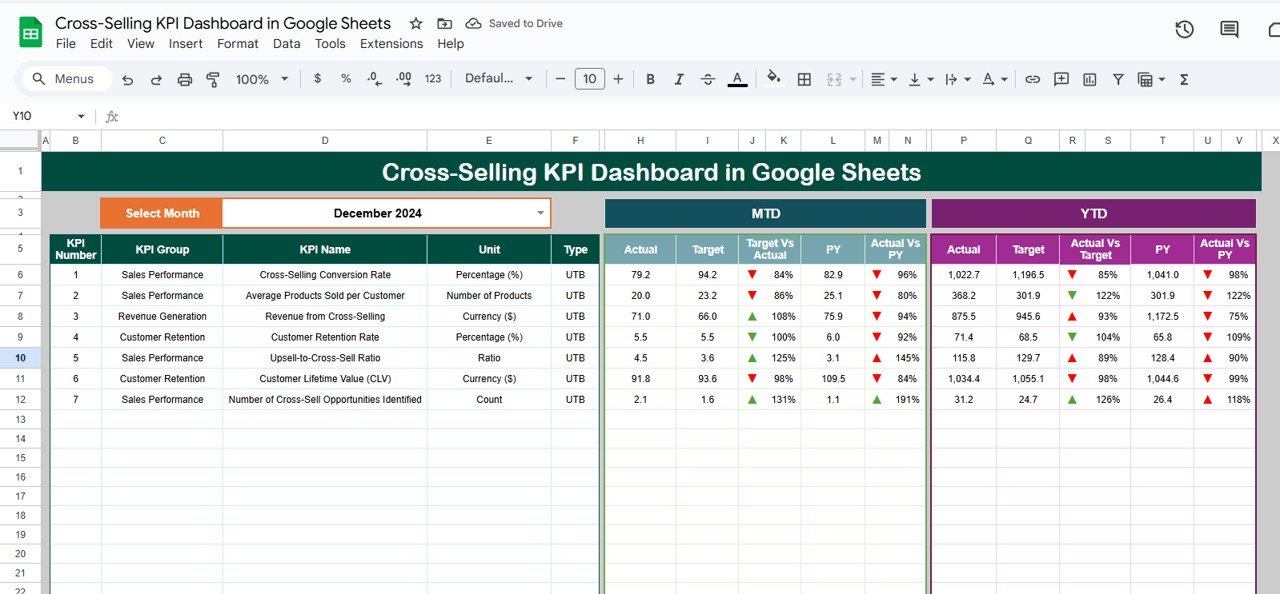
🧭 Dashboard Sheet Tab – Executive Overview
This is the main decision-making page for sales leadership.
You select the Month from the dropdown in cell D3, and the entire dashboard updates automatically.
MTD (Month-to-Date) Section Includes:
-
MTD Actual
-
MTD Target
-
MTD Previous Year
-
Target vs Actual
-
Previous Year vs Actual
YTD (Year-to-Date) Section Includes:
-
YTD Actual
-
YTD Target
-
YTD Previous Year
-
Target vs Actual
-
Previous Year vs Actual
Smart conditional formatting with up and down arrows highlights positive and negative performance instantly, helping managers react quickly.
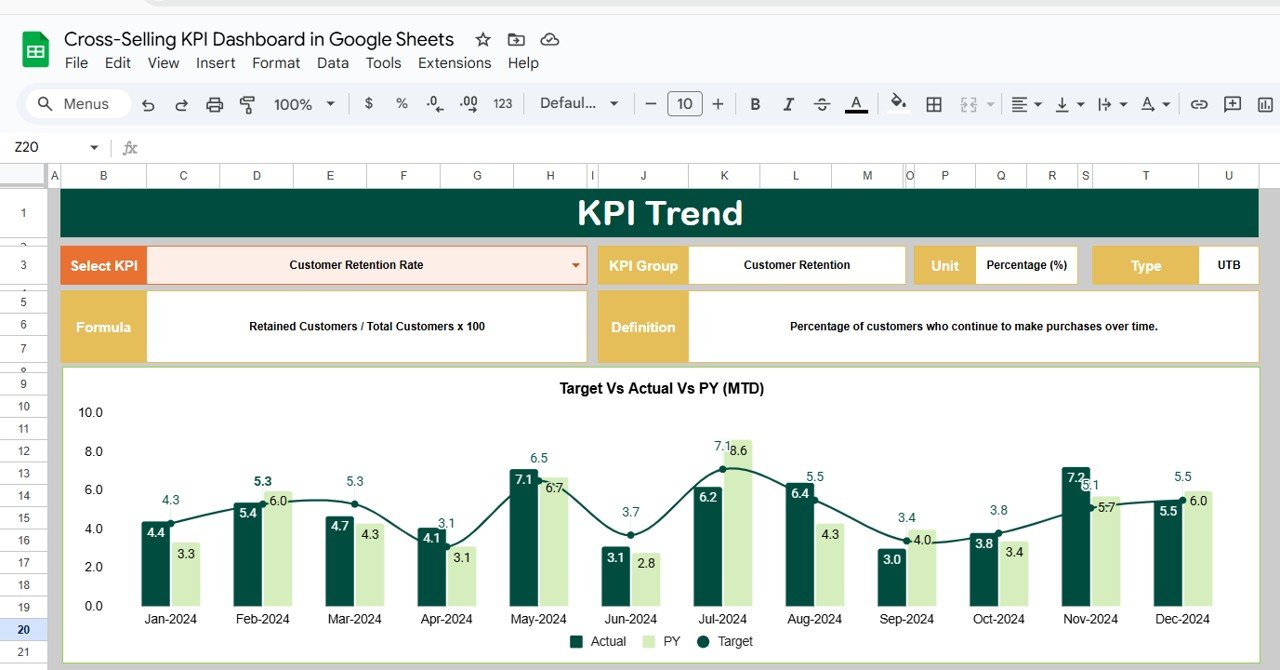
📈 KPI Trend Sheet Tab – Deep KPI Analysis
This sheet supports detailed KPI-level diagnostics.
From the dropdown in cell C3, you select a KPI, and the sheet displays:
-
KPI Group
-
KPI Unit
-
KPI Type (Upper the Better / Lower the Better)
-
KPI Formula
-
KPI Definition
A month-wise trend chart shows how cross-selling KPIs behave over time. Teams can easily spot seasonality, dips, growth patterns, and improvement opportunities.
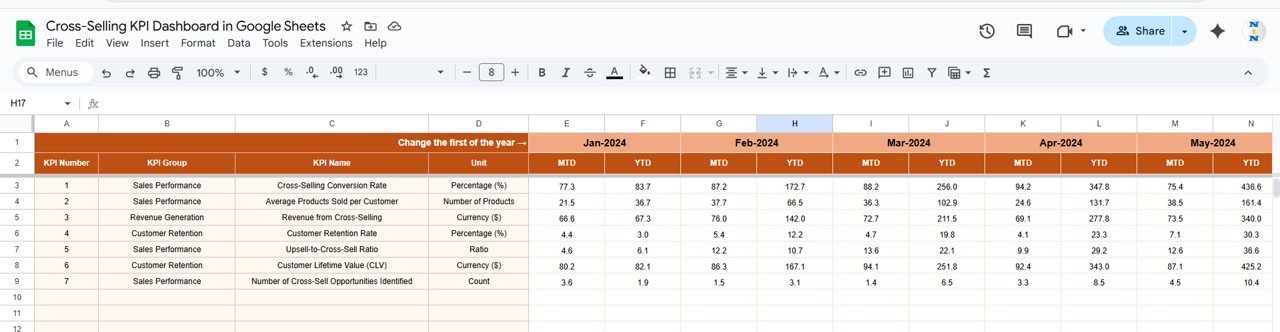
🧮 Actual Number Sheet Tab
This sheet stores real cross-selling performance values.
-
Enter MTD Actual and YTD Actual data
-
Specify the first month of the year in cell E1
-
The dashboard refreshes automatically
This sheet acts as the foundation of all calculations and visuals.
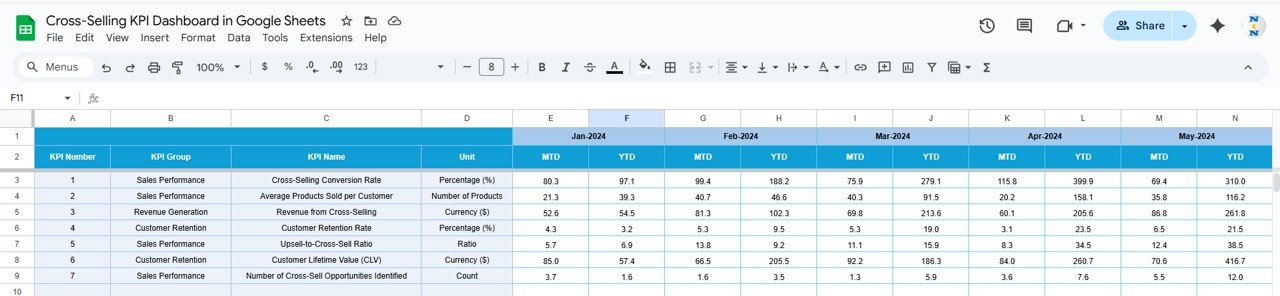
🎯 Target Sheet Tab
This sheet contains cross-selling performance goals:
-
Monthly (MTD) targets
-
Annual (YTD) targets
Targets allow teams to measure whether cross-selling strategies are delivering expected results.
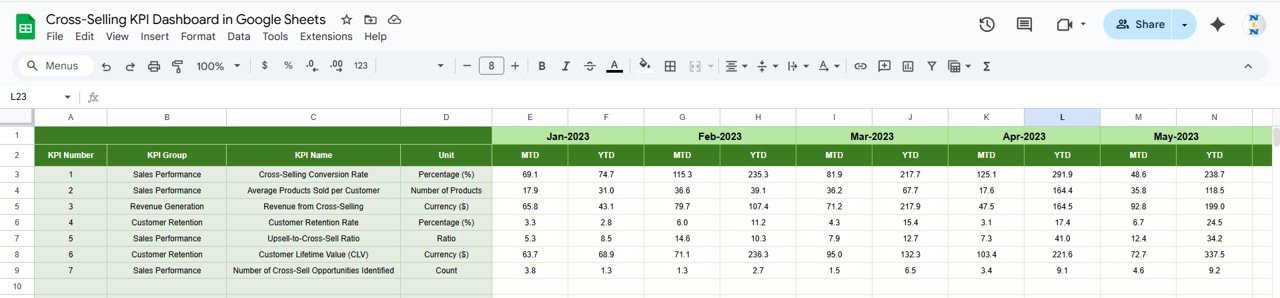
⏳ Previous Year Number Sheet Tab
This sheet stores last year’s performance data.
It enables:
-
Year-over-year comparison
-
Measurement of improvement impact
-
Long-term trend analysis
Sales leaders can clearly evaluate growth maturity.
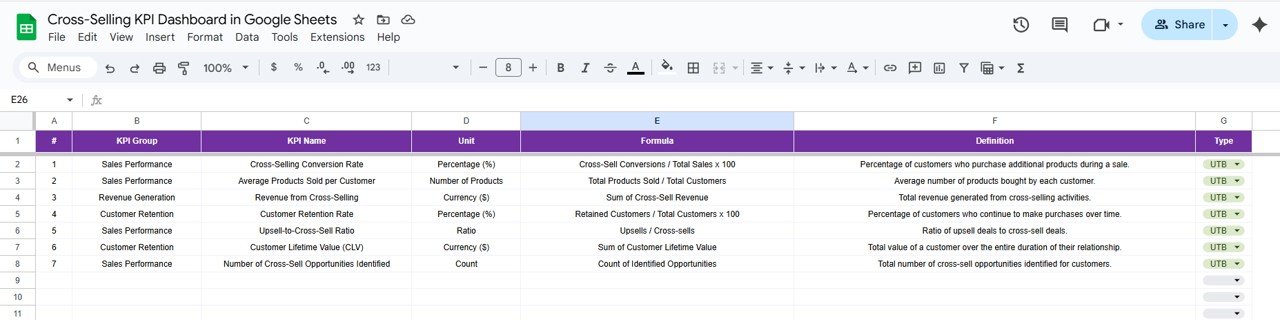
📚 KPI Definition Sheet Tab
This reference sheet ensures clarity and consistency across teams.
It includes:
-
KPI Name
-
KPI Group
-
Unit
-
Formula
-
Definition
-
KPI Type (LTB / UTB)
This avoids confusion and improves reporting governance.
⚙️ How to Use the Cross-Selling KPI Dashboard
1️⃣ Enter actual cross-selling performance data
2️⃣ Define monthly and yearly targets
3️⃣ Review MTD and YTD comparisons
4️⃣ Analyze KPI trends and gaps
5️⃣ Optimize cross-selling strategies accordingly
No coding or BI knowledge required.
👥 Who Can Benefit from This Dashboard
-
📊 Sales Managers
-
🧑💼 Account Managers
-
📣 Marketing Teams
-
🎯 Revenue & Growth Teams
-
🧩 Business Leadership
Ideal for retail, SaaS, e-commerce, banking, insurance, and B2B services.
✅ Advantages of the Cross-Selling KPI Dashboard
✔ Clear visibility into cross-selling effectiveness
✔ Improved revenue optimization
✔ Better product bundling strategies
✔ Data-driven sales planning
✔ Faster decision-making
✔ Easy Google Sheets collaboration
🔧 Opportunities for Improvement
You can enhance the dashboard by adding:
-
CRM or POS integrations
-
Customer segmentation analysis
-
Channel-wise cross-sell tracking
-
Predictive analytics
-
AI-driven product pairing insights
✅ Best Practices
-
Update sales data regularly
-
Review MTD and YTD KPIs together
-
Analyze missed cross-sell opportunities
-
Align sales incentives with KPIs
-
Focus on high-margin products
-
Maintain KPI definitions consistently
✅ Conclusion
A Cross-Selling KPI Dashboard in Google Sheets empowers businesses to unlock hidden revenue from existing customers. It transforms scattered sales data into structured, actionable insights that improve selling strategies and profitability. Because it is simple, flexible, and collaborative, this dashboard becomes a powerful tool for sales-driven organizations seeking smarter growth—without complex tools.
Click here to read the Detailed Blog Post
Watch the step-by-step video tutorial:


Reviews
There are no reviews yet.