Running a credit union today means balancing member satisfaction, loan growth, delinquency risk, branch efficiency, and product performance—all at the same time. When data is spread across multiple Excel files and static reports, insights arrive late and decisions lose impact.
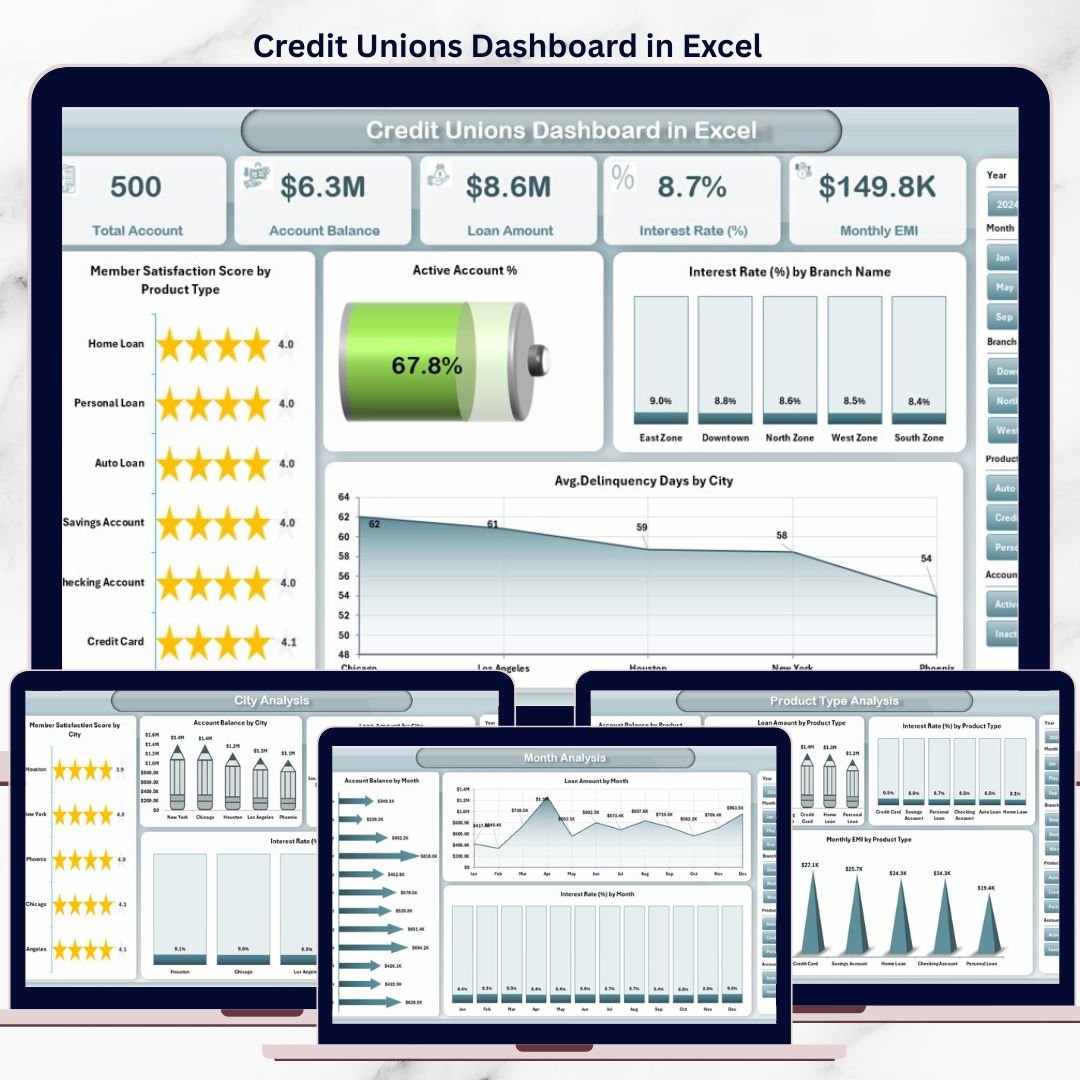
The Credit Unions Dashboard in Excel is a ready-to-use, professionally designed Excel solution that transforms raw credit union data into interactive KPIs, dynamic charts, and actionable insights—all in one centralized workbook.
Instead of switching between reports, this dashboard gives leadership teams a single source of truth to monitor performance, identify risks early, and act with confidence. Built entirely in Excel, it delivers enterprise-level analytics without expensive BI tools or complex systems.
🚀 Key Features of Credit Unions Dashboard in Excel
📌 Centralized Credit Union Reporting
Track member satisfaction, loans, balances, interest rates, EMIs, and delinquency metrics in one Excel dashboard.
📊 Interactive Pivot Charts & KPI Cards
All charts update instantly when data is refreshed or slicers are applied.
🧭 Built-In Page Navigator
Jump between Overview, Branch, Product, City, and Month analysis pages with a single click.
🎯 Dynamic Slicers for Quick Filtering
Analyze performance by branch name, product type, city, and month effortlessly.
📈 Multi-Level Performance Analysis
Understand trends across branches, products, regions, and time periods.
⚙️ 100% Excel-Based & Cost-Effective
No Power BI, no add-ins, no external tools—just Excel.
🎨 Clean & Executive-Ready Design
Structured layout suitable for meetings, reviews, and presentations.
📦 What’s Inside the Credit Unions Dashboard in Excel
📁 Data Sheet
A structured table where you enter or paste raw credit union data such as member satisfaction score, account balance, loan amount, interest rate, EMI, delinquency days, branch, city, product type, and month.
📁 Support Sheet
Manages calculations, helper logic, and mappings to keep the dashboard fast and organized.
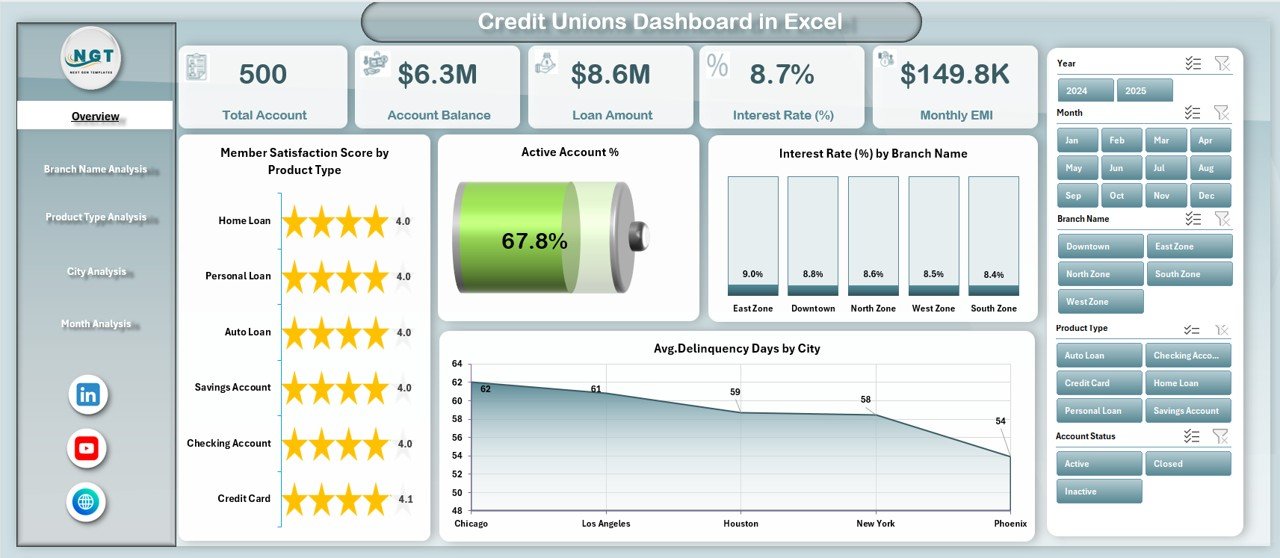
📁 Overview Page
High-level snapshot with KPI cards and summary charts for instant performance visibility.
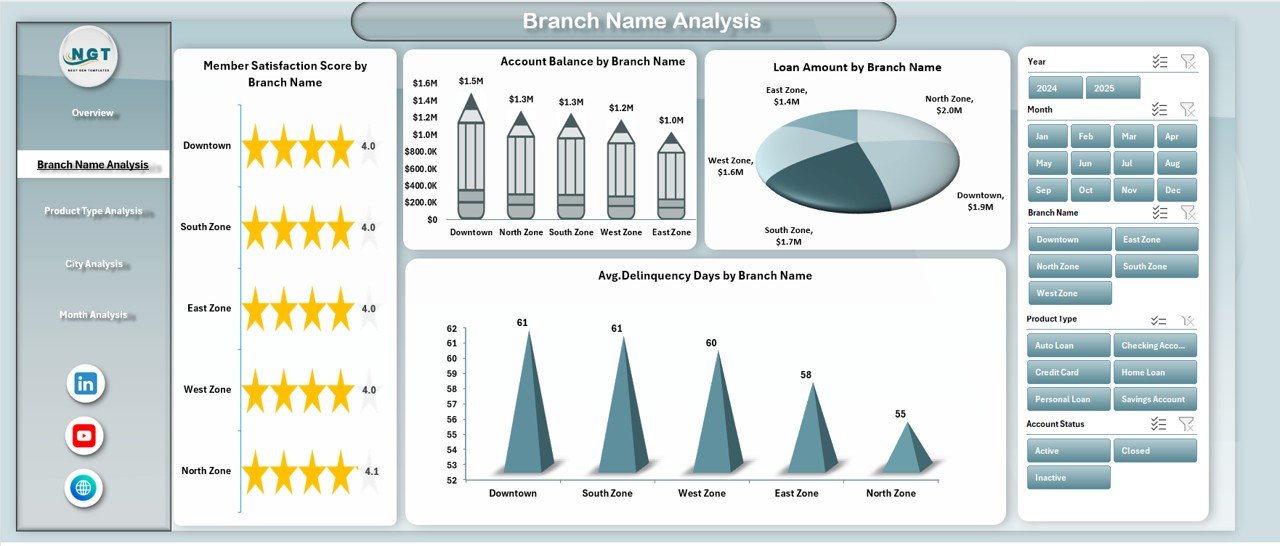
📁 Branch Name Analysis Page
Compare branch-wise satisfaction, balances, loans, and delinquency risks.
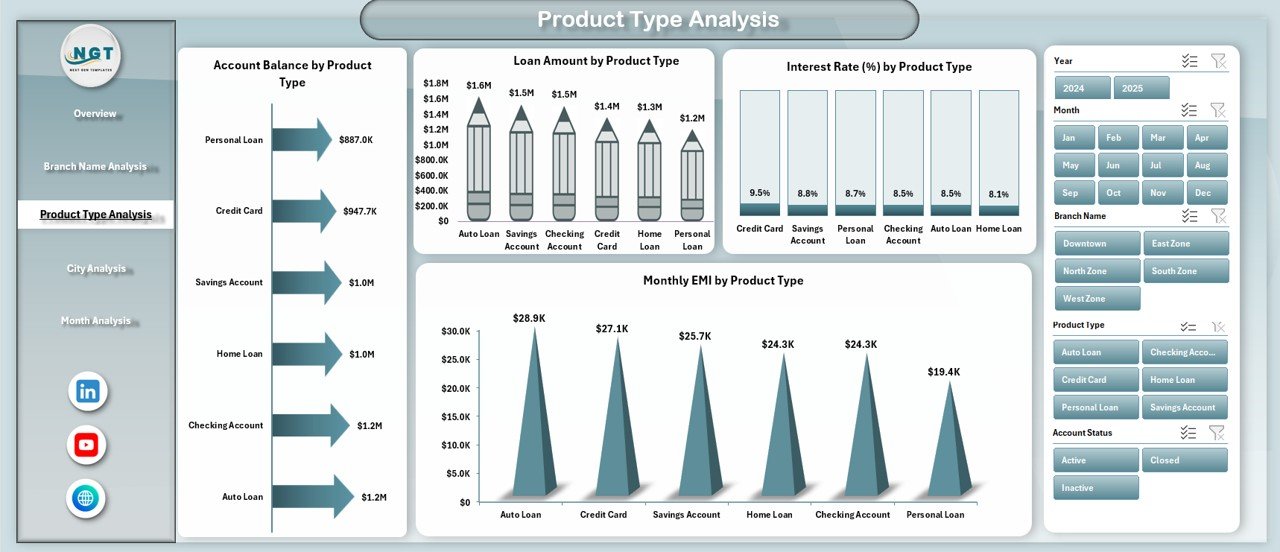
📁 Product Type Analysis Page
Evaluate financial products by balances, loans, interest rates, and EMIs.
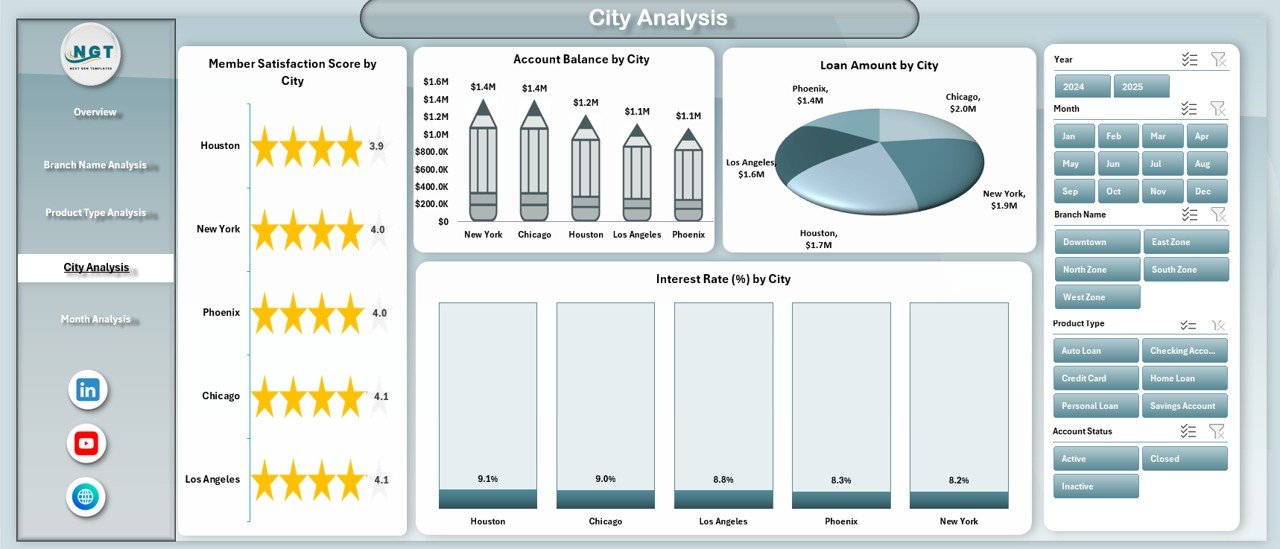
📁 City Analysis Page
Understand geographic performance, regional demand, and city-level risks.
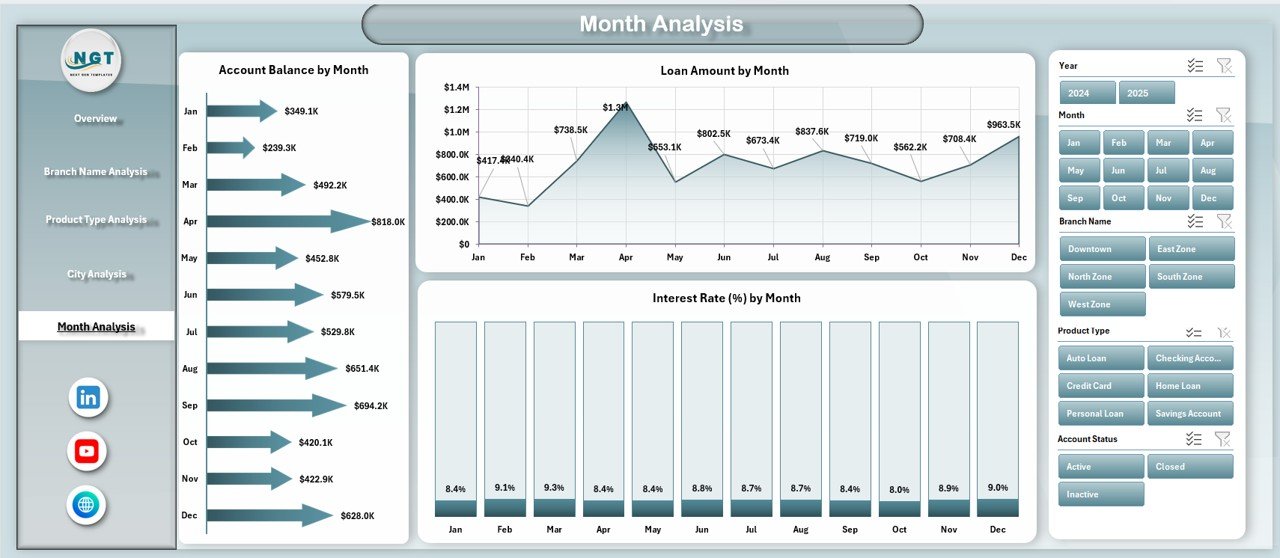
📁 Month Analysis Page
Track monthly trends, seasonality, and growth momentum.
📁 Page Navigator Panel
Quick navigation for smooth user experience.
🛠️ How to Use the Credit Unions Dashboard in Excel
1️⃣ Enter or update data in the Data Sheet
2️⃣ Refresh pivot tables with one click
3️⃣ Use slicers to filter by branch, product, city, or month
4️⃣ Navigate pages using the Page Navigator
5️⃣ Review KPIs, trends, and comparisons instantly
6️⃣ Customize charts, KPIs, or colors as needed
No advanced Excel skills are required—the dashboard is built for everyday users.
👥 Who Can Benefit from This Credit Unions Dashboard
🏦 Credit Union Executives – Monitor performance and strategic KPIs
📊 Branch Managers – Compare branch efficiency and member satisfaction
💼 Loan & Finance Teams – Track balances, loans, EMIs, and interest trends
⚠️ Risk & Compliance Teams – Identify delinquency risks early
📈 Operations & Strategy Teams – Support data-driven growth decisions
If your credit union uses Excel, this dashboard fits seamlessly into your workflow.
📘 Click here to read the Detailed blog post
🎥 Visit our YouTube channel to learn step-by-step video tutorials
👉 Youtube.com/@PKAnExcelExpert


Reviews
There are no reviews yet.