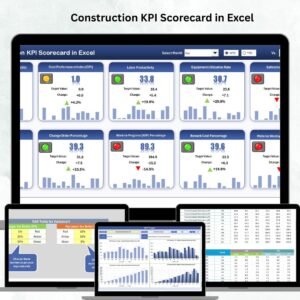
Managing construction projects requires precise monitoring of key performance indicators (KPIs) to ensure timelines, budgets, safety, and quality standards are met. The Construction KPI Scorecard in Excel is a ready-to-use performance management tool that helps project managers, site engineers, and executives track KPIs, identify issues, and take corrective actions quickly.
With this professional scorecard, you can evaluate monthly and yearly performance, visualize KPI trends, and compare actual values against targets. By consolidating all metrics into one structured template, it empowers construction teams to make informed, data-driven decisions that improve project outcomes.
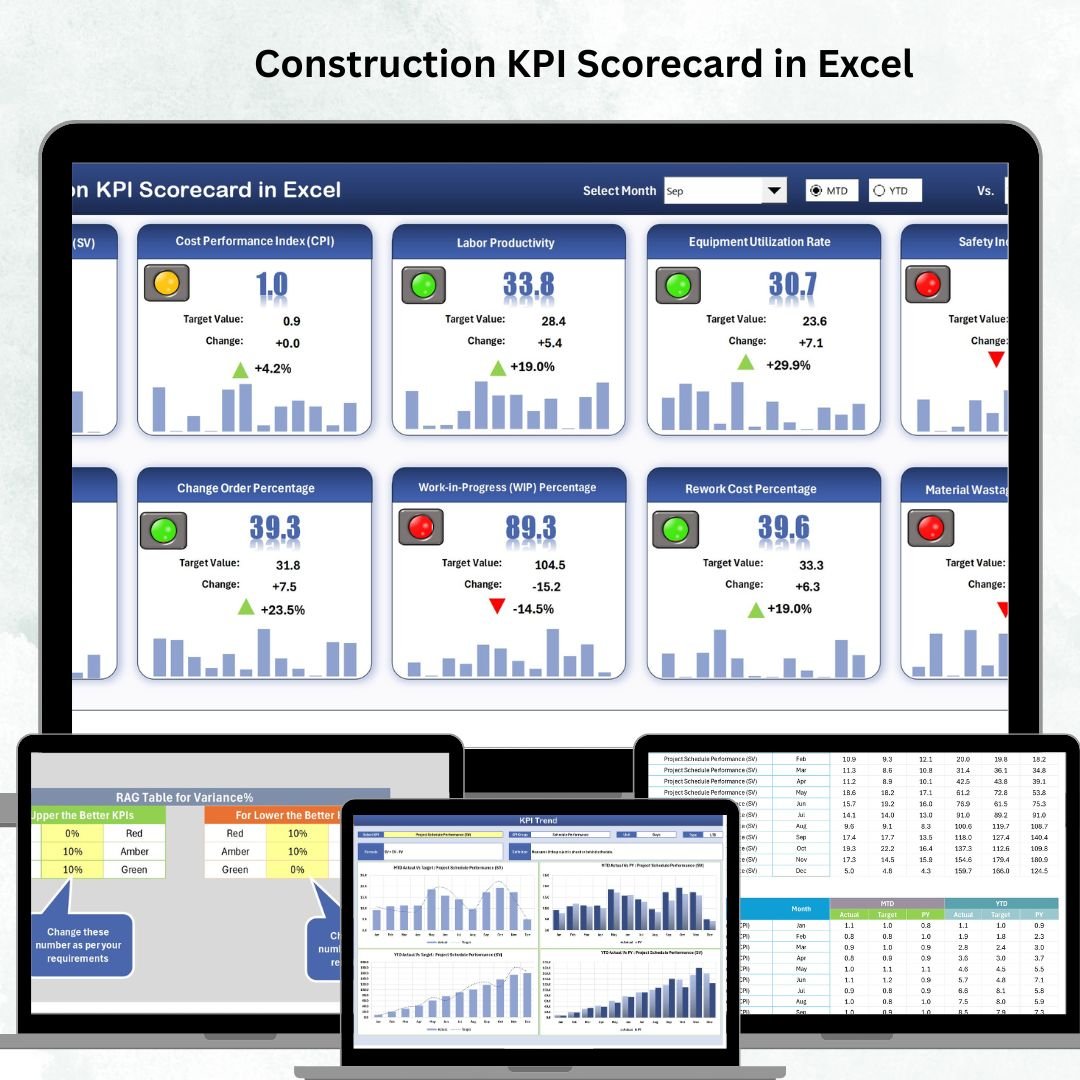
🔑 Key Features of the Construction KPI Scorecard
📋 Monthly & Yearly Scorecard
-
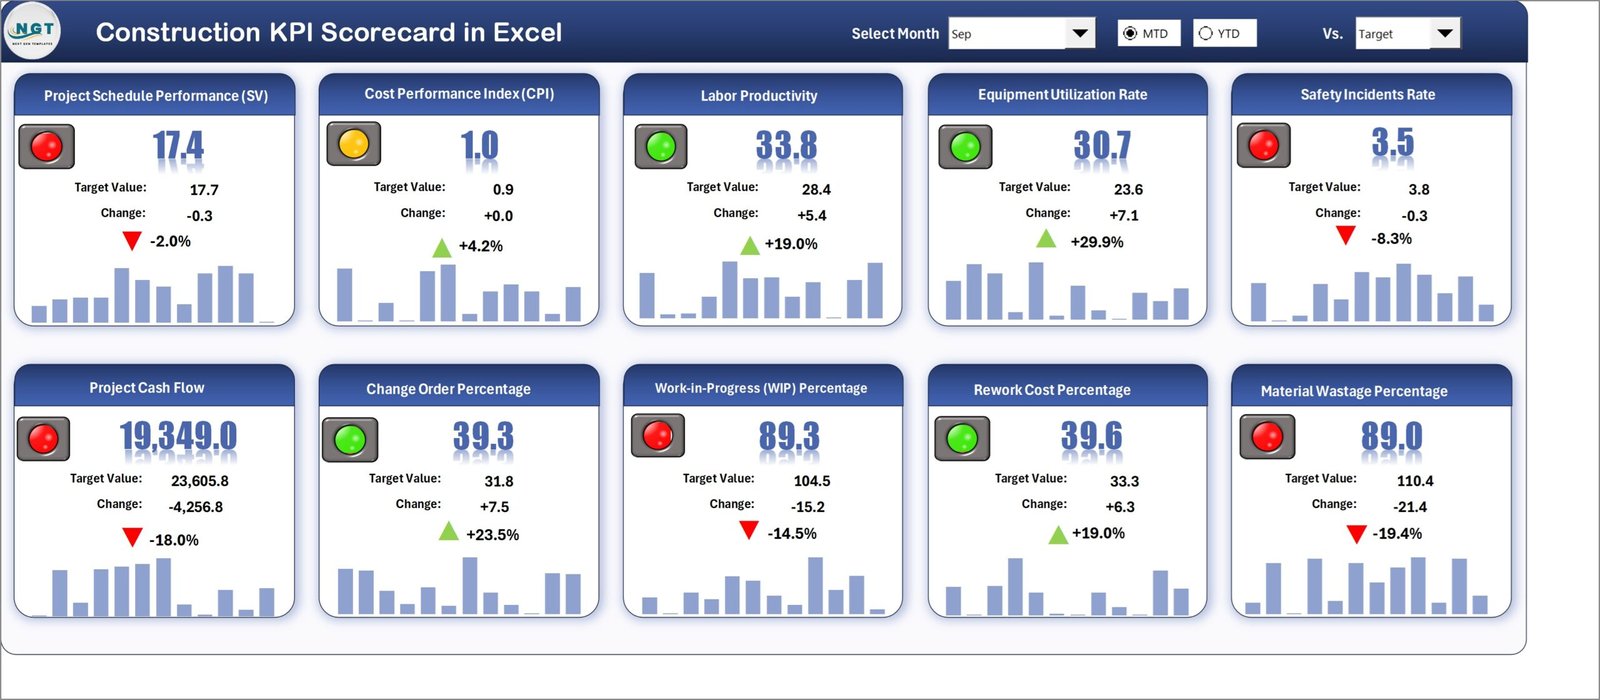
Dropdown to select any month for MTD (Month-to-Date) performance
-
YTD (Year-to-Date) cumulative metrics for overall progress
-
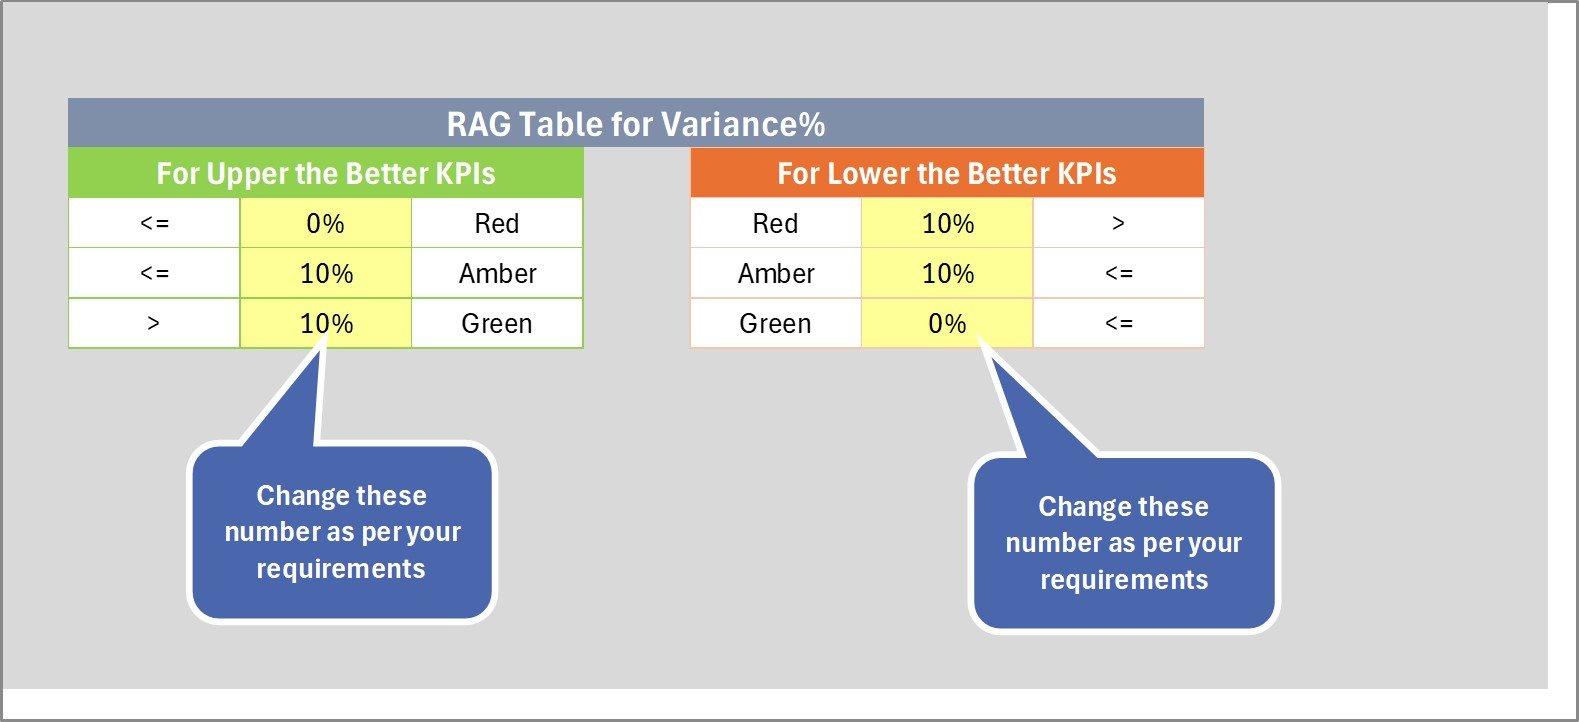
Traffic lights (Red/Yellow/Green) for instant KPI evaluation
-
Up/Down arrows to track KPI percentage changes
-
Side-by-side Actual vs Target comparisons
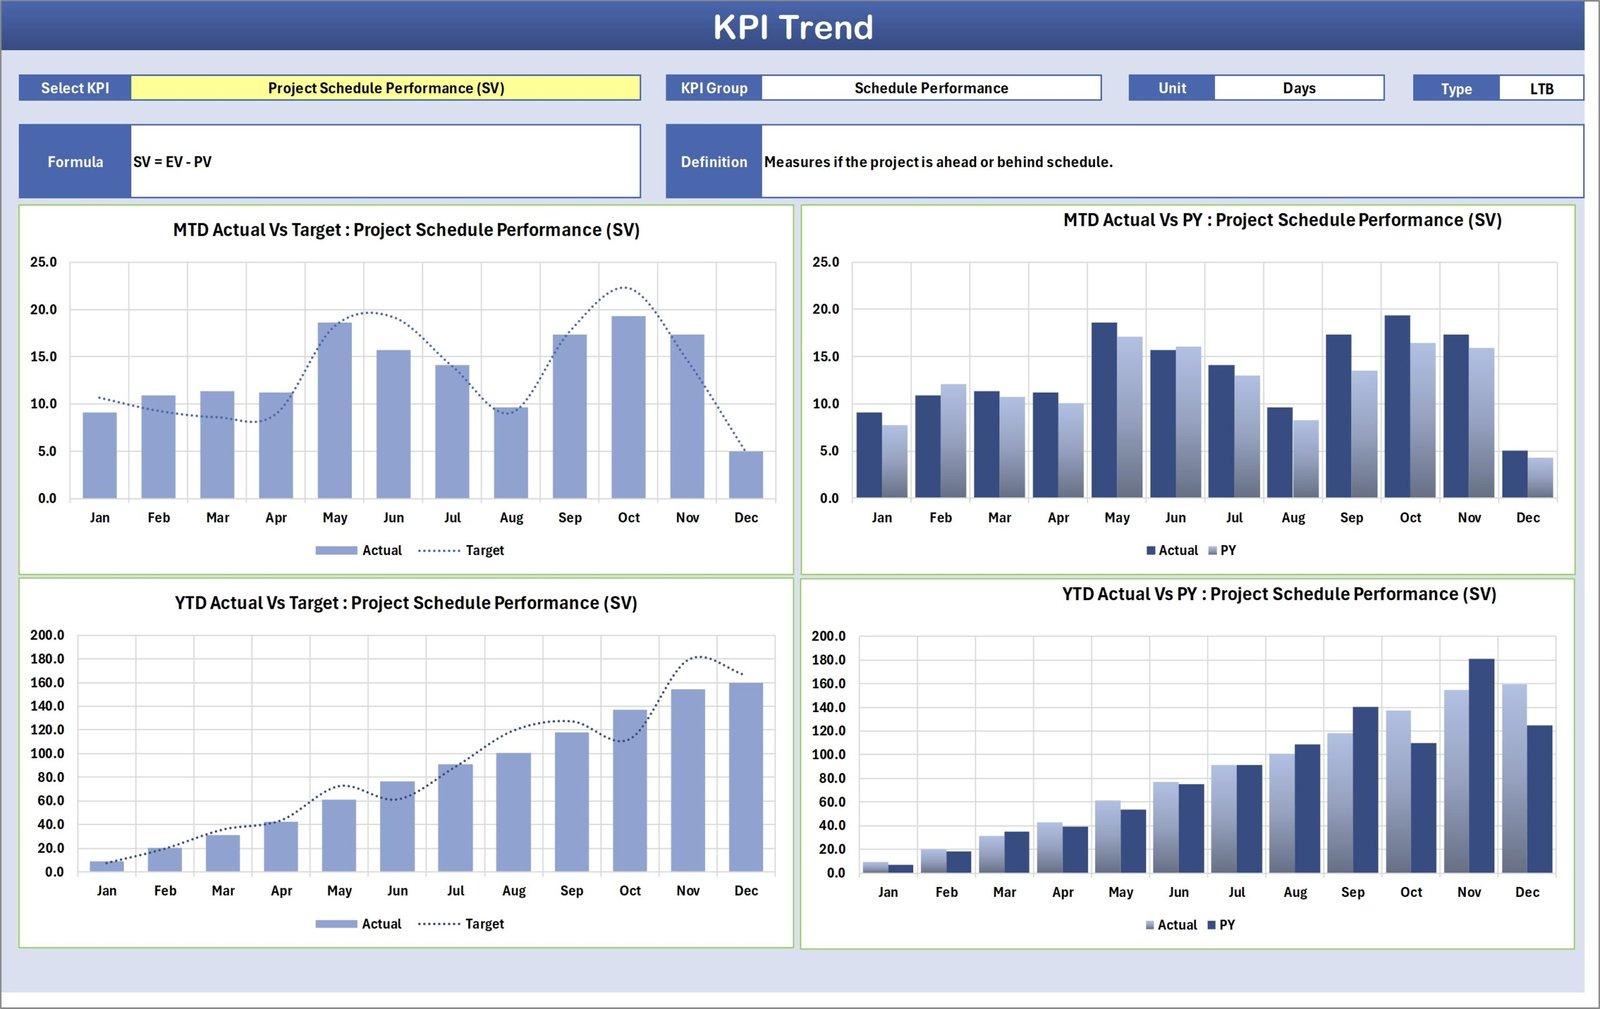
📈 Trend Sheet Tab
-
Select any KPI from the dropdown (Cell C3)
-
Displays KPI Group, Unit, and KPI Type (Lower-the-Better or Upper-the-Better)
-
Shows KPI formula and definition for accuracy
-
Analyze monthly trends to identify performance patterns
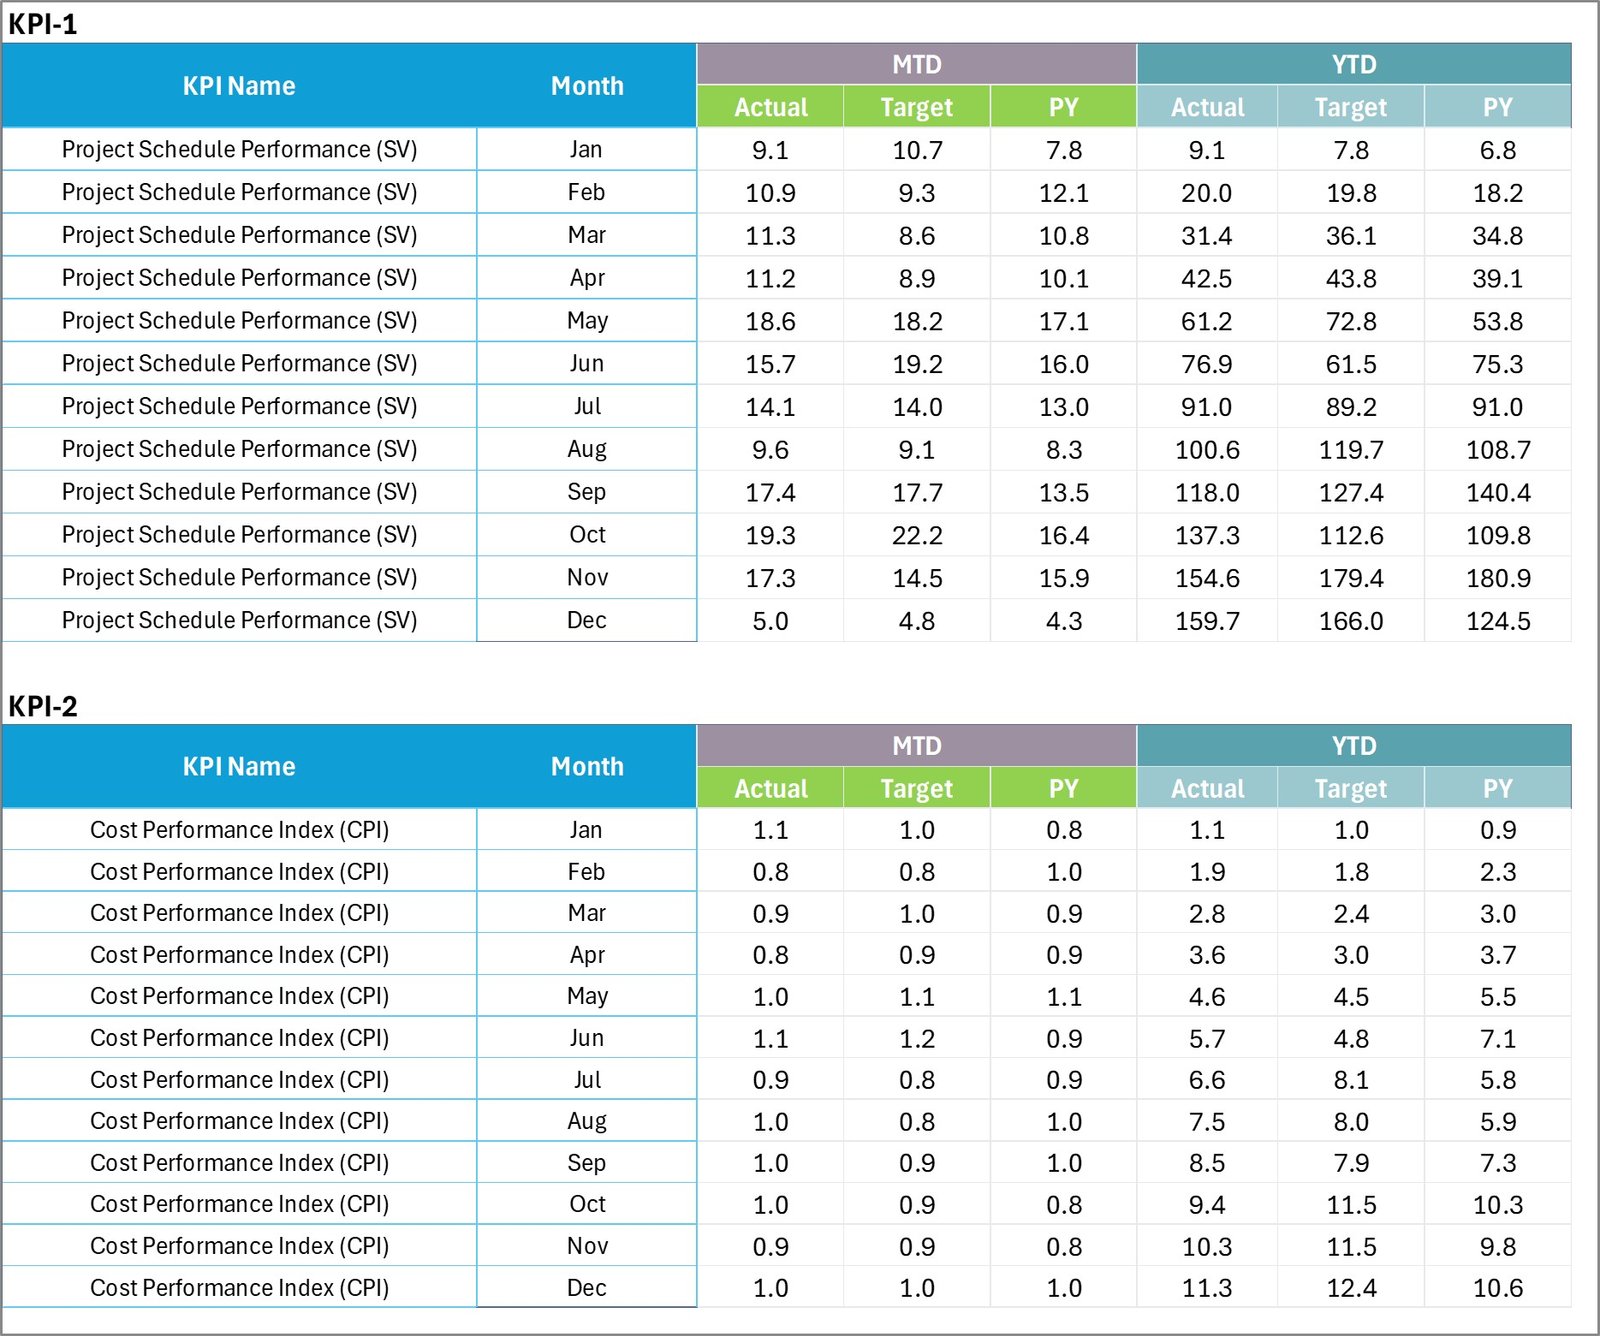
📑 Input Data Sheet
-
Record actuals, targets, and metrics for each KPI
-
Automatic linking across Scorecard & Trend sheets
-
Ensures accuracy and saves time with formula-driven updates
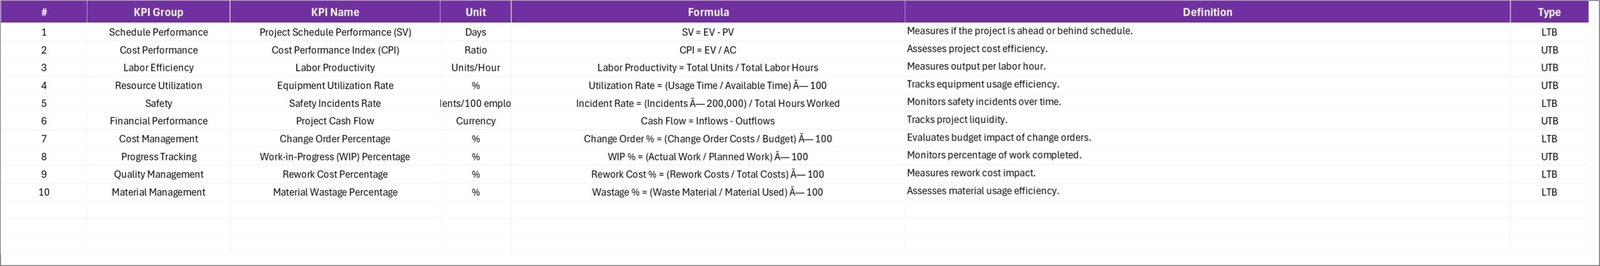
📖 KPI Definition Sheet
-
Complete reference guide for all KPIs
-
Includes KPI name, group, unit, formula, type (UTB or LTB), and definition
-
Maintains clarity and consistency across teams
📦 What’s Inside the Construction KPI Scorecard?
✅ Scorecard Sheet – KPI dashboard with MTD/YTD views and visual indicators
✅ Trend Sheet Tab – Drill-down analysis of selected KPIs
✅ Input Data Sheet – Structured data entry with automation
✅ KPI Definition Sheet – Comprehensive KPI reference library
✅ Pre-Configured Formulas – Ready-to-use with minimal setup
✅ Customizable Template – Add/remove KPIs as per project needs
This Excel-based scorecard is plug-and-play, designed to provide insights instantly without requiring advanced technical skills.
🧑💼 Who Can Benefit from This Scorecard?
🏗️ Construction Project Managers – Track project performance and control costs
👷 Site Engineers – Monitor safety, productivity, and equipment usage
📊 Executives – Gain high-level insights for strategic decisions
📑 Quality & Safety Teams – Ensure compliance with standards
💰 Finance Teams – Monitor cost variance and budget adherence
It’s a versatile tool suitable for small, medium, and large-scale construction projects.
📊 Examples of KPIs You Can Track
-
Project Completion % (UTB)
-
Safety Incidents (LTB)
-
Cost Variance % (LTB)
-
Equipment Utilization (UTB)
-
Labor Productivity (UTB)
-
Material Usage Variance (LTB)
-
Schedule Adherence % (UTB)
-
Quality Compliance % (UTB)
-
Customer Satisfaction Score (UTB)
-
Change Orders Count (LTB)
🌟 Advantages of Using the Construction KPI Scorecard
-
📌 Centralized KPI Tracking – Consolidates all metrics in one file
-
📊 Visual Insights – Traffic lights & arrows highlight KPI performance
-
📈 Trend Monitoring – Identify patterns across months and years
-
⚡ Time-Saving – Automated calculations reduce manual effort
-
🔧 Customizable – Add/remove KPIs as per project requirements
-
✅ Decision Support – Compare Actual vs Target values for quick decisions
🧪 Best Practices for Using the Scorecard
-
Update the Input Data Sheet regularly to keep reports accurate
-
Focus on critical KPIs that directly affect project success
-
Use the Trend Sheet to identify recurring underperformance
-
Set realistic thresholds for traffic light indicators
-
Share the scorecard with stakeholders to improve transparency
🎯 How This Scorecard Helps Construction Teams
-
Monitor project progress against timelines
-
Improve safety & quality compliance
-
Optimize resource allocation
-
Control budget variance
-
Increase client satisfaction with timely reporting
🔗 Click here to read the Detailed blog post
Watch the step-by-step video Demo:


Reviews
There are no reviews yet.