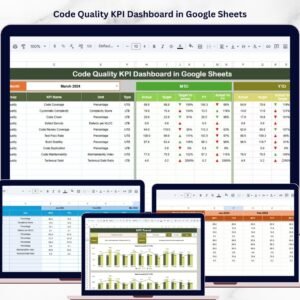

Take your software quality to the next level with the Code Quality KPI Dashboard in Google Sheets 🚀. In today’s fast-paced development environment, maintaining high code quality is critical. However, without proper tracking, bugs increase, delivery slows down, and performance suffers.
That’s where this powerful and ready-to-use dashboard becomes a game-changing solution.
It transforms complex development metrics into clear visuals, actionable insights, and structured KPI tracking—all in one place. As a result, your team can monitor performance, improve quality, and make faster, data-driven decisions.
🚀 Key Feature of Code Quality KPI Dashboard in Google Sheets
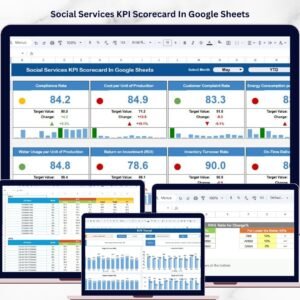
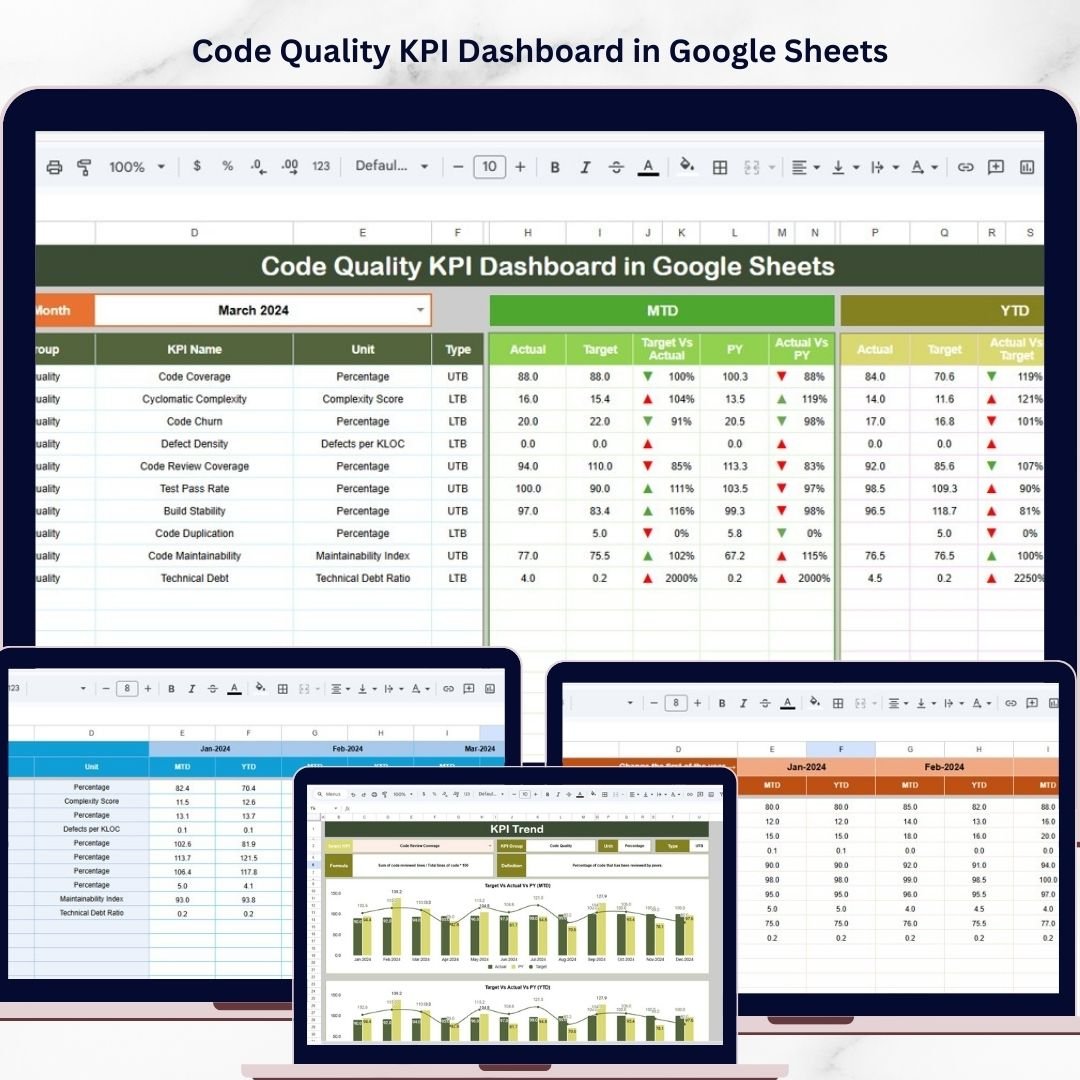
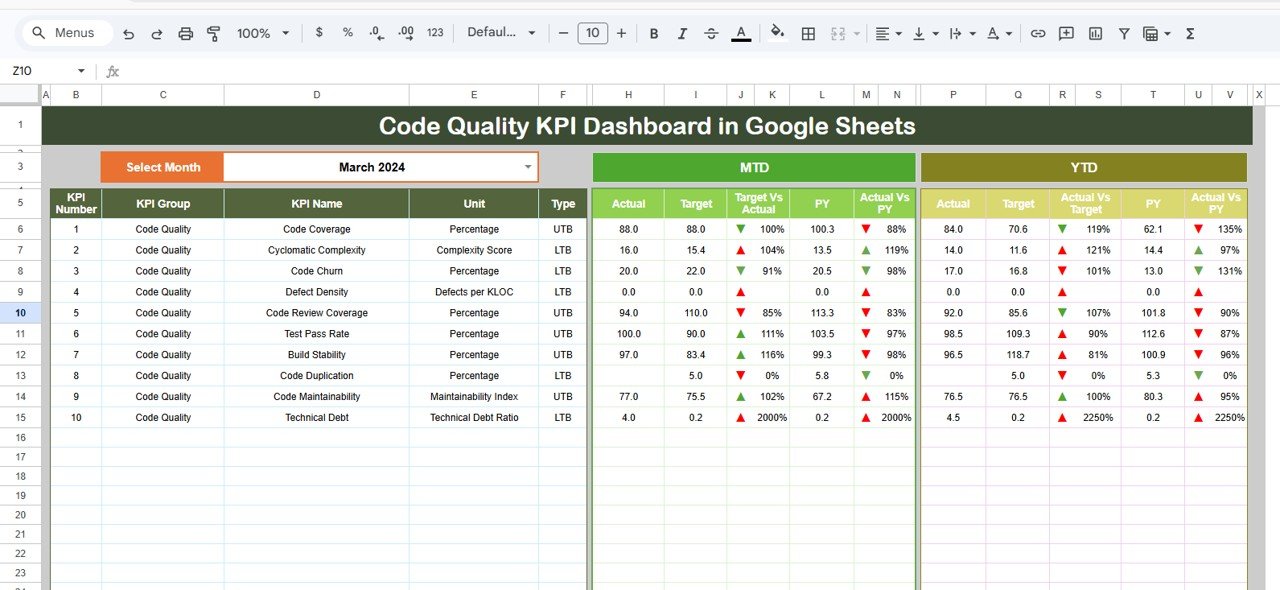
✅ 📊 Interactive Google Sheets Dashboard
Analyze code quality using dynamic metrics and visual indicators.
✅ 📈 MTD & YTD KPI Tracking
Monitor Month-to-Date and Year-to-Date performance easily.
✅ 🎯 Target vs Actual Comparison
Track performance against goals with clear insights.
✅ 📊 Previous Year Comparison
Analyze historical performance and improvement trends.
✅ 🔺 Conditional Formatting Indicators
Quickly identify trends with up/down arrows.
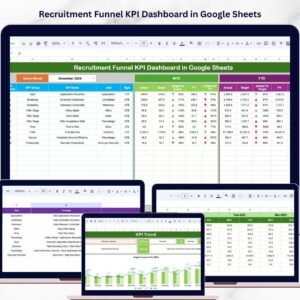
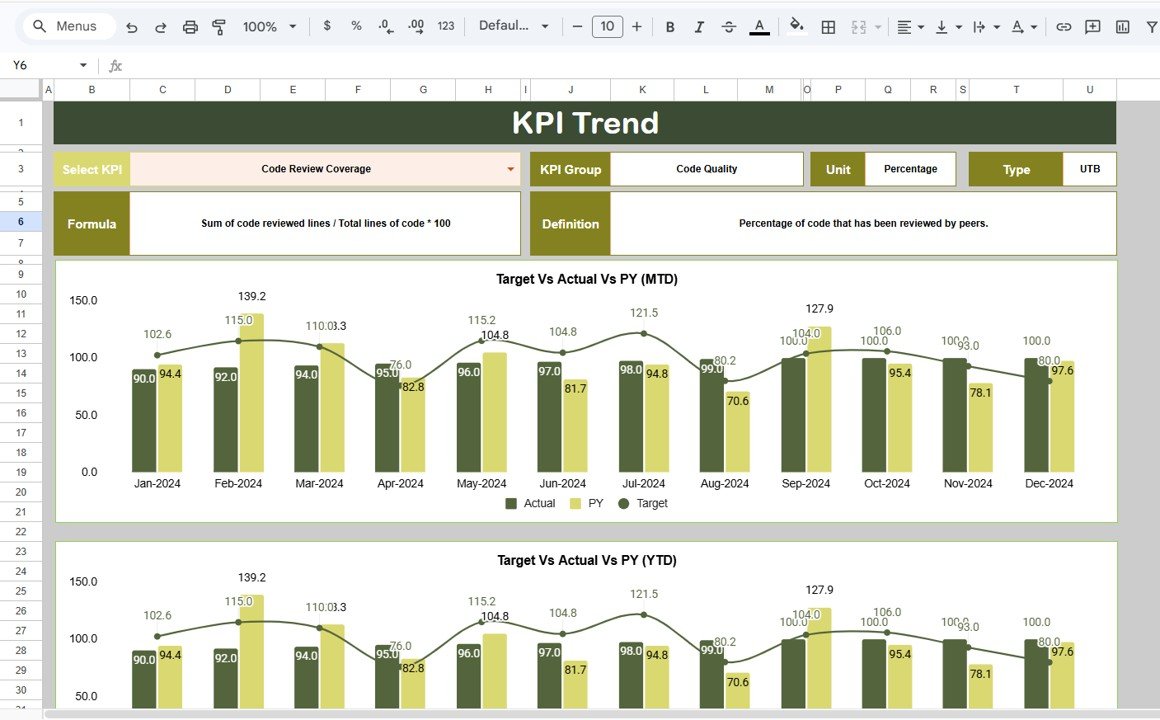
✅ 📉 KPI Trend Analysis Sheet
Deep dive into individual KPI performance.
✅ 📂 Structured Data Management
Separate sheets for Actual, Target, and Historical data.
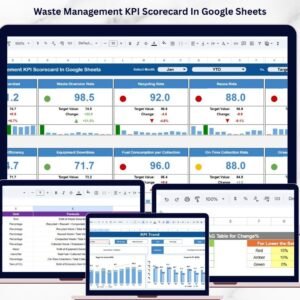
📦 What’s Inside the Code Quality KPI Dashboard in Google Sheets
This template includes 6 structured worksheets:
📊 Dashboard Sheet – Central view with KPI summaries and insights
📉 KPI Trend Sheet – Detailed analysis of selected KPIs
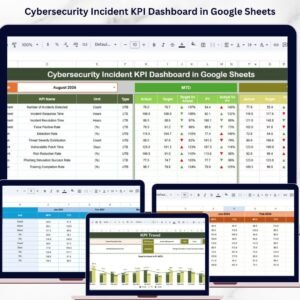
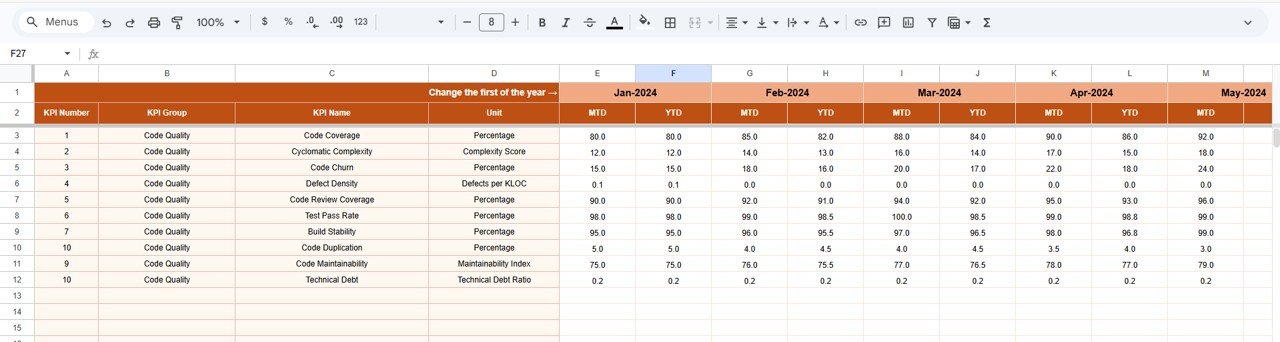
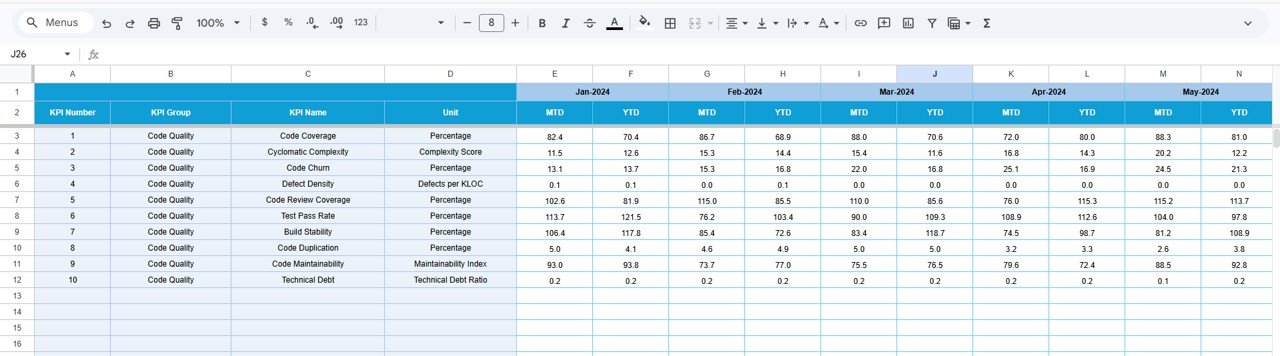
📥 Actual Numbers Sheet – Enter real performance data
🎯 Target Sheet – Define KPI goals and benchmarks
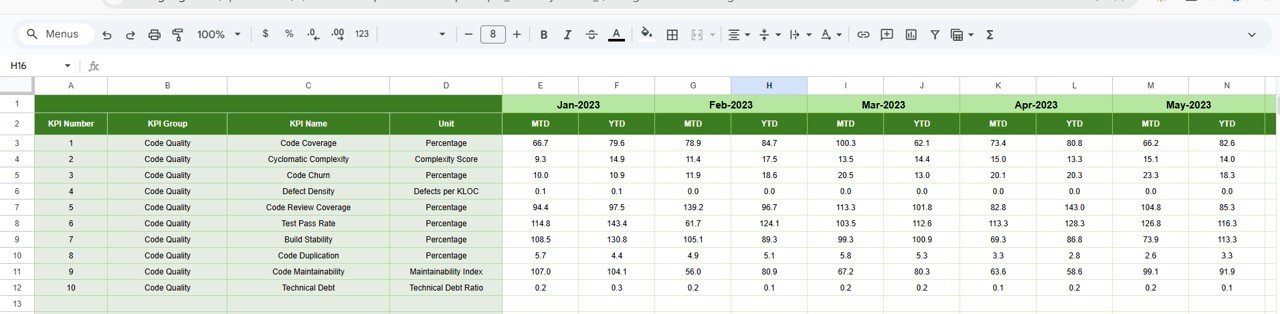
📅 Previous Year Sheet – Track historical performance
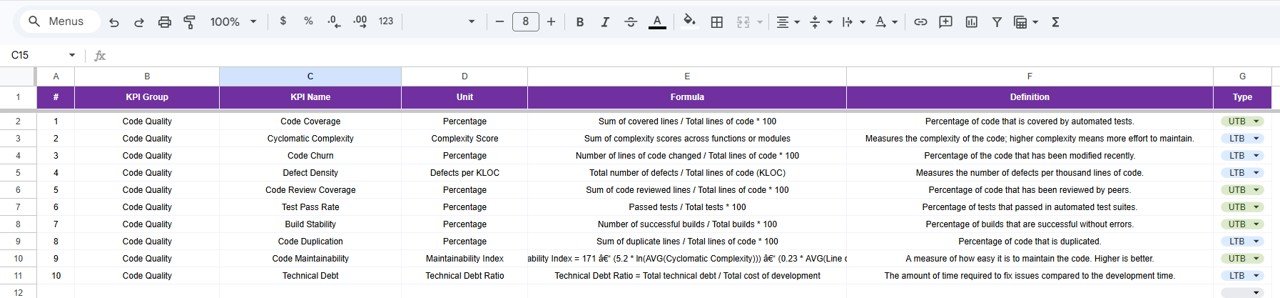
📘 KPI Definition Sheet – Store KPI formulas, units, and definitions
Everything is designed to provide a complete 360° view of code quality performance.
⚙️ How to Use the Code Quality KPI Dashboard in Google Sheets
Getting started is simple:
👉 Enter actual KPI data in the Actual Numbers Sheet
👉 Define targets in the Target Sheet
👉 Add historical data in the Previous Year Sheet
👉 Maintain KPI details in the KPI Definition Sheet
👉 Use the Dashboard Sheet (Cell D3) to select the month
👉 Analyze KPI trends and performance
Within minutes, you can convert raw development data into powerful insights 💡.
👨💻 Who Can Benefit from This Code Quality KPI Dashboard in Google Sheets
This dashboard is ideal for:
💻 Software Developers – Track code quality metrics
🧪 QA Engineers – Monitor defects and testing performance
📊 Project Managers – Analyze team productivity
⚙️ DevOps Teams – Improve deployment quality
👨💼 Tech Leads & CTOs – Make strategic decisions
Anyone involved in software development and quality assurance will benefit from this tool.
🔗 Click hare to read the Detailed blog post
Explore the full guide with features, benefits, and best practices.
👉 Visit our YouTube channel to learn step-by-step video tutorials:
https://youtube.com/@PKAnExcelExpert