Managing tenders in a Clinic Tender Dashboard environment is complex and highly sensitive. Clinics regularly handle tenders for medical equipment, pharmaceuticals, IT systems, facility management, diagnostics, and outsourced services. Each tender involves high values, strict timelines, compliance requirements, and multiple stakeholders. However, when tender data remains scattered across Excel files, emails, and manual reports, visibility drops, delays increase, and decision-making becomes reactive.
That is exactly why the Clinic Tender Dashboard in Power BI becomes a powerful and practical solution.
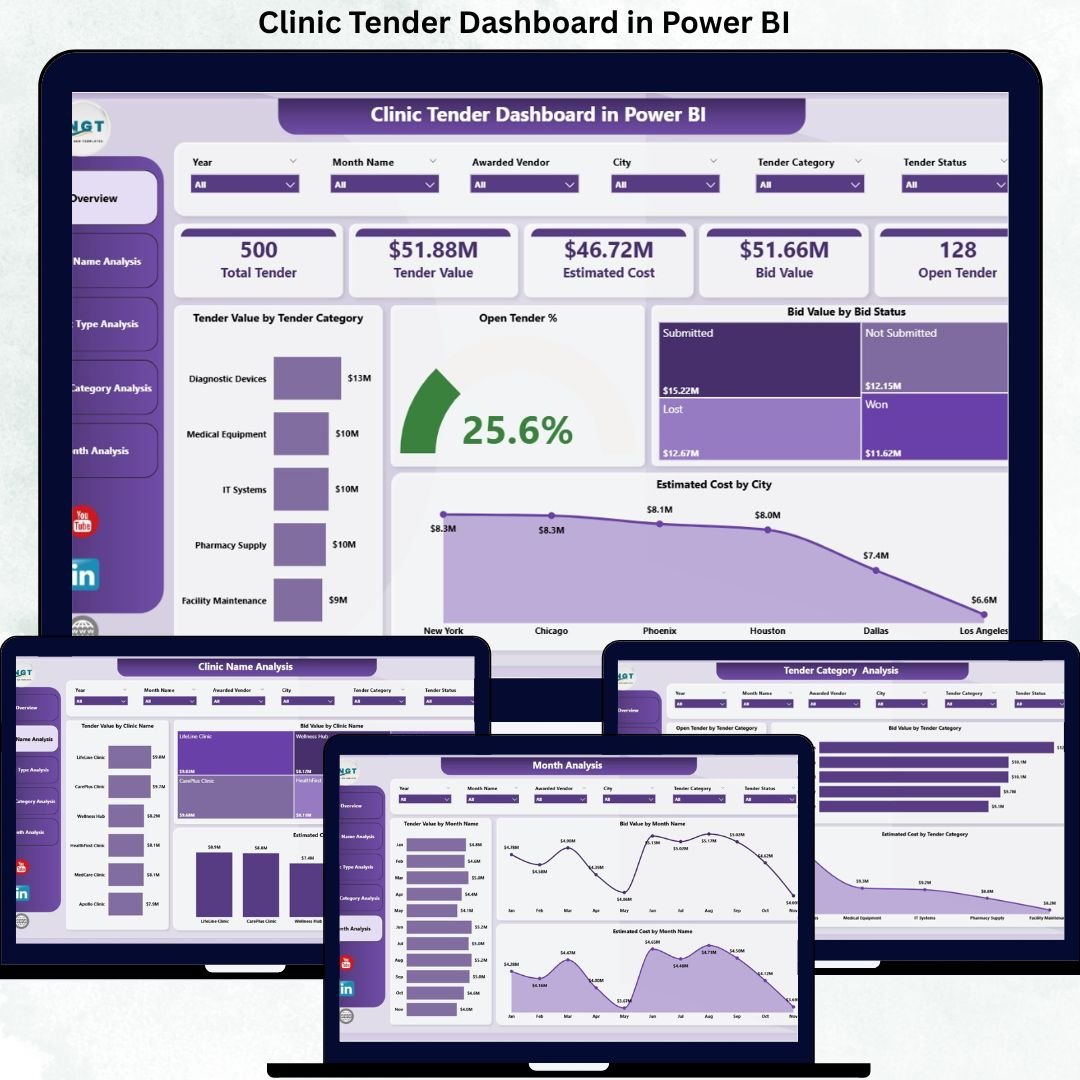
This ready-to-use Power BI dashboard transforms raw tender data into clear KPIs, interactive visuals, and structured analytical views. Instead of manually reviewing spreadsheets, clinic administrators and procurement teams gain instant visibility into tender values, bid status, estimated costs, open tenders, and monthly trends—all in one centralized dashboard.
Because this dashboard is built in Power BI, it offers real-time interactivity, dynamic filtering, and high-performance visuals. Users can analyze tender performance by clinic name, clinic type, tender category, city, bid status, and month without writing any formulas or technical queries. As a result, clinics save time, reduce errors, and improve compliance and financial control.
More importantly, this dashboard helps clinics answer critical questions instantly:
-
Which tender categories carry the highest value?
-
How many tenders are still open or pending?
-
Which clinics manage high-value tenders?
-
Where are estimated costs increasing?
-
How does tender activity change month by month?
With the Clinic Tender Dashboard in Power BI, tender management becomes structured, transparent, and decision-ready.
🔑 Key Features of Clinic Tender Dashboard in Power BI
📊 Centralized Tender Monitoring – All clinic tenders in one dashboard
📈 Interactive KPI Cards – Instant performance snapshot
🏥 Clinic-Wise & Clinic Type Analysis – Better visibility across locations
📂 Tender Category Insights – Control high-value procurement areas
📅 Monthly Trend Analysis – Forecast and plan proactively
🎛️ Dynamic Slicers & Filters – Drill down instantly
⚡ Real-Time Visuals – Faster and smarter decisions
🔒 Enterprise-Ready Power BI Design – Secure and scalable
📂 What’s Inside the Clinic Tender Dashboard in Power BI
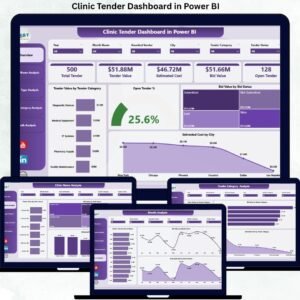
This professionally designed dashboard includes five structured analytical pages, each focused on a specific aspect of clinic tender management.
📊 Overview Page
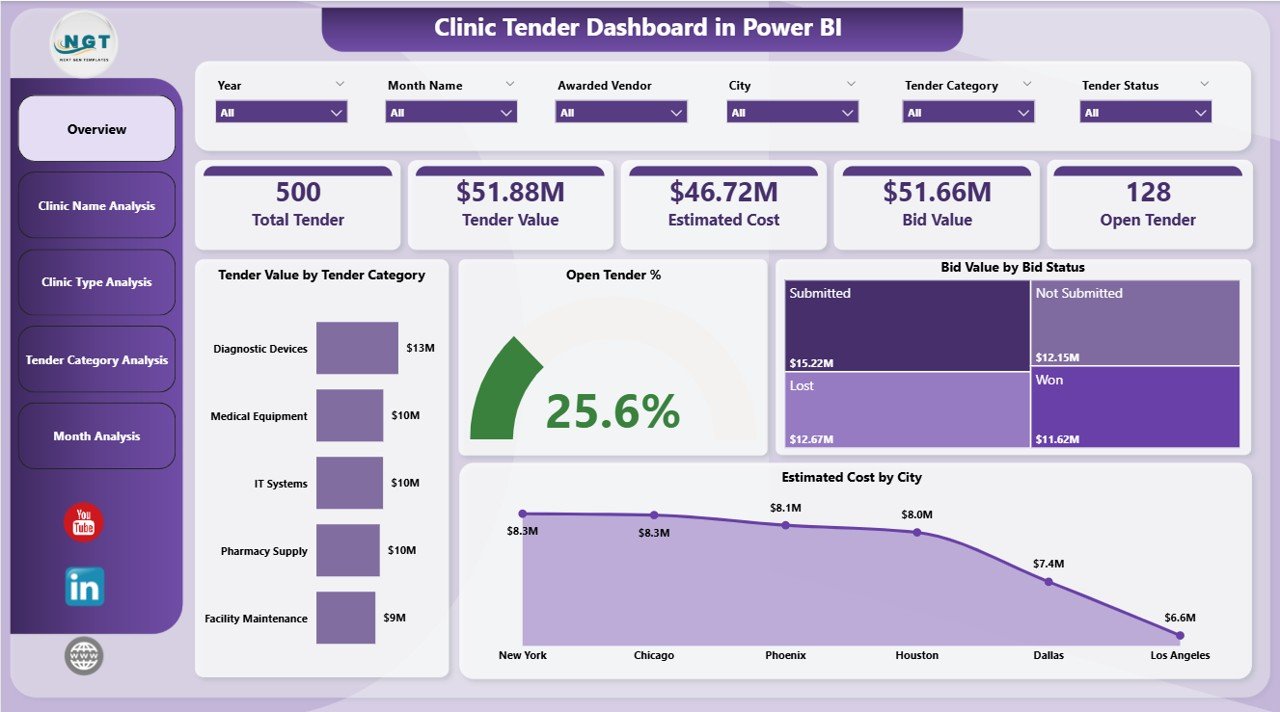
A high-level summary of tender performance:
-
Tender Value by Tender Category
-
Open Tender %
-
Bid Value by Bid Status
-
Estimated Cost by City
This page provides an instant snapshot for leadership.
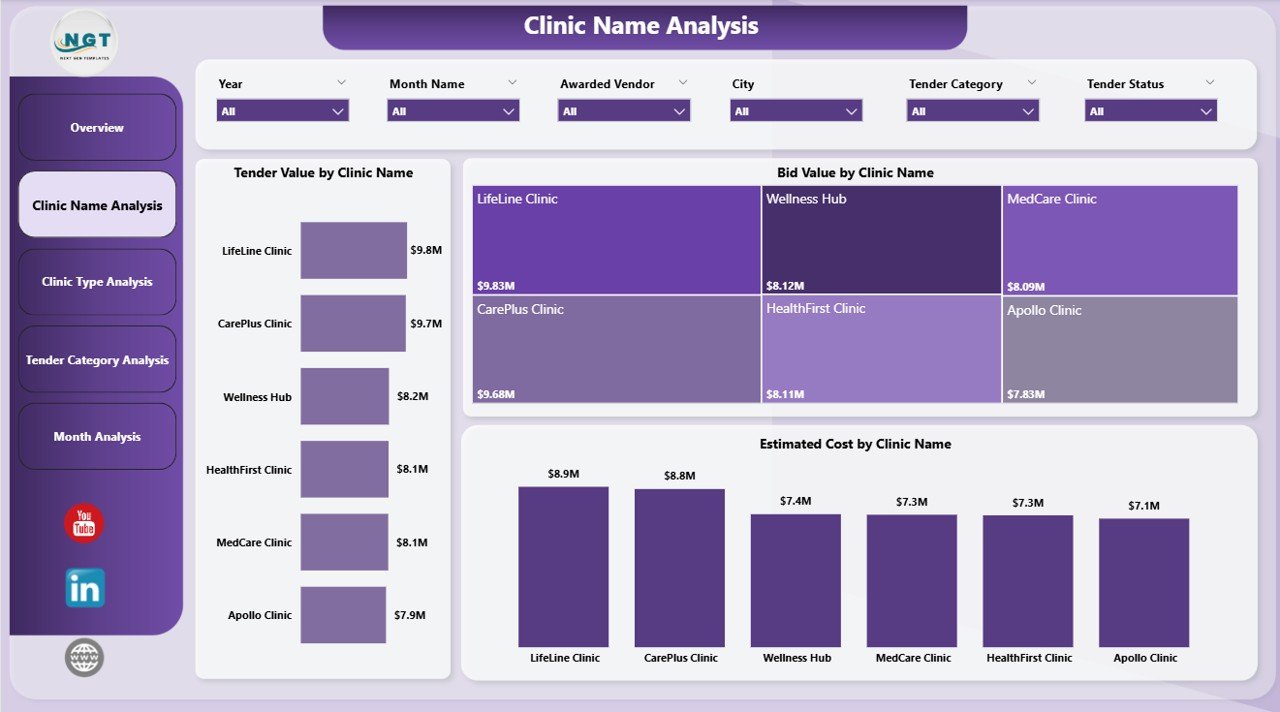
🏥 Clinic Name Analysis Page
Evaluate clinic-wise tender activity:
-
Tender Value by Clinic Name
-
Bid Value by Clinic Name
-
Estimated Cost by Clinic Name
Identify high-value clinics and cost-heavy locations quickly.
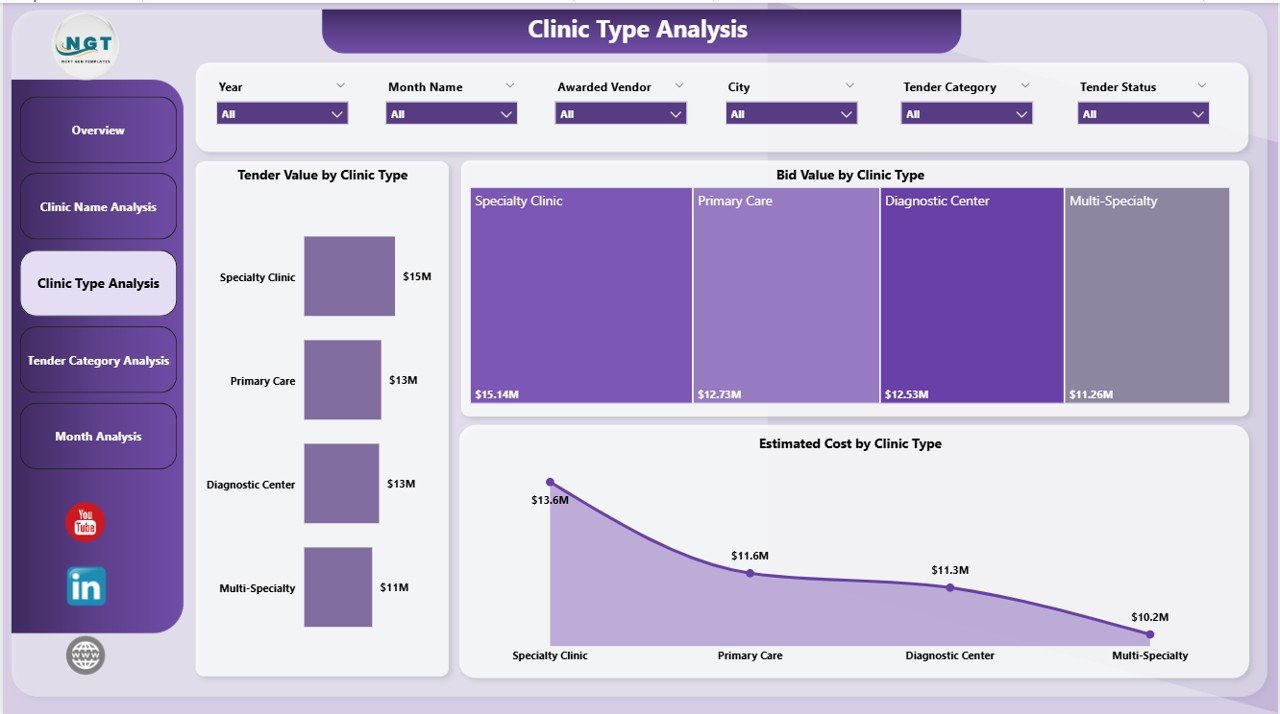
🏢 Clinic Type Analysis Page
Compare performance by clinic category:
-
Tender Value by Clinic Type
-
Bid Value by Clinic Type
-
Estimated Cost by Clinic Type
Align tender strategy with clinic business models.
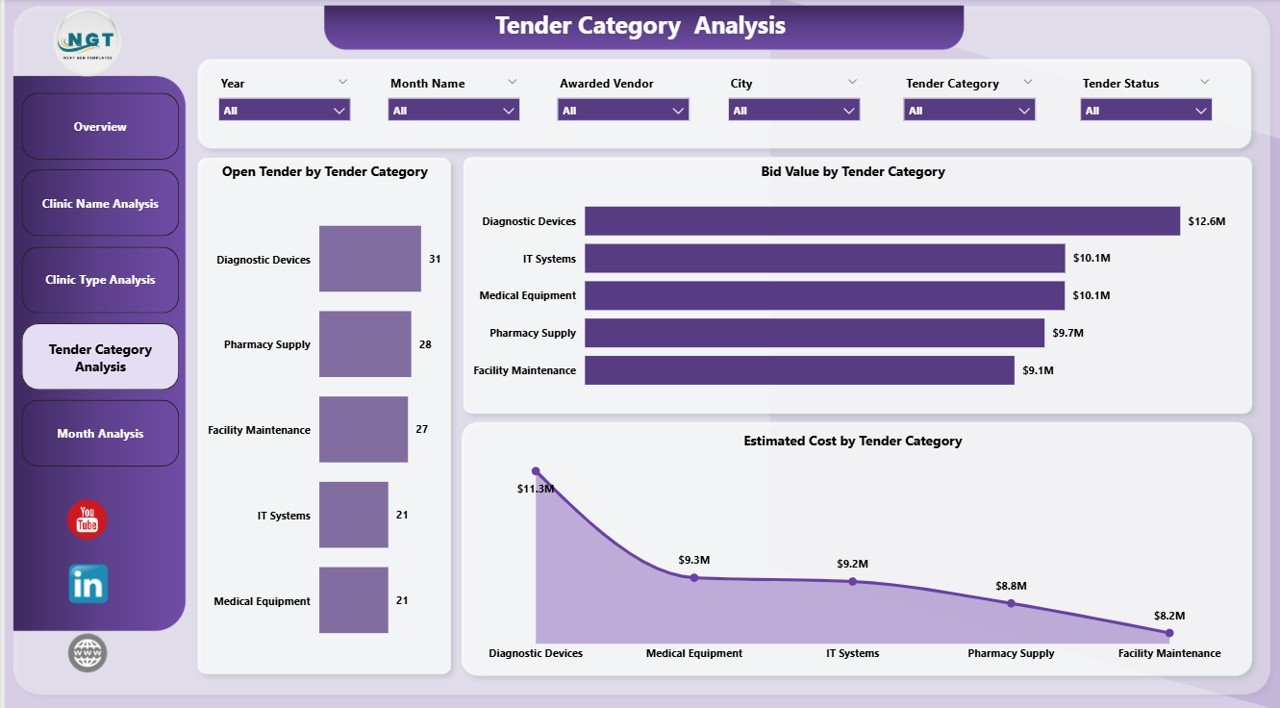
📂 Tender Category Analysis Page
Understand category-level exposure:
-
Open Tender by Tender Category
-
Bid Value by Tender Category
-
Estimated Tender Cost by Category
Optimize procurement and vendor strategies.
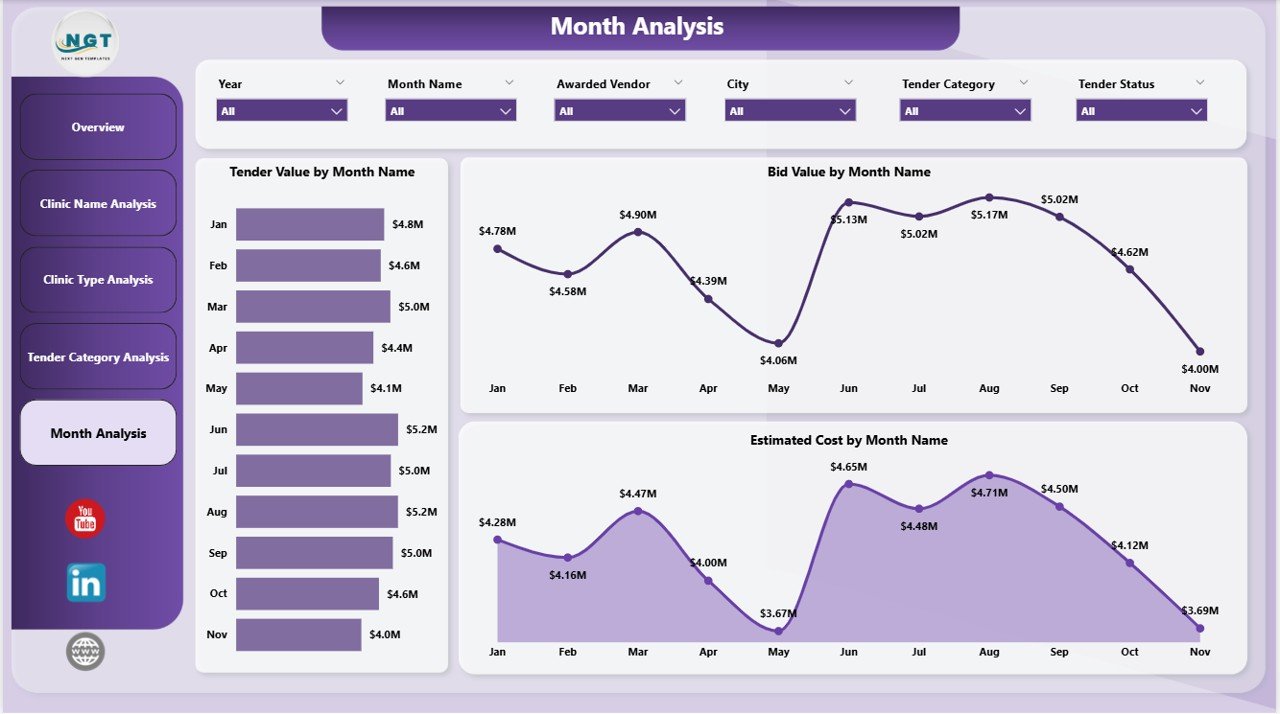
📅 Monthly Trends Analysis Page
Track time-based performance:
-
Tender Value by Month
-
Bid Value by Month
-
Estimated Cost by Month
Support budgeting, forecasting, and workload planning.
▶️ How to Use the Clinic Tender Dashboard in Power BI
1️⃣ Capture tender data in Excel or a database
2️⃣ Load or refresh data in Power BI
3️⃣ Use slicers to filter by clinic, category, or month
4️⃣ Review KPIs and charts for instant insights
5️⃣ Make faster, data-driven tender decisions
No advanced Power BI skills required.
👥 Who Can Benefit from This Dashboard
🏥 Clinic Administrators
📊 Procurement & Purchase Teams
💼 Finance & Budgeting Teams
🧾 Compliance & Audit Teams
👨⚕️ Senior Management
🏢 Healthcare Consultants
### 👉 Click here to read the Detailed Blog Post
Visit our YouTube channel to learn step-by-step video tutorials:
👉 https://www.youtube.com/@PKAnExcelExpert


Reviews
There are no reviews yet.