Managing client billing and invoices is one of the most critical functions in any organization — and accuracy is everything. The Client Billing & Invoice Management Dashboard in Google Sheets is a ready-to-use, cloud-based solution that simplifies the entire invoicing process. From tracking payments to monitoring overdue invoices, this dashboard offers real-time visibility into your financial operations. 💼📊
Designed for finance teams, account managers, freelancers, and small business owners, this dashboard ensures that every bill, payment, and client record is organized, visualized, and up-to-date — without requiring any accounting software.
🔑 Key Features of the Client Billing & Invoice Management Dashboard in Google Sheets
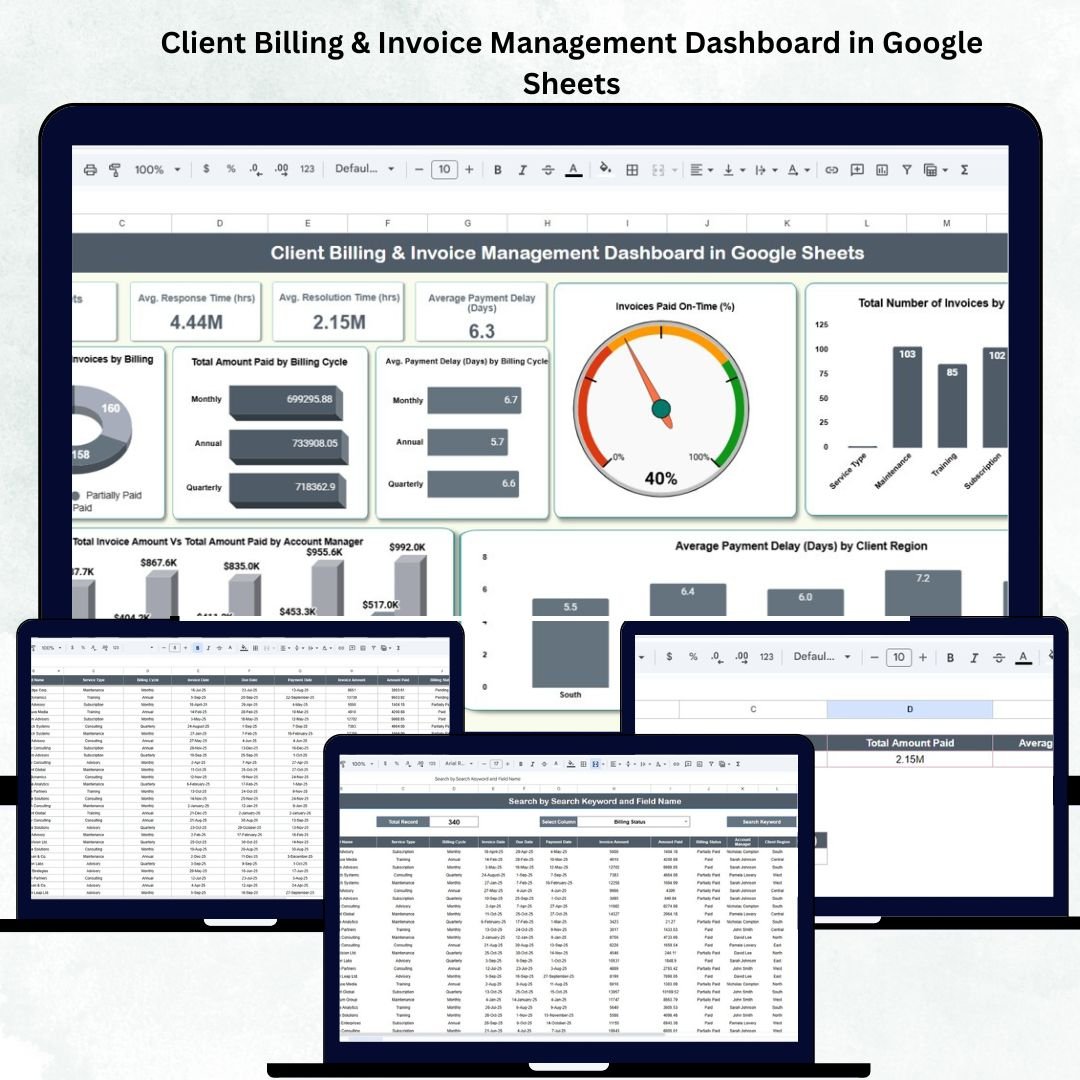
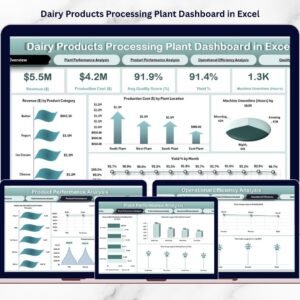
📊 Dashboard Sheet Tab (Main Overview)
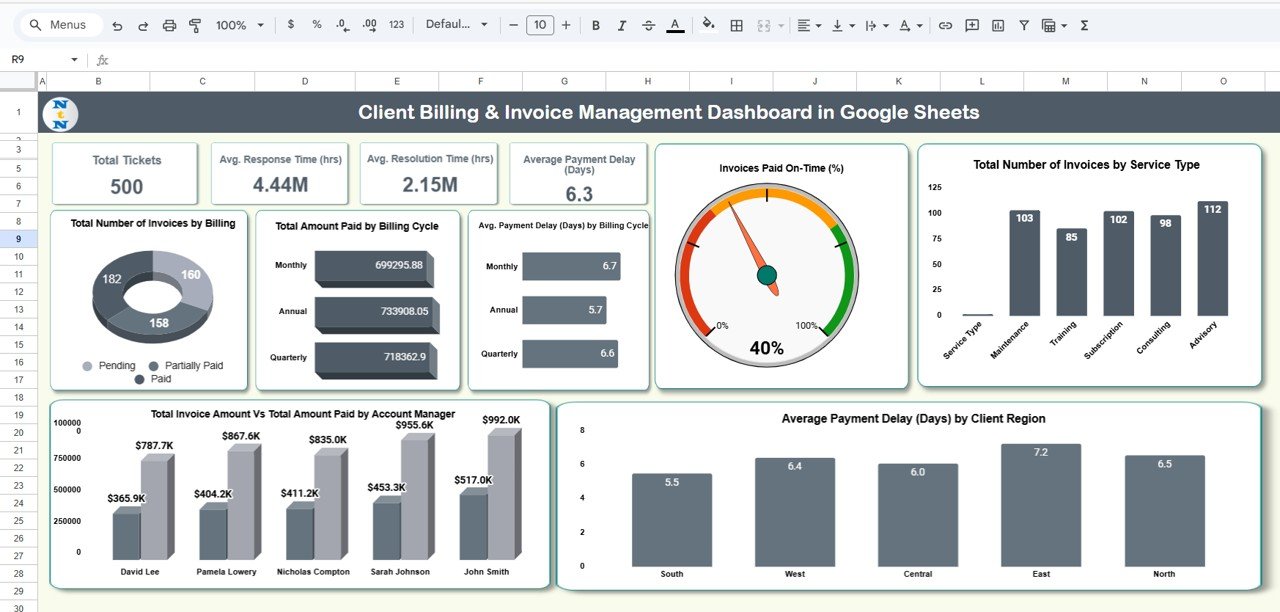
This is the heart of the dashboard — a visual summary of your entire billing ecosystem.
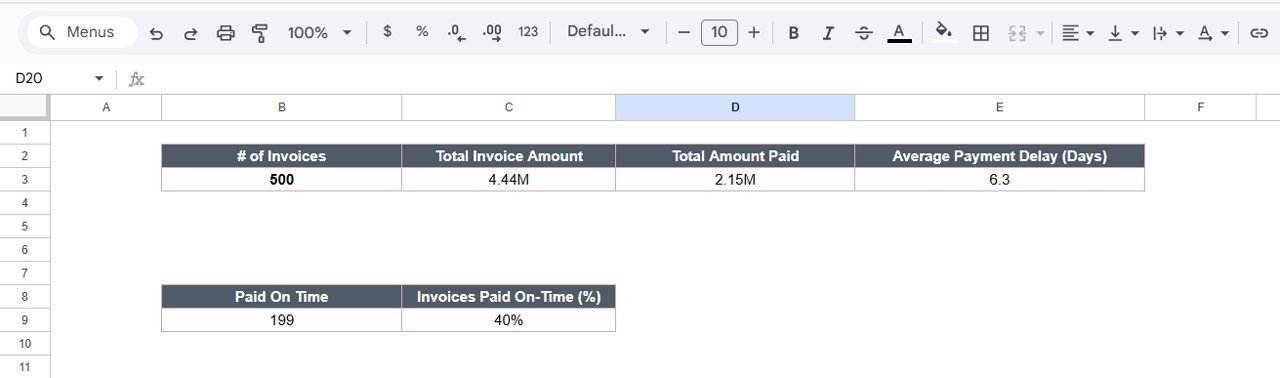
Cards Displayed:
-
# of Invoices: Total number of invoices generated in the selected period.
-
Total Invoice Amount: Combined total of all invoice values.
-
Total Amount Paid: Sum of all payments received.
-
Average Payment Delay (Days): Average delay between invoice due date and payment date.
Charts Included:
1️⃣ Total Number of Invoices by Billing Status – View invoices categorized as Paid, Pending, Partially Paid, or Overdue.
2️⃣ Total Amount Paid by Billing Cycle – Analyze revenue patterns across Monthly, Quarterly, or Annual cycles.
3️⃣ Average Payment Delay (Days) by Billing Cycle – Identify which billing cycles tend to have delayed payments.
4️⃣ Invoices Paid On-Time (%) – Track client reliability in settling invoices on time.
5️⃣ Total Invoices by Service Type – Grouped by services such as Consulting, Subscription, or Maintenance.
6️⃣ Average Payment Delay (Days) by Client Region – Detect geographical patterns in payment behavior.
7️⃣ Total Invoice Amount vs Total Amount Paid by Account Manager – Compare performance across account managers.
All charts update automatically when new data is entered in the Data Sheet Tab, ensuring real-time financial monitoring.
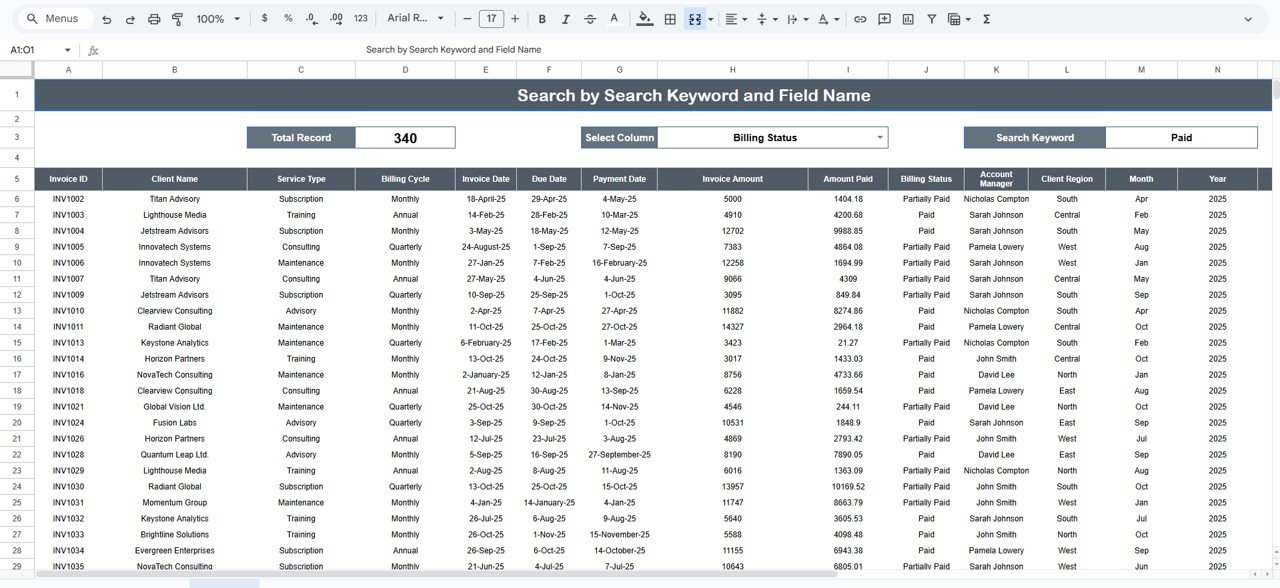
🔍 Search Sheet Tab
Quickly locate client or invoice records using the search functionality.
Search by:
-
Invoice ID
-
Client Name
-
Account Manager
-
Billing Status
-
Service Type
-
Client Region
💡 Example: Search “Pending” to instantly view all pending invoices for immediate follow-up.
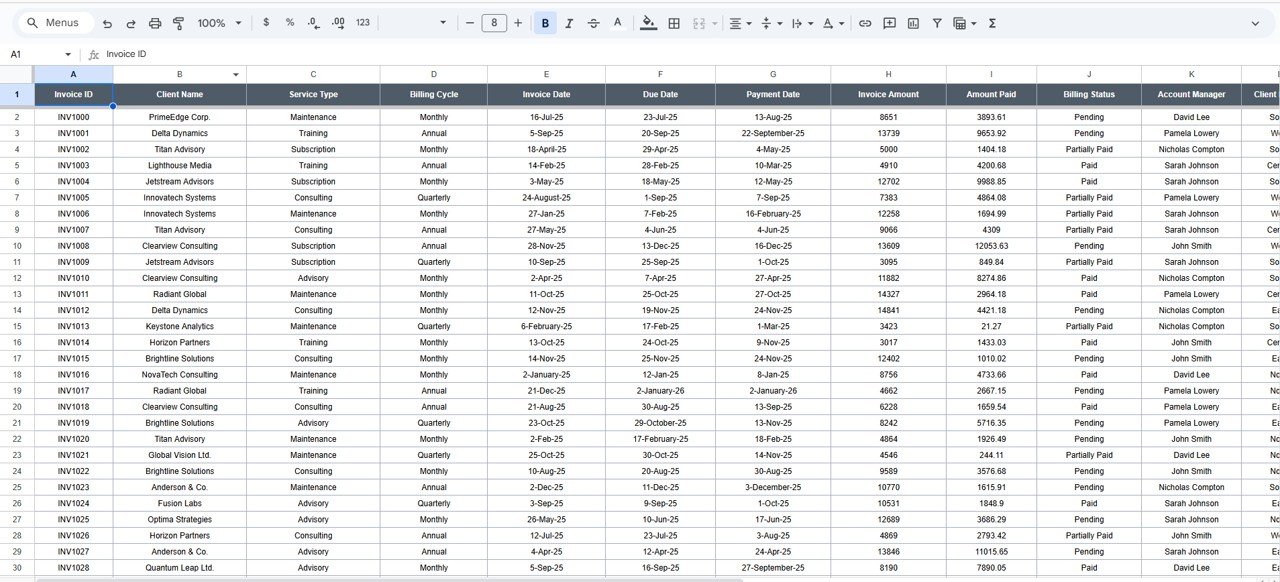
🧾 Data Sheet Tab
The foundation of the dashboard — this tab contains all invoice records.
Columns include:
Invoice ID | Client Name | Service Type | Billing Cycle | Invoice Date | Due Date | Payment Date | Invoice Amount | Amount Paid | Billing Status | Account Manager | Client Region | Month | Year | Payment Delay (Days) | Paid On-Time (Yes/No)
This dataset drives all dashboard calculations and visualizations.
⚙️ Support Sheet Tab
Contains dropdown sources for standardized data entry — such as Service Types, Billing Cycles, Account Managers, and Regions. This ensures consistency and accuracy across all sheets.
📦 What’s Inside the Dashboard
✅ Automated KPIs – Instantly view total invoices, payments, and delays.
✅ Interactive Charts – Visualize performance by service, client, and region.
✅ Smart Search Tab – Locate invoices instantly.
✅ Dynamic Filtering – Focus on specific cycles or statuses.
✅ Collaborative Access – Multiple team members can update data live.
✅ Real-Time Refresh – Dashboards update automatically as data changes.
✅ No Software Needed – 100% built in Google Sheets.
💰 Key Performance Indicators (KPIs)
| KPI Name | Unit | Formula | Definition | Type |
|---|---|---|---|---|
| # of Invoices | Count | COUNT(Invoices) | Total number of invoices created | UTB |
| Total Invoice Amount | USD | SUM(Invoice Amount) | Total billed value | UTB |
| Total Amount Paid | USD | SUM(Amount Paid) | Total payments received | UTB |
| Average Payment Delay | Days | AVERAGE(Payment Delay) | Average days delayed beyond due date | LTB |
| Overdue Invoices | Count | COUNTIF(Status=”Overdue”) | Number of invoices past due | LTB |
| Partially Paid Invoices | Count | COUNTIF(Status=”Partially Paid”) | Invoices paid partially | LTB |
| On-Time Payment % | % | (On-Time Paid / Total Paid) * 100 | Percentage of invoices paid within due date | UTB |
| Collection Efficiency % | % | (Total Paid / Total Invoiced) * 100 | Measures overall collection rate | UTB |
| Pending Amount | USD | SUM(Invoice Amount – Amount Paid) | Outstanding payment value | LTB |
| Payment Delay Trend | Days | Current Delay – Previous Delay | Change in delay over time | LTB |
🧩 Advantages of the Dashboard
💼 Centralized View: Track all invoices and payments in one platform.
📈 Data-Driven Decisions: Identify clients with consistent delays.
💡 Automated Analytics: Real-time visual insights for billing efficiency.
🌍 Cloud Collaboration: Access and edit data from anywhere.
🔒 Accuracy & Transparency: Reliable KPIs ensure audit-ready records.
🚀 Opportunities for Improvement
-
Google Apps Script Automation: Auto-send payment reminders to clients.
-
Google Form Integration: Collect invoice data from sales or project teams.
-
Email Triggers: Notify account managers when invoices go overdue.
-
Multi-Currency Support: Add exchange rate automation for global billing.
-
Monthly Reports: Automate summary exports as PDFs.
Best Practices
✔ Update invoice data regularly for accurate insights.
✔ Reconcile payments at the end of each billing cycle.
✔ Use consistent billing codes and naming conventions.
✔ Protect sensitive data with restricted access rights.
✔ Review overdue invoices weekly to avoid collection delays.
Conclusion
The Client Billing & Invoice Management Dashboard in Google Sheets is a complete financial control system designed for efficiency and clarity.
It provides instant visibility into your billing performance, identifies late-paying clients, and helps ensure smoother cash flow management — all in a simple, visual format.
Whether you’re managing a small business or a large client portfolio, this dashboard is your go-to solution for automated, transparent, and collaborative billing management.
Click here to Read detailed blog post
Watch the step-by-step video Demo:


Reviews
There are no reviews yet.