The chemical industry operates in one of the most demanding and performance-critical environments. Organizations must continuously monitor production efficiency, safety compliance, quality standards, operational costs, and environmental performance. However, many chemical companies still depend on manual spreadsheets and disconnected reporting systems, making performance evaluation slow and complicated.
When data is scattered, managers struggle to identify risks, measure improvements, and make timely decisions. As a result, operational inefficiencies increase and performance visibility decreases.
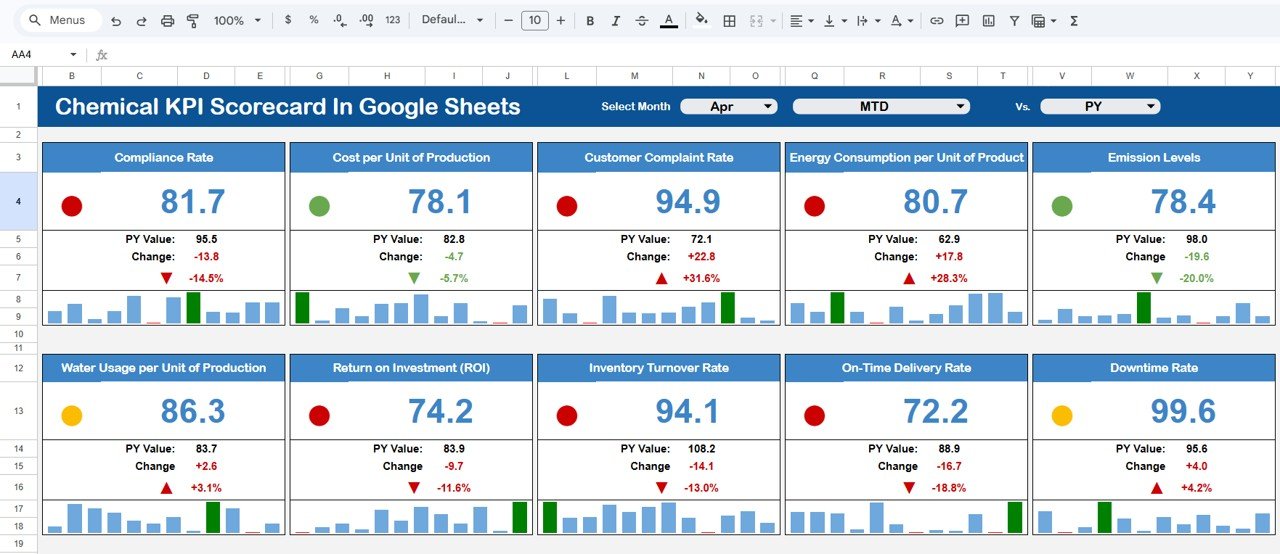
The Chemical KPI Scorecard in Google Sheets provides a simple yet powerful solution to this challenge.
This ready-to-use scorecard transforms complex operational data into a clear and structured performance monitoring system. Instead of analyzing multiple reports, users can track all KPIs inside a single dynamic dashboard designed specifically for chemical industry operations.
Built entirely in Google Sheets, the scorecard enables real-time collaboration, centralized reporting, and automated calculations — allowing teams to focus on performance improvement rather than manual reporting tasks.
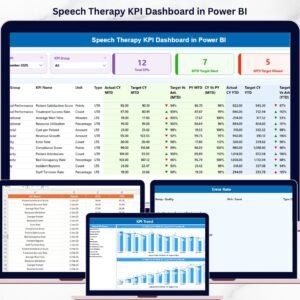
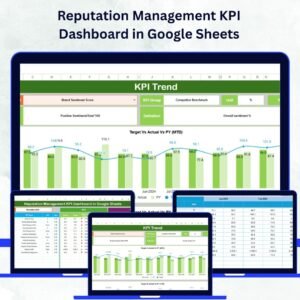
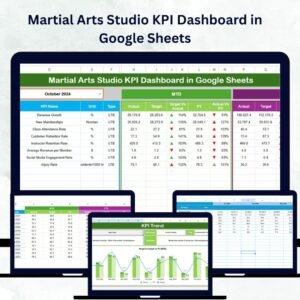
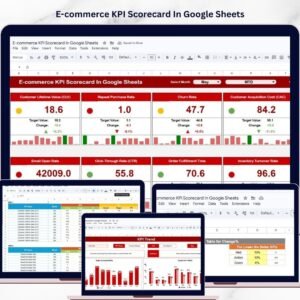
The template tracks 10 essential KPIs, helping organizations evaluate operational performance quickly using visual indicators, automated comparisons, and trend analysis. Whether you manage production, quality assurance, safety compliance, or plant operations, this scorecard provides instant insights for smarter decision-making.
🚀 Key Features of Chemical KPI Scorecard in Google Sheets
✅ Tracks 10 critical KPIs in one centralized dashboard
✅ Dynamic month dropdown selection with automatic updates
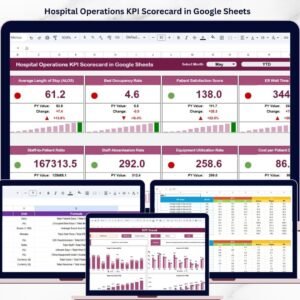
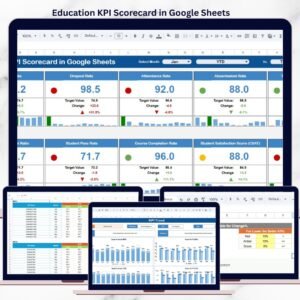
✅ Traffic light indicators for instant performance evaluation
✅ Up and down arrows showing KPI performance changes
✅ MTD and YTD performance monitoring options
✅ Automated calculations to reduce manual effort
✅ KPI definitions and formulas included
✅ Custom color settings for branding and visualization
These features make performance tracking simple, visual, and highly actionable.
📦 What’s Inside the Chemical KPI Scorecard in Google Sheets
The product includes a fully structured KPI monitoring system with dedicated worksheets:
-
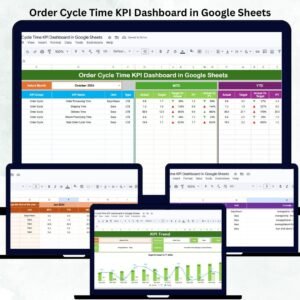
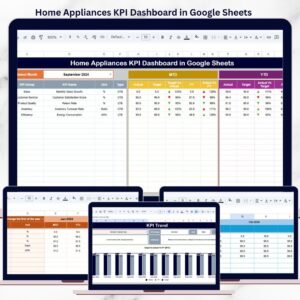
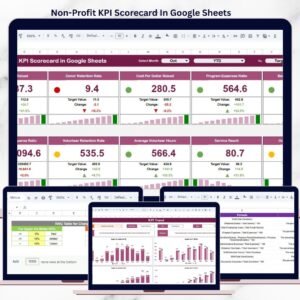
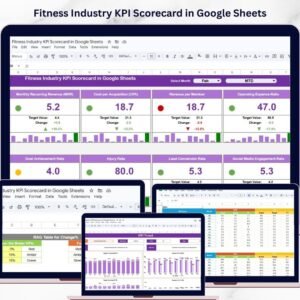
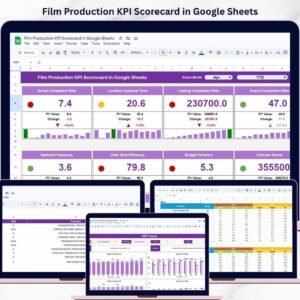
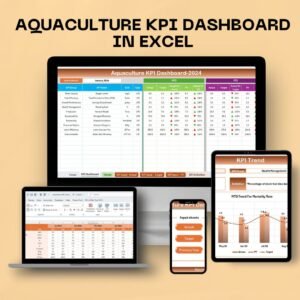
Dashboard Scorecard Sheet – Monthly KPI performance overview
-
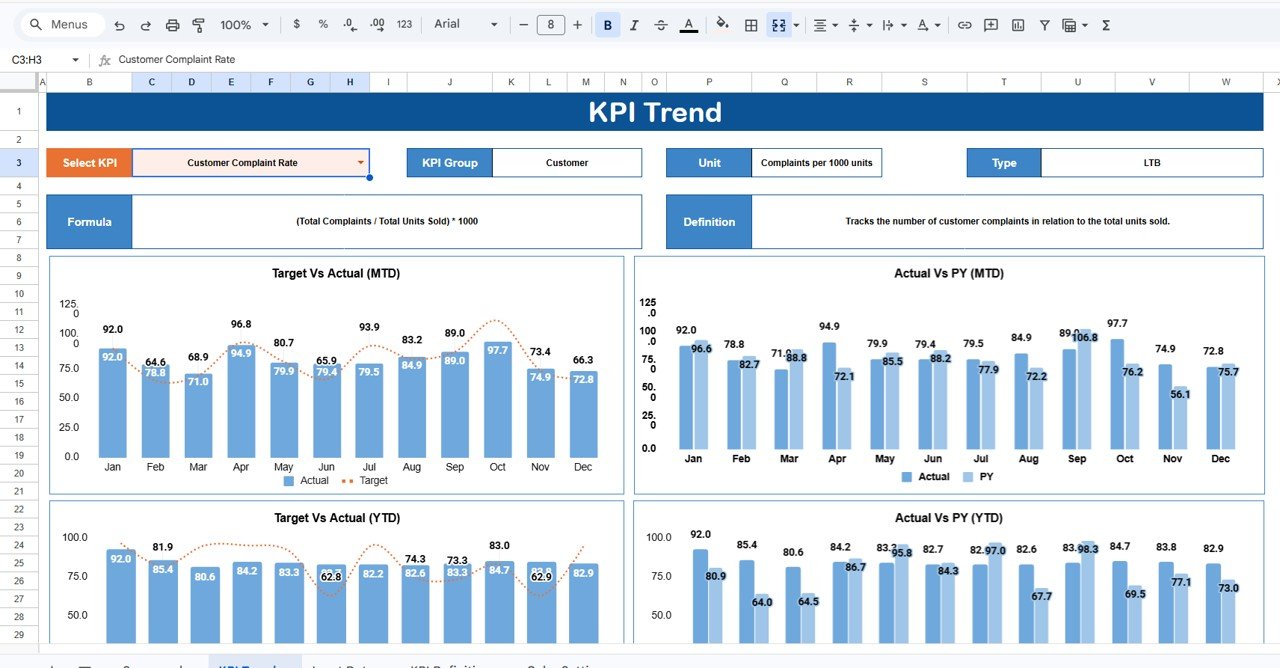
KPI Trend Sheet – Individual KPI trend and comparison analysis
-
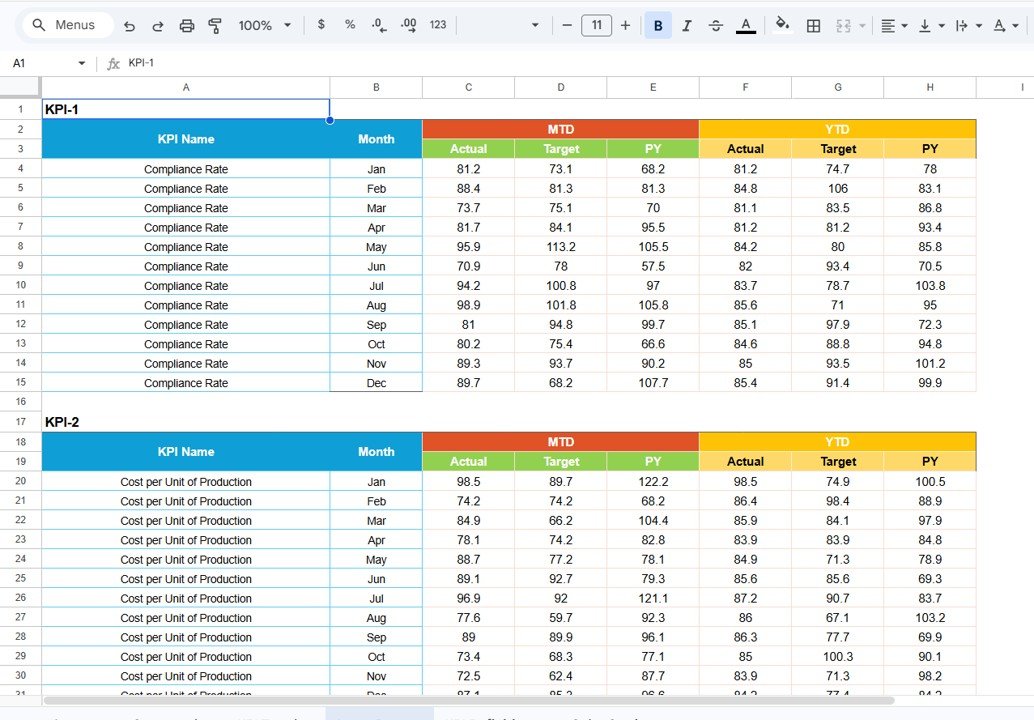
Data Input Sheet – Organized area for entering performance data
-
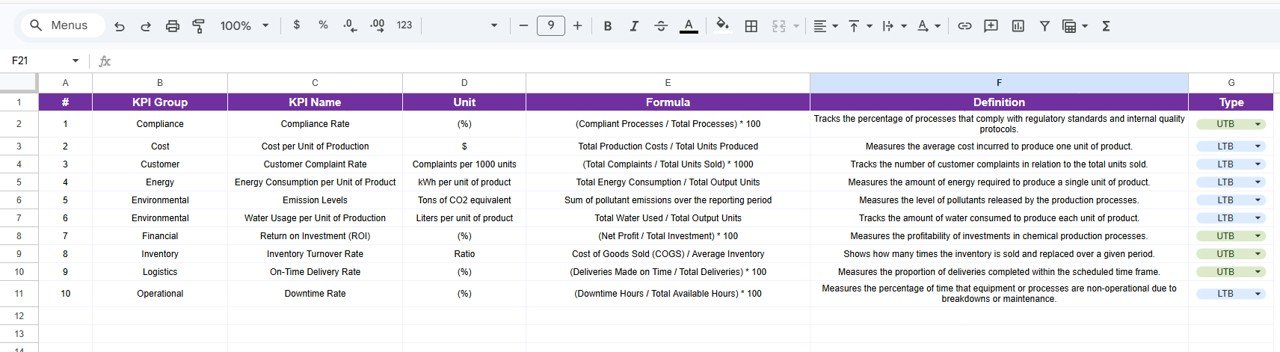
KPI Definition Sheet – Centralized KPI documentation and formulas
-
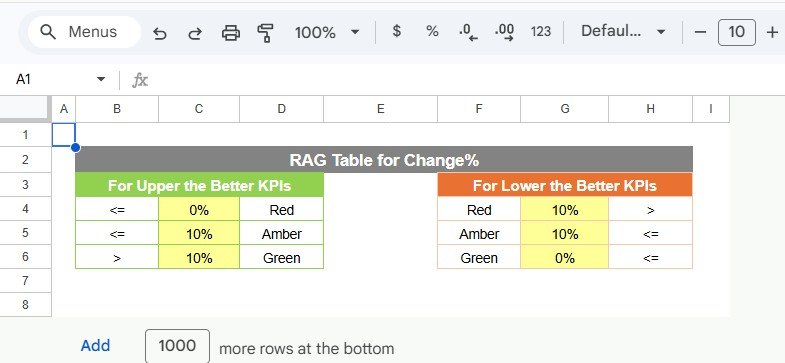
Colour Settings Section – Customize dashboard colors and thresholds
Each sheet works together to create a complete performance management framework for chemical operations.
⚙️ How to Use the Chemical KPI Scorecard in Google Sheets
The scorecard is designed to be easy for both beginners and professionals:
1️⃣ Enter KPI definitions and details in the KPI Definition sheet
2️⃣ Input monthly performance values in the Data Input sheet
3️⃣ Select the reporting month using the dropdown menu
4️⃣ Switch between MTD and YTD performance views
5️⃣ Review traffic lights and performance arrows instantly
All calculations update automatically, eliminating manual reporting work.
🏭 Who Can Benefit from This Chemical KPI Scorecard
This scorecard supports multiple roles across chemical organizations:
-
Plant Managers monitoring operational efficiency
-
Production Supervisors tracking plant performance
-
Quality Managers ensuring compliance standards
-
Safety Officers monitoring risk indicators
-
Operations Analysts analyzing trends
-
Business Executives reviewing performance summaries
Because the dashboard simplifies complex KPI analysis, it helps every department stay aligned with business goals.
The Chemical KPI Scorecard in Google Sheets converts raw operational numbers into meaningful insights that drive continuous improvement. Instead of spending time preparing reports, teams gain immediate visibility into performance trends and operational risks.
By combining automation, visualization, and cloud collaboration, this scorecard helps organizations improve efficiency, enhance safety monitoring, and maintain consistent performance tracking — all without expensive software investments.
If your organization wants a smarter, faster, and more structured way to monitor chemical operations, this scorecard delivers professional-level analytics in a simple Google Sheets environment.
### Click here to read the Detailed blog post
Watch the step-by-step video tutorial: