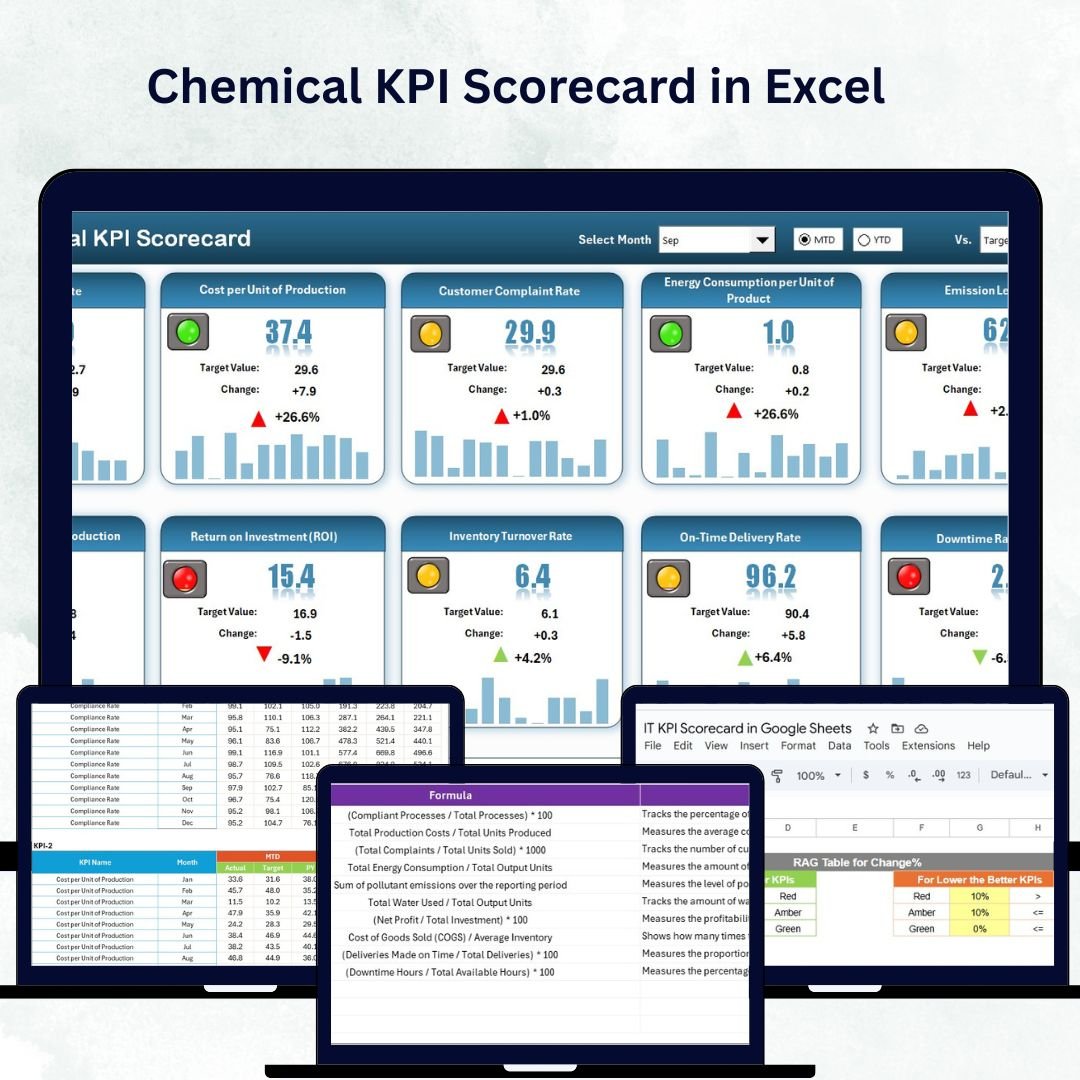
In the ever-evolving chemical industry, performance tracking isn’t just an option — it’s a necessity. The Chemical KPI Scorecard in Excel is a ready-to-use, data-driven performance management template that helps manufacturers, processors, and laboratories monitor key metrics, compare results against targets, and make informed business decisions — all within Excel’s simplicity.
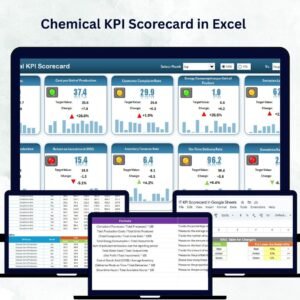
This scorecard turns your data into visual insights that boost productivity, ensure compliance, and drive profitability. Whether you manage production plants or research facilities, this tool is built to simplify your operations and provide instant visibility into every KPI that matters.Chemical KPI Scorecard in Excel
⚡ Key Features of Chemical KPI Scorecard in Excel
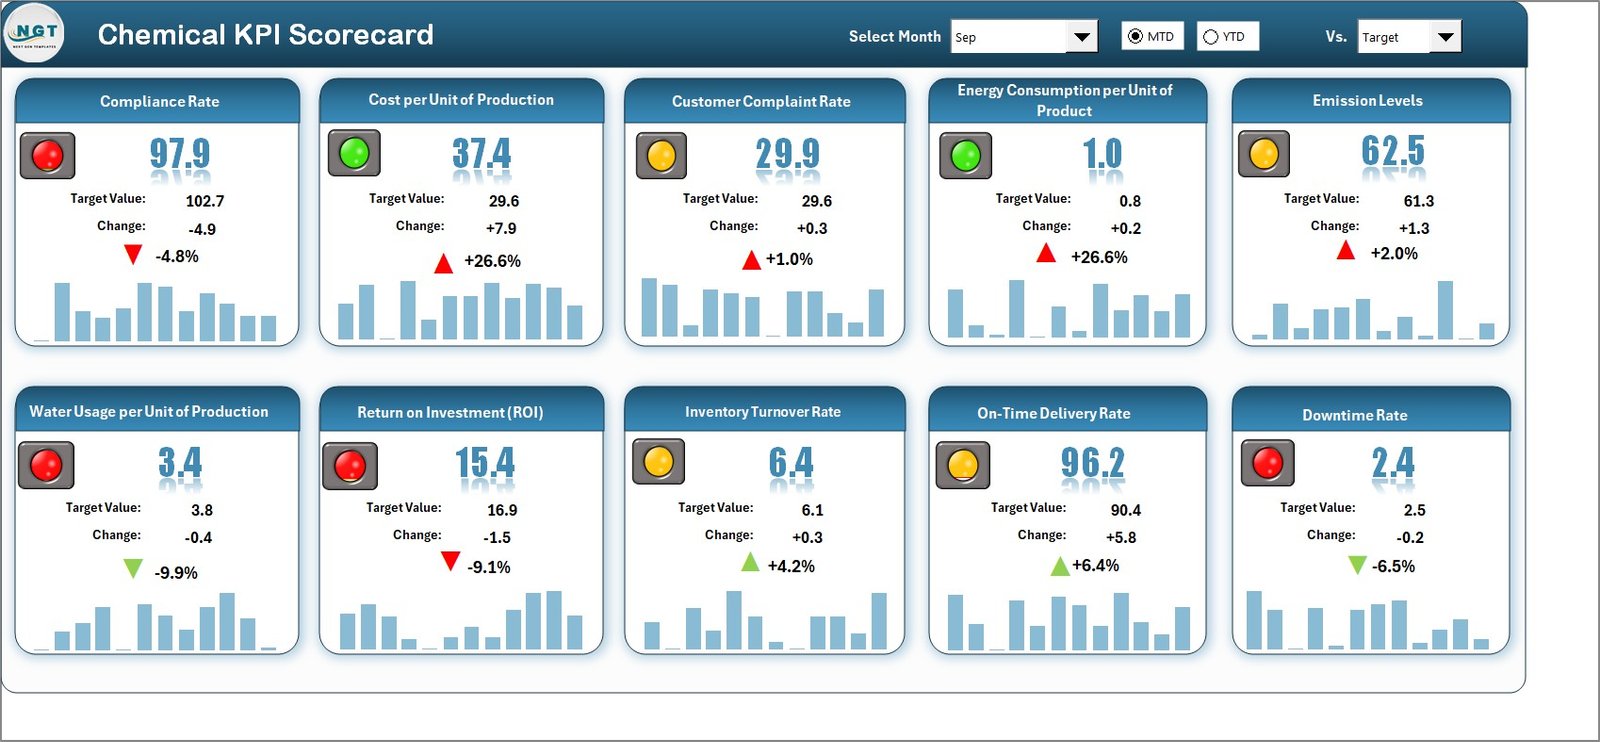
✨ All-in-One Dashboard: Instantly view Month-to-Date (MTD) and Year-to-Date (YTD) performance for up to 10 KPIs on a single screen.
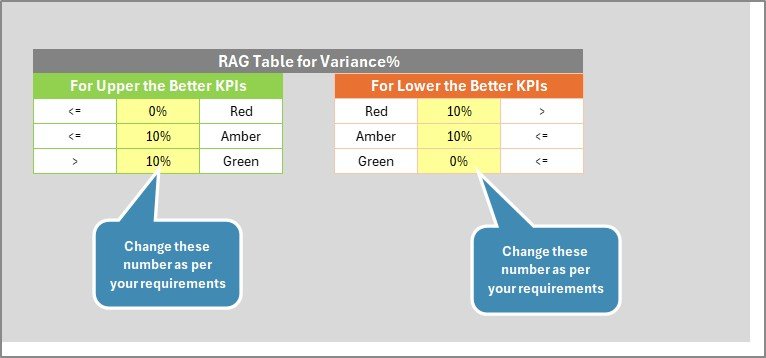
📊 Actual vs Target Comparison: Quickly evaluate performance gaps and identify which areas are exceeding or missing targets.
🎨 Color-Coded Visuals: Intuitive green and red indicators make it easy to spot success or underperformance at a glance.
🧠 Interactive Dropdowns: Choose any month or KPI group to automatically refresh dashboard visuals and tables.
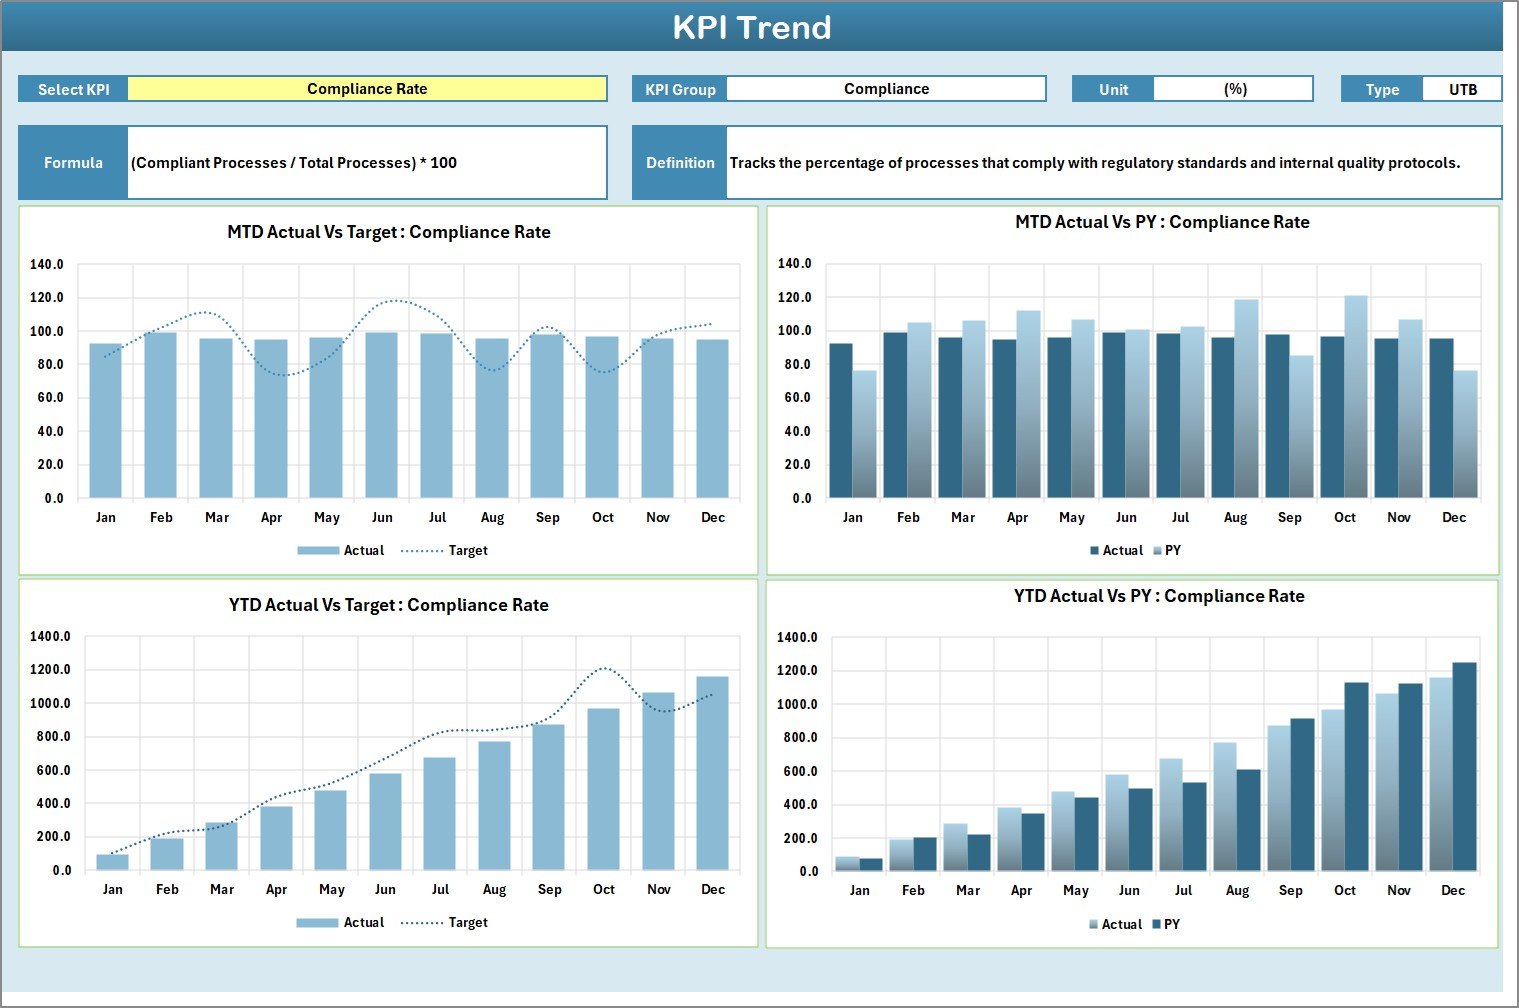
📈 Trend Analysis: Track KPI performance over time with dynamic charts that highlight progress and improvement opportunities.
💡 Customizable Layout: Add or remove KPIs, adjust targets, and edit formulas — no coding required.
💾 Affordable & Easy to Use: No need for costly BI software — Excel’s built-in power does it all.
🔐 Data Integrity Protection: Locked formulas and clean formatting ensure accuracy and consistency in reporting.
📦 What’s Inside the Chemical KPI Scorecard in Excel
The template comes with four professionally structured worksheet tabs, each serving a vital function in performance management:
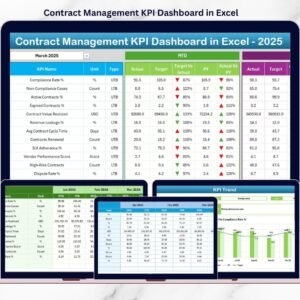
1️⃣ Scorecard Sheet – The main interface that displays 10 KPIs at a glance with dropdown-based filtering, MTD/YTD comparisons, and conditional formatting.
2️⃣ KPI Trend Sheet – Select a KPI name (Cell C3) to see trend charts, group info, formula, and definition. Instantly visualize progress over months and years.Chemical KPI Scorecard in Excel
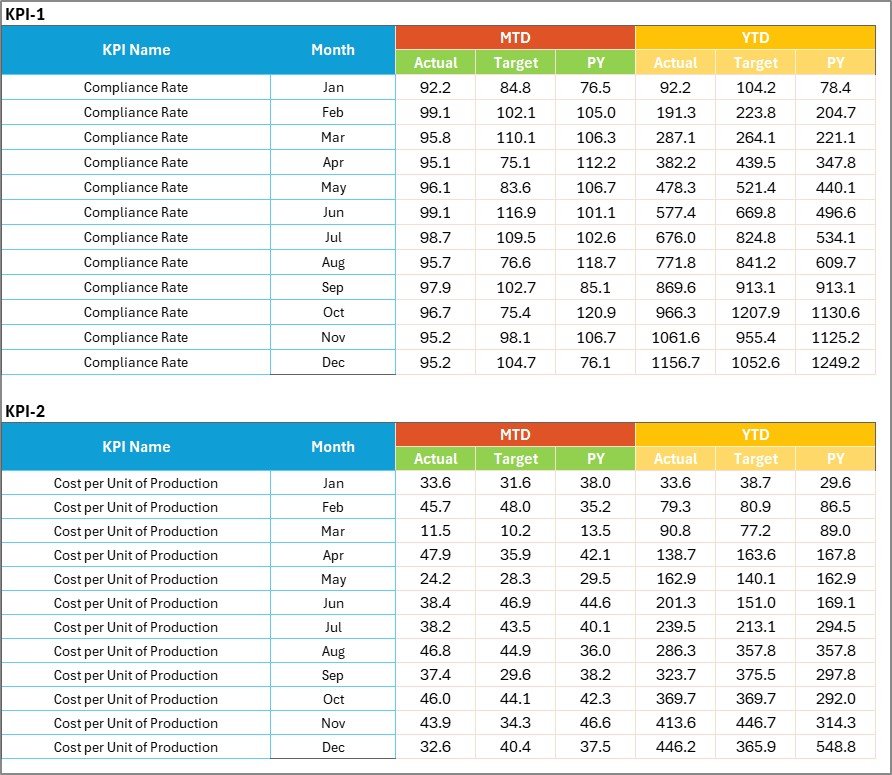
3️⃣ Input Data Sheet – The engine that powers the dashboard. Enter actual, target, and previous-year data here — the rest updates automatically.
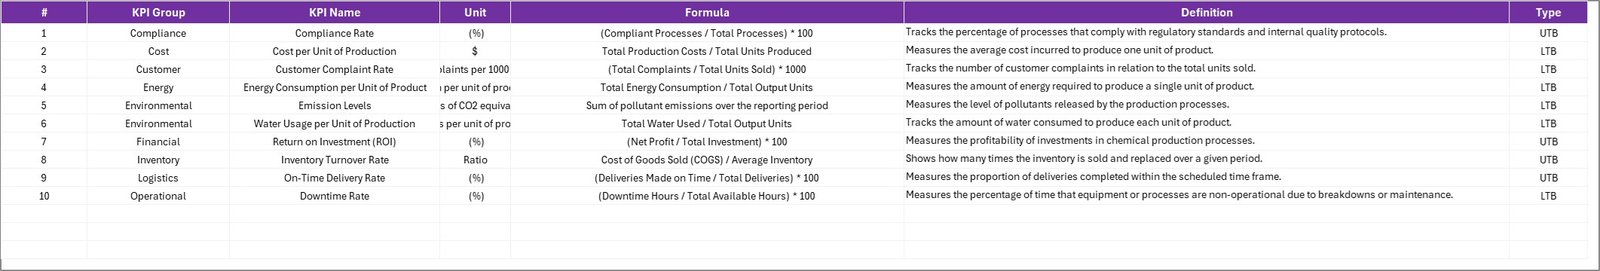
4️⃣ KPI Definition Sheet – A structured list of KPI names, units, formulas, and definitions ensuring transparency and uniform understanding across teams.
Together, these sheets create a seamless ecosystem for real-time KPI tracking, trend monitoring, and decision-making.
⚙️ How to Use the Chemical KPI Scorecard in Excel
🧩 Step 1: Define your KPIs — add names, formulas, and units in the KPI Definition Sheet.
📅 Step 2: Input actual, target, and previous-year data each month in the Input Data Sheet.
📊 Step 3: Open the Scorecard Sheet to view updated visuals and MTD/YTD comparisons.
📈 Step 4: Switch to the KPI Trend Sheet to analyze long-term patterns and identify gaps.
🎯 Step 5: Present your insights during team reviews or management meetings with color-coded charts and trend visuals.
With just a few clicks, you can transform raw data into actionable insights and strategic decisions.
👥 Who Can Benefit from This Chemical KPI Scorecard
🏭 Chemical Manufacturers: Monitor production output, yield, and energy usage to boost operational efficiency.
🔬 Research Laboratories: Track experiment throughput, accuracy, and resource utilization.
🚛 Distributors: Analyze shipment accuracy, delivery efficiency, and cost per unit.
🌱 Environmental Teams: Measure waste, emissions, and safety compliance indicators.
💼 Corporate Managers: Review profitability, ROI, and compliance performance at a glance.
No matter your company’s size or function, this template offers a scalable solution for clear, consistent, and insightful performance tracking.


Reviews
There are no reviews yet.