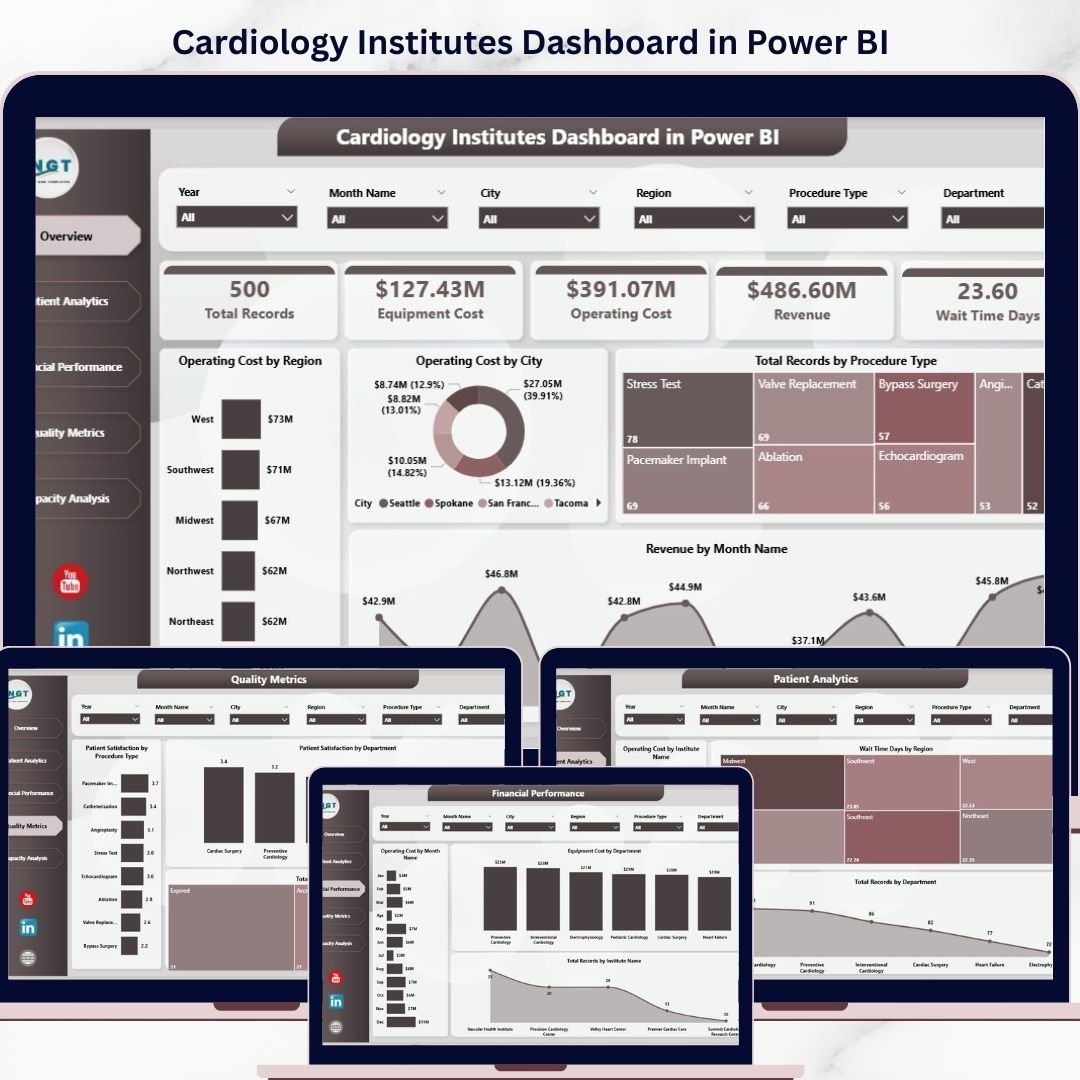


Key Features of Cardiology Institutes Dashboard in Power BI
Introducing the Cardiology Institutes Dashboard in Power BI – a comprehensive, ready-to-use digital solution designed to streamline and enhance your cardiology data analysis. Simply update your data file, connect it with the Power BI file, and refresh your dashboard instantly from the Home tab. This dashboard offers multiple interactive pages that deliver insightful visualizations and actionable analytics tailored for cardiology institutes.
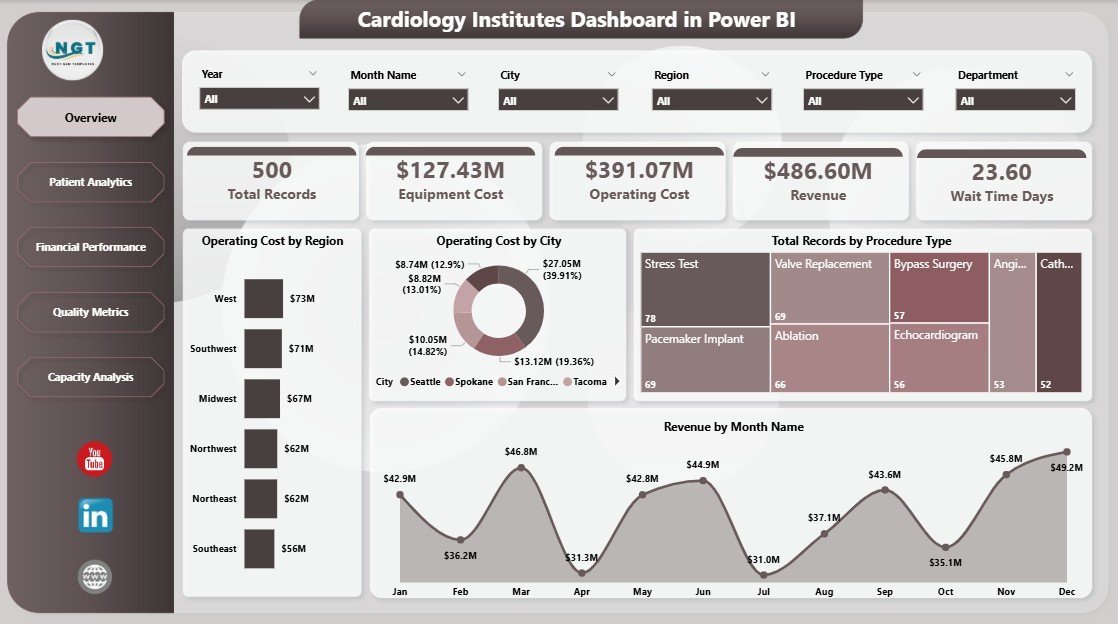
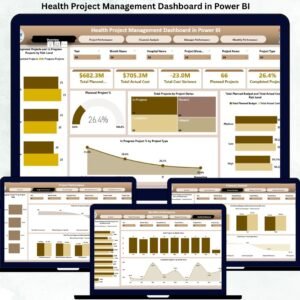
On the Overview Page, you will find high-level cards displaying Total Records, Equipment Cost, Operating Cost, Revenue, and average Wait Time Days. Multiple dynamic charts provide detailed insights, including Operating Cost by Region and City, Total Records by Procedure Type, and Revenue by Month, all supported by interactive slicers for quick filtering and drill-downs.
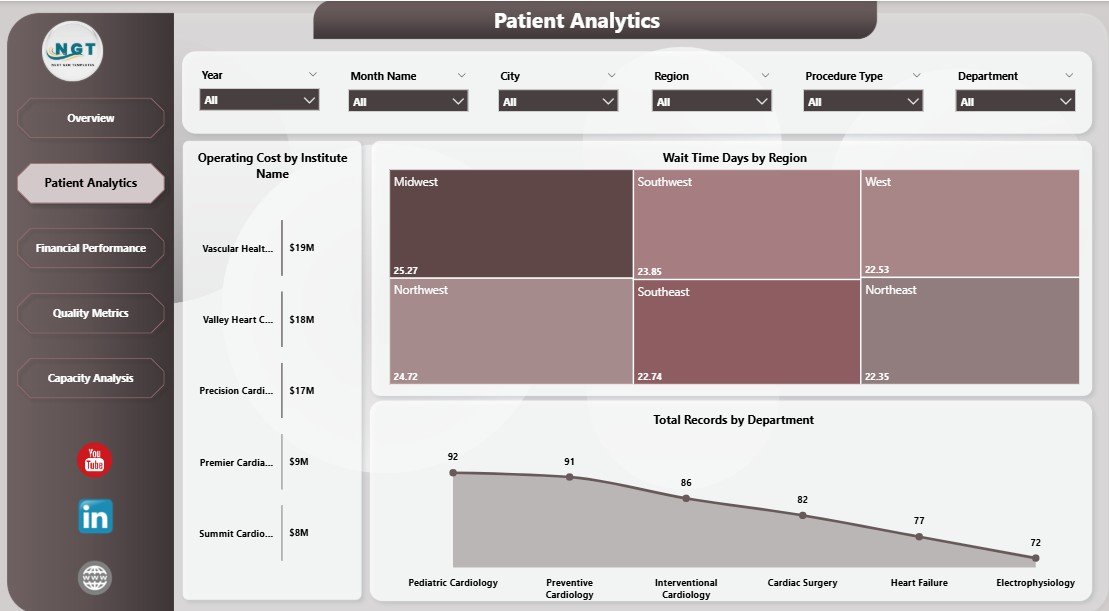
Explore the Patient Analytics sheet for deep dives into Operating Cost by Institute Name, Wait Time Days by Region, and Total Records by Department, enabling you to understand patient flow and cost distribution effectively.
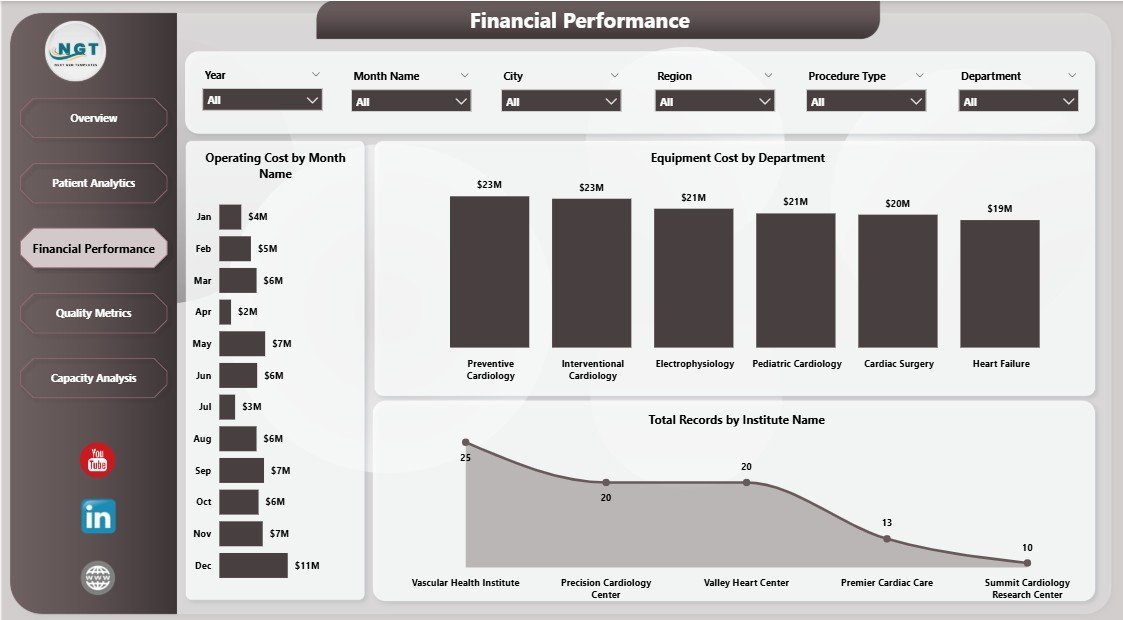
The Financial Performance page highlights key fiscal metrics such as Operating Cost by Month, Equipment Cost by Department, and Total Records by Institute Name, helping you track and optimize your financial health with ease.
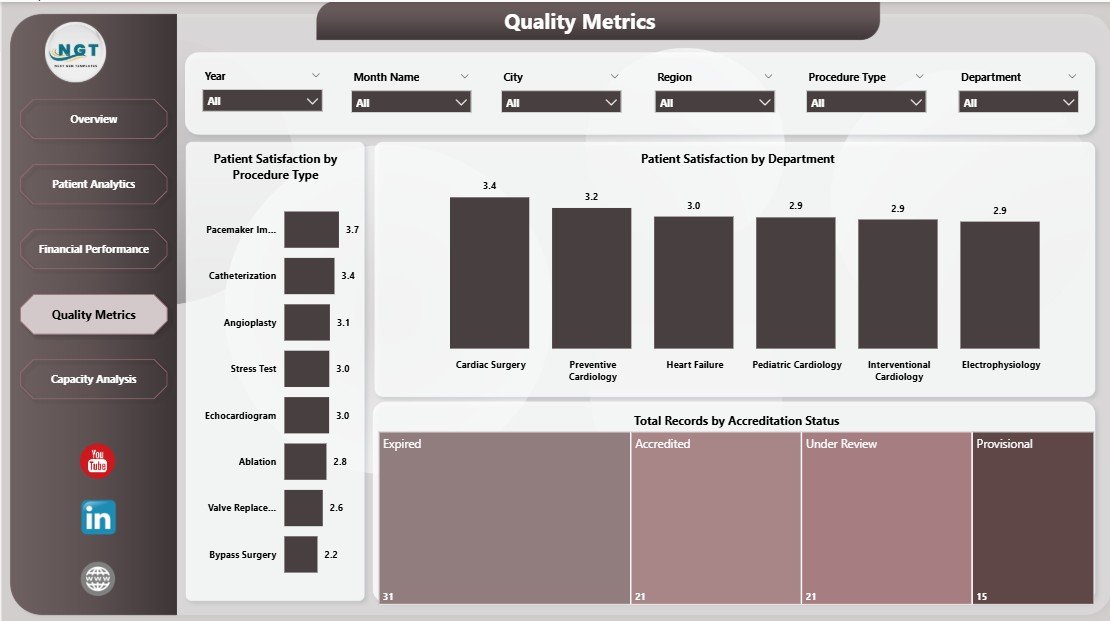
Quality is paramount, and the Quality Metrics tab focuses on Patient Satisfaction by Procedure Type and Department, along with Total Records by Accreditation Status, empowering decision-makers to improve service standards and compliance.
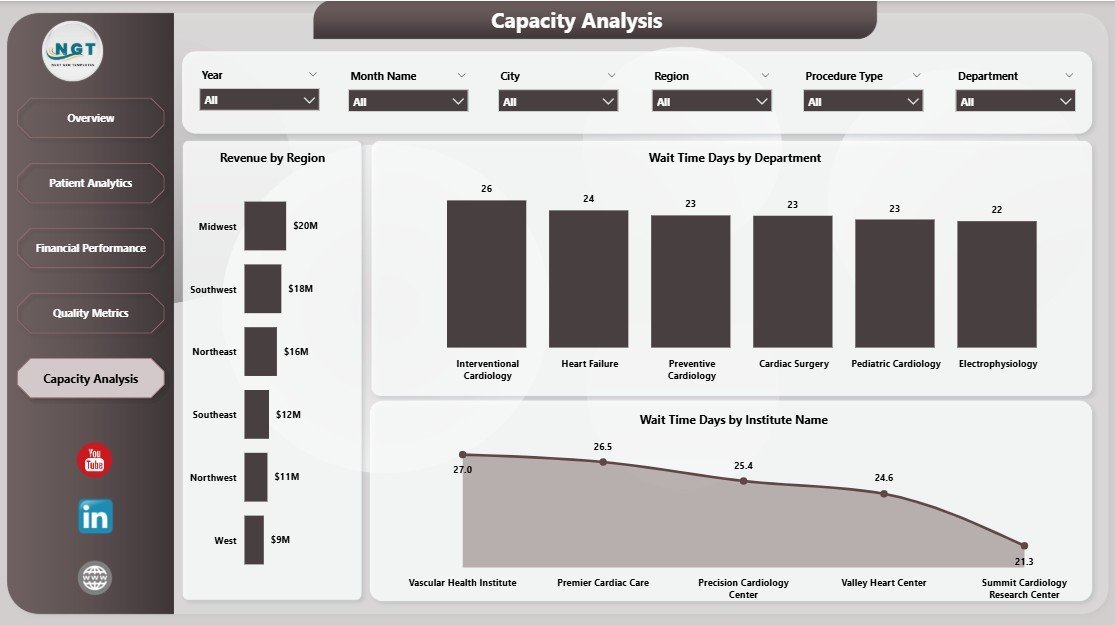
Lastly, the Capacity Analysis sheet offers crucial insights into Revenue by Region, Wait Time Days by Department, and Institute Name, facilitating resource allocation and operational efficiency improvements.

Cardiology Institutes Dashboard in Power BI
What’s Inside the Cardiology Institutes Dashboard in Power BI
- 🩺 Multiple Interactive Pages: Overview, Patient Analytics, Financial Performance, Quality Metrics, and Capacity Analysis for full-spectrum insights.
- 📊 Dynamic Visualizations: Charts and cards that provide instant clarity on key performance indicators.
- ⚙️ Easy Data Refresh: Simply update your data file and hit refresh to get the latest insights.
- 🔍 Multi-level Filtering: Slicers allow you to quickly filter data by region, department, procedure type, and more.
- 💡 Actionable Insights: Designed specifically for cardiology institutes to improve operational, financial, and patient care decisions.
- 📈 Financial Tracking: Monitor costs and revenue trends to optimize budgeting and resource allocation.
- ⭐ Quality & Satisfaction Metrics: Keep track of patient satisfaction and accreditation status to maintain high standards.
- ⏱️ Wait Time Analysis: Identify bottlenecks and improve patient flow across departments and regions.
Patient Analytics in Cardiology Institutes Dashboard in Power BI

Financial Performance in Cardiology Institutes Dashboard in Power BI
Quality Metrics in Cardiology Institutes Dashboard in Power BI

Capacity Analysis in Cardiology Institutes Dashboard in Power BI
How to Use the Cardiology Institutes Dashboard in Power BI
- 🔄 Update Your Data File: Replace existing data with your institute’s latest records in the provided data file.
- 🔗 Connect Data to Power BI: Open the Power BI dashboard file and link it with your updated data source.
- 📅 Refresh Dashboard: Simply click the Refresh button from the Home tab to load the latest data and visuals.
- 🧩 Apply Filters: Use the slicers on each page to drill down into specific categories like region, procedure type, or department.
- 📊 Explore Pages: Navigate through Overview, Patient Analytics, Financial Performance, Quality Metrics, and Capacity Analysis for targeted insights.
- 🚀 Make Data-Driven Decisions: Use the insights to optimize operations, improve patient satisfaction, reduce costs, and increase revenue.
Who Can Benefit from This Cardiology Institutes Dashboard in Power BI
- 🏥 Hospital Administrators: Gain a complete view of operational and financial metrics to manage cardiology departments effectively.
- 📈 Data Analysts: Easily analyze complex cardiology data with simplified visualizations and reports.
- 💼 Healthcare Executives: Monitor key performance indicators to drive strategic improvements and budgeting.
- 👩⚕️ Cardiology Department Heads: Understand patient flow, procedure types, and satisfaction to enhance care quality.
- 📊 Financial Officers: Track and manage revenue, costs, and equipment investments precisely.
- 💻 Consultants & Auditors: Use the dashboard for performance reviews, compliance checks, and quality assessments.
- 🎯 Healthcare IT Teams: Deploy and maintain an easy-to-update dashboard that aligns with organizational goals.
Click here to read the Detailed blog post.
Visit our YouTube channel to learn step-by-step video tutorials


Reviews
There are no reviews yet.