The car rental industry is rapidly evolving. Rising customer expectations, fluctuating costs, and the need for instant digital insights mean that manual reports and spreadsheets are no longer enough. To stay ahead of the competition, you need a tool that gives you real-time visibility into performance and helps you make informed decisions.
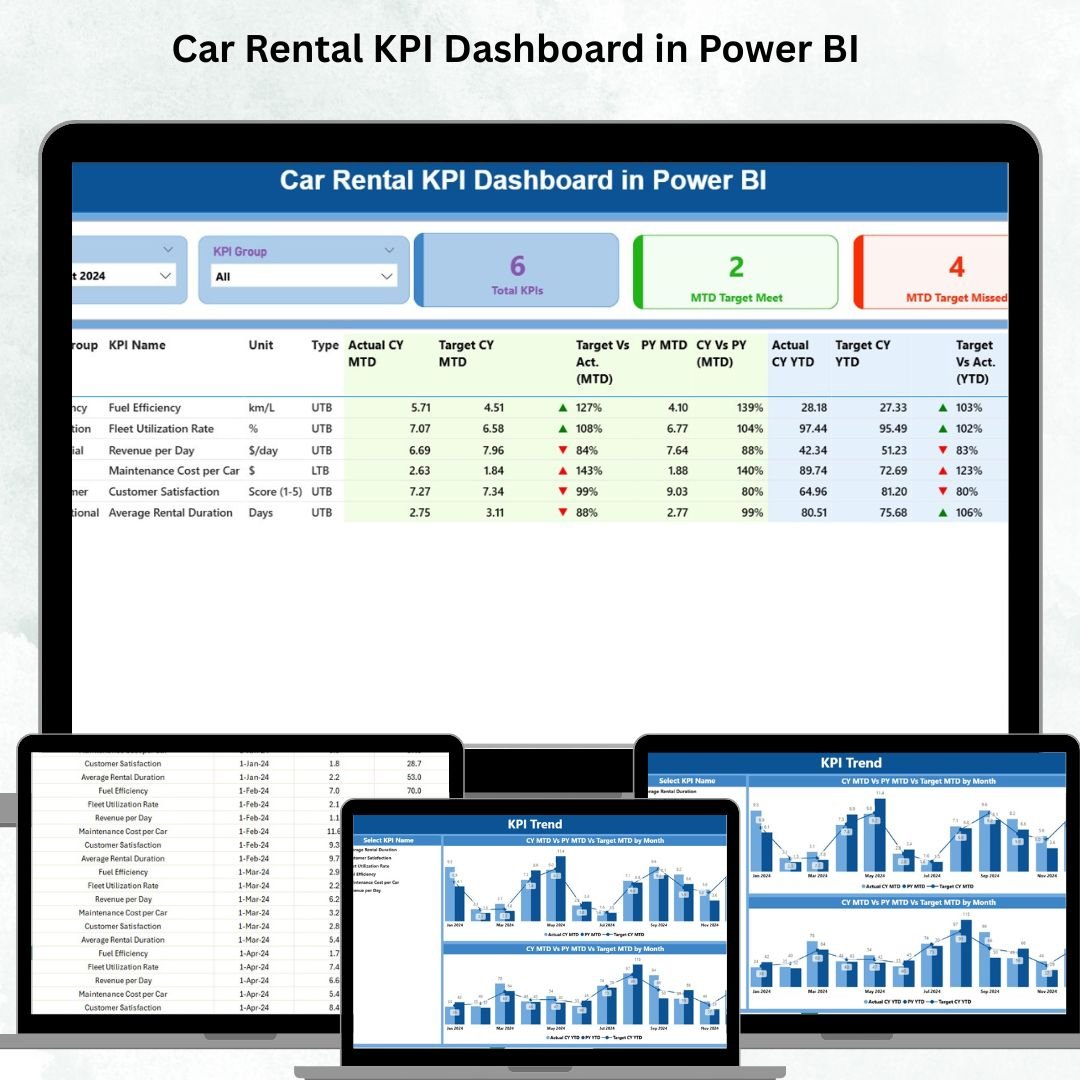
That’s exactly what the Car Rental KPI Dashboard in Power BI delivers. This ready-to-use, interactive dashboard brings together your rental business data, transforming it into actionable insights. With its intuitive visuals and automated updates, you can track everything from fleet utilization to revenue performance at a glance.
No more waiting for monthly reports—this dashboard ensures you can act fast, stay agile, and scale your business confidently.
✨ Key Features of the Car Rental KPI Dashboard in Power BI
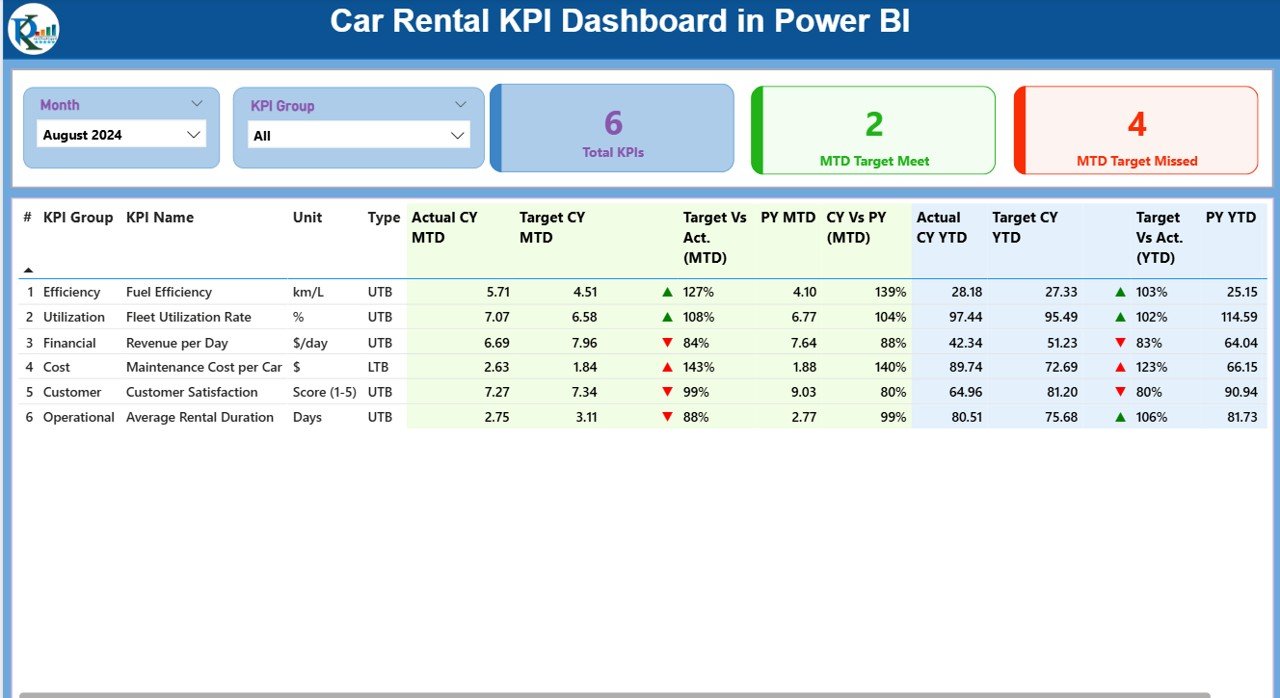
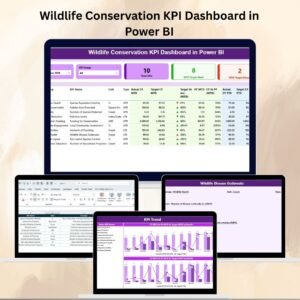
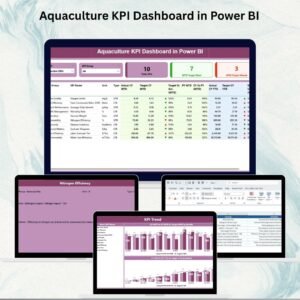
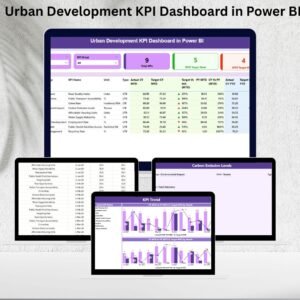
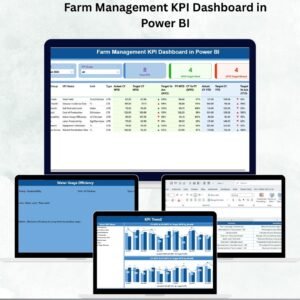
✅ Summary Page – Get a high-level snapshot of your car rental performance with:
-
KPI Cards for Total KPIs, MTD Target Met, and MTD Target Missed.
-
Detailed KPI Table with metrics like utilization %, targets vs. actuals, YTD analysis, and previous year comparisons.
-
Interactive slicers for quick filtering by Month or KPI Group.
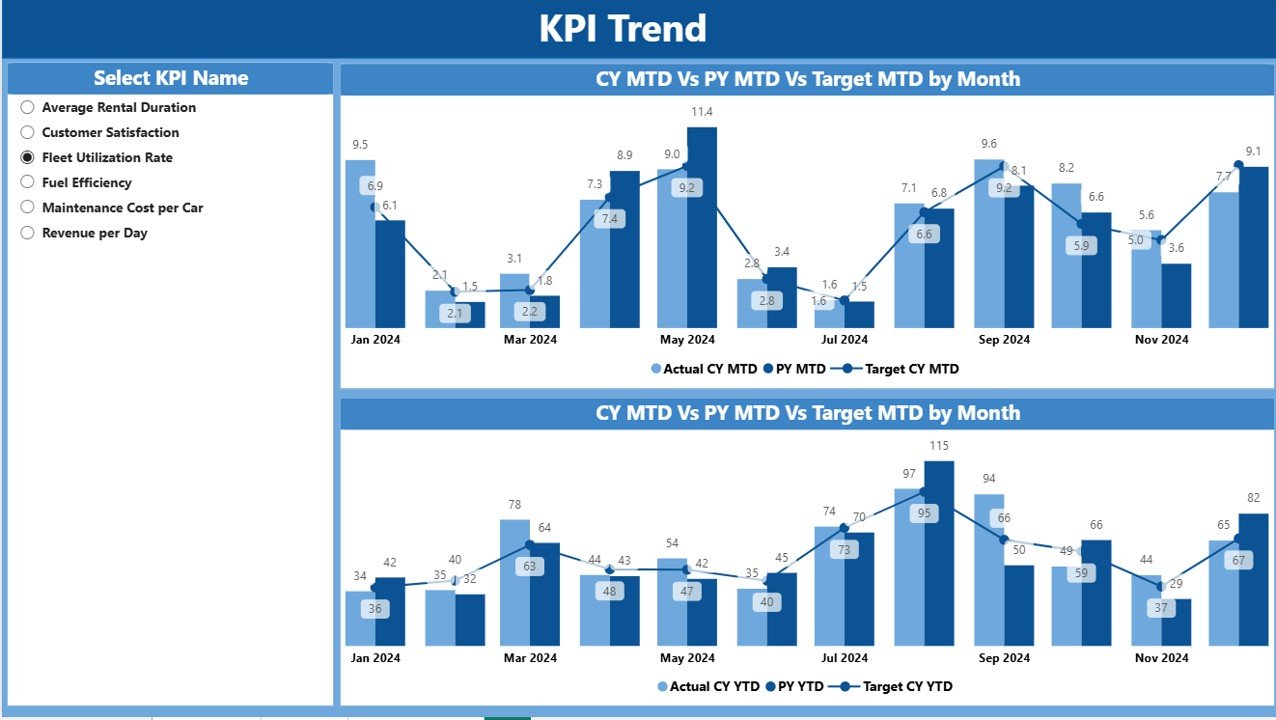
✅ KPI Trend Page – Analyze long-term trends with:
-
Combo charts comparing Actual vs. Target for both MTD and YTD.
-
Slicers to drill into specific KPIs.
-
Comparison of Current Year vs. Previous Year performance.
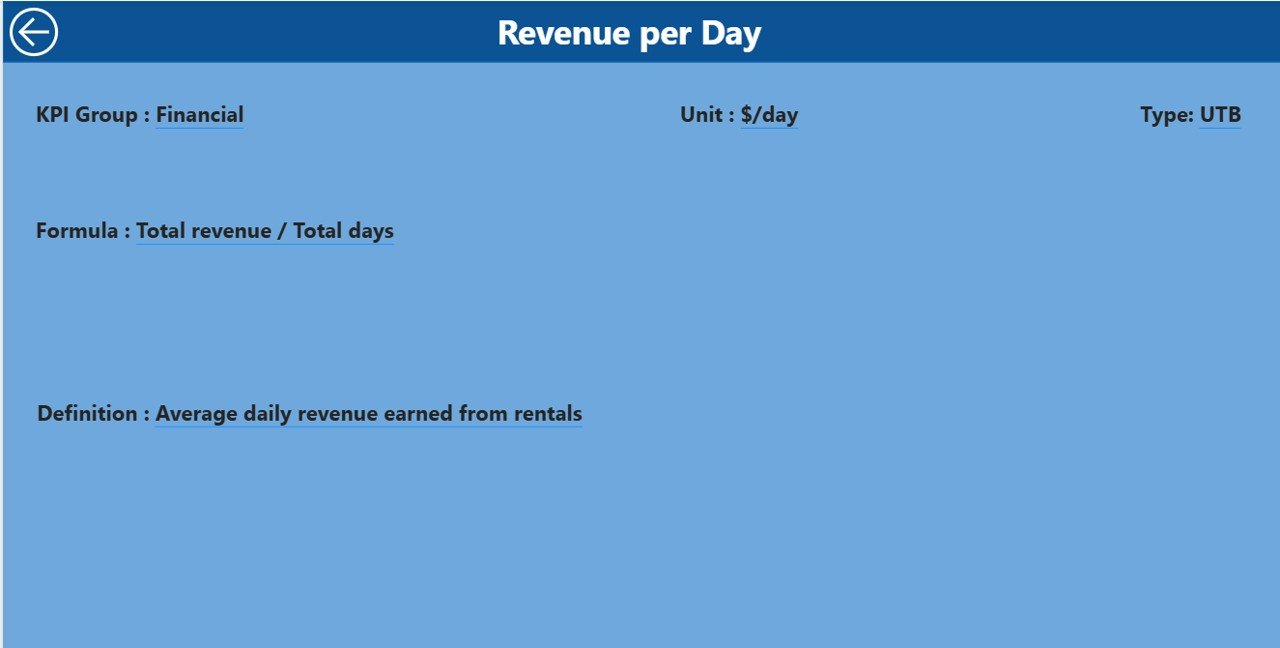
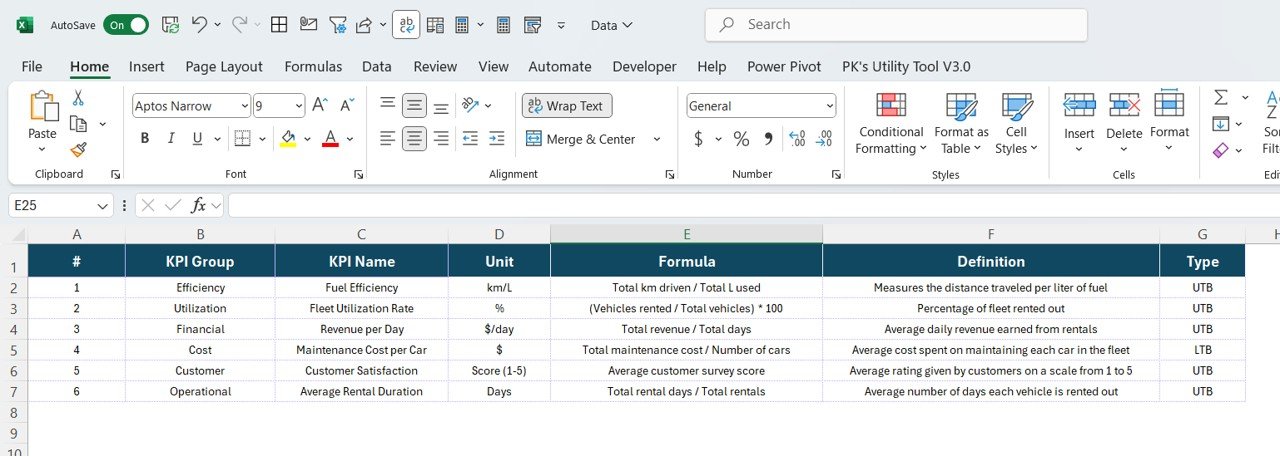
✅ KPI Definition Page – Ensure clarity with:
-
Detailed KPI formulas, definitions, and types (UTB/LTB).
-
A drill-through option from the Summary Page.
-
A back button for easy navigation.
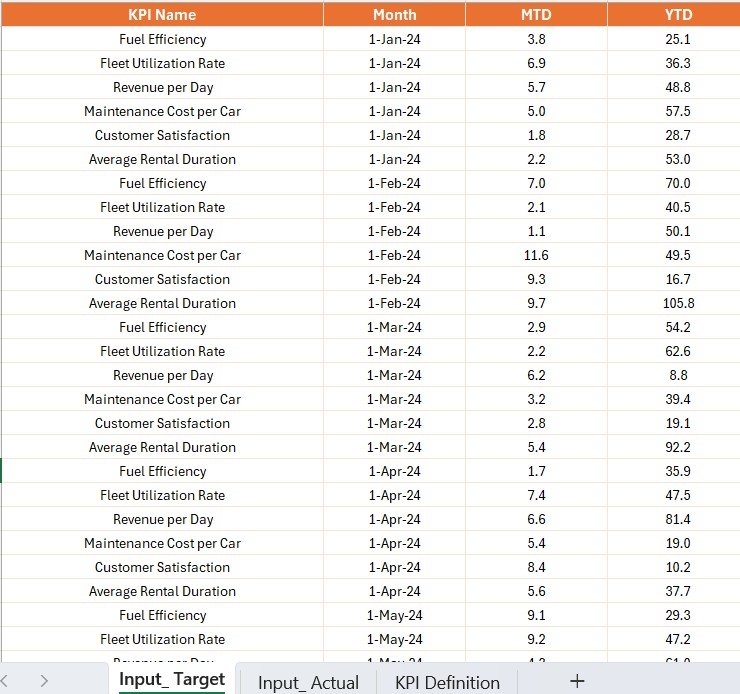
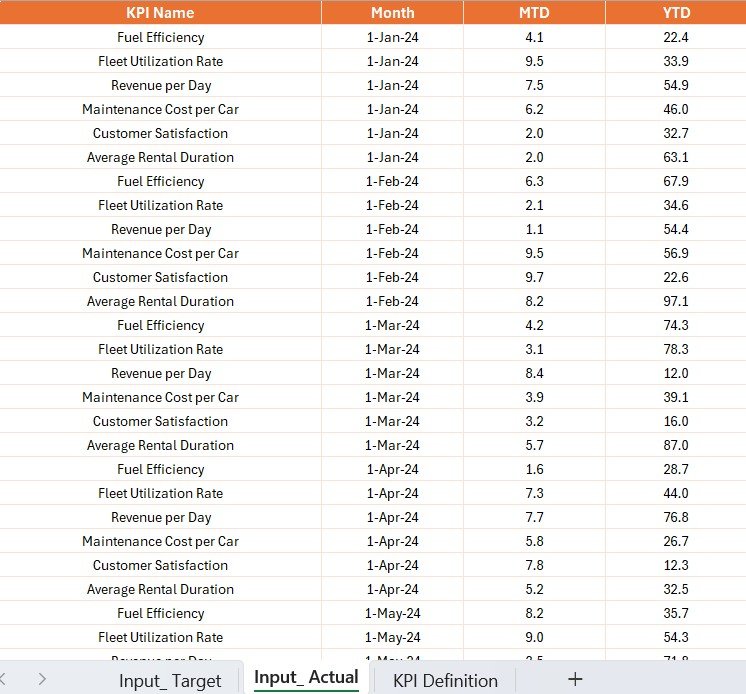
✅ Excel-Powered Data Input – Three structured sheets for easy updates:
-
Input_Actual (performance data).
-
Input_Target (planned goals).
-
KPI Definition (KPI logic and structure).
📂 What’s Inside the Car Rental KPI Dashboard in Power BI
When you download this dashboard, you get access to:
-
Pre-Built Pages: Summary, KPI Trend, KPI Definition.
-
Interactive Visuals: Cards, slicers, combo charts, and color-coded indicators (▲/▼).
-
Excel Input Files: To manage Actual, Target, and KPI Definitions.
-
Automated Analysis: Instantly updated visuals whenever you refresh data.
-
Customizable KPIs: Add, edit, or modify KPI definitions easily.
⚡ How to Use the Car Rental KPI Dashboard
1️⃣ Update Input Files – Add actual performance and target data in Excel.
2️⃣ Open Power BI Dashboard – Load the files for automatic updates.
3️⃣ Use Slicers – Filter by Month, KPI, or Group to focus on specific metrics.
4️⃣ Review Summary Page – Instantly see which KPIs are on track and which need attention.
5️⃣ Explore Trends – Use KPI Trend Page to study seasonal variations and long-term patterns.
6️⃣ Drill Through – Navigate to KPI Definition Page for in-depth understanding.
7️⃣ Share Reports – Export or share interactive dashboards with stakeholders.
🎯 Who Can Benefit from the Car Rental KPI Dashboard?
This dashboard is perfect for:
-
🚘 Car Rental Agencies – Optimize fleet utilization and revenue per vehicle.
-
🏢 Corporate Fleet Managers – Monitor costs, utilization, and service quality.
-
💼 Small Rental Businesses – Gain transparency without expensive systems.
-
📊 Finance & Operations Teams – Track actuals vs. targets for smarter planning.
-
🌍 Large Enterprises – Manage multi-location car rental operations with scalability.
✅ Why Choose This Dashboard?
-
📊 Centralized Insights – All KPIs in one place.
-
⚡ Real-Time Tracking – No delays, no guesswork.
-
✔ Data Accuracy – Reduce manual errors.
-
🕒 Time-Saving – Eliminate spreadsheet overload.
-
💡 Smarter Decisions – Act on facts, not assumptions.
-
🔧 Customizable – Tailor KPIs to your business.
-
📈 Scalable – Suitable for small businesses and large fleets alike.


Reviews
There are no reviews yet.