Make Business Valuation Dashboard decisions with confidence using this powerful Business Valuation Dashboard in Excel 🚀. In today’s fast-moving business world, understanding the true value of a company is essential for investments, mergers, acquisitions, and growth strategies.
However, manual calculations and scattered spreadsheets often lead to confusion and delays. That’s where this dashboard comes in. It transforms complex financial data into clear, interactive, and actionable insights.
With this ready-to-use Excel template, you can easily track valuation metrics, financial health, risk factors, and industry comparisons—all in one centralized dashboard. As a result, you gain better clarity and make faster, data-driven decisions.
🚀 Key Feature of Business Valuation Dashboard in Excel
✅ 📊 Interactive Excel Dashboard
Analyze financial data using dynamic charts and slicers.
✅ 📈 Comprehensive KPI Tracking
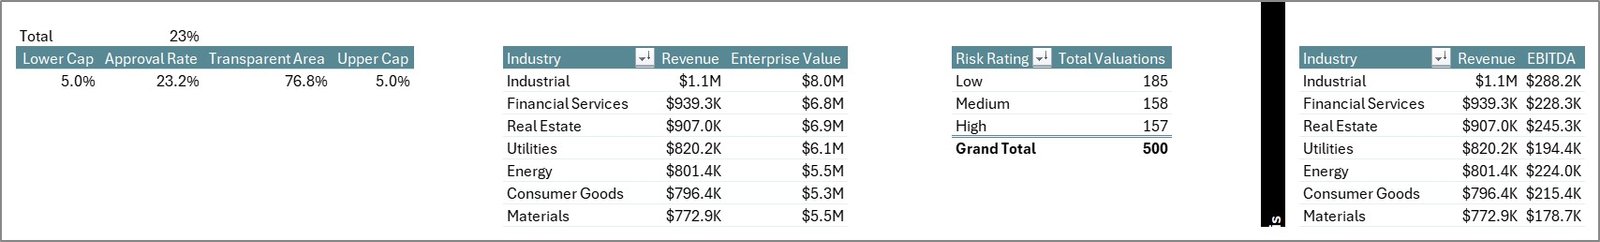
Track EV, EBITDA, Revenue, Market Cap, and profitability ratios.
✅ 📅 Multi-Page Analysis Structure
Explore data across Overview, Industry, Risk, Financial Health, and Month Analysis.
✅ ⚙️ Automated Calculations
Support sheet handles formulas for accurate and instant results.
✅ 📉 Advanced Data Visualization
Understand trends using comparison charts and performance metrics.
✅ 🔍 Risk & Industry Insights
Evaluate valuation based on risk rating and industry performance.
✅ 📂 Structured Data Management
Separate Data and Support sheets for clean and efficient handling.
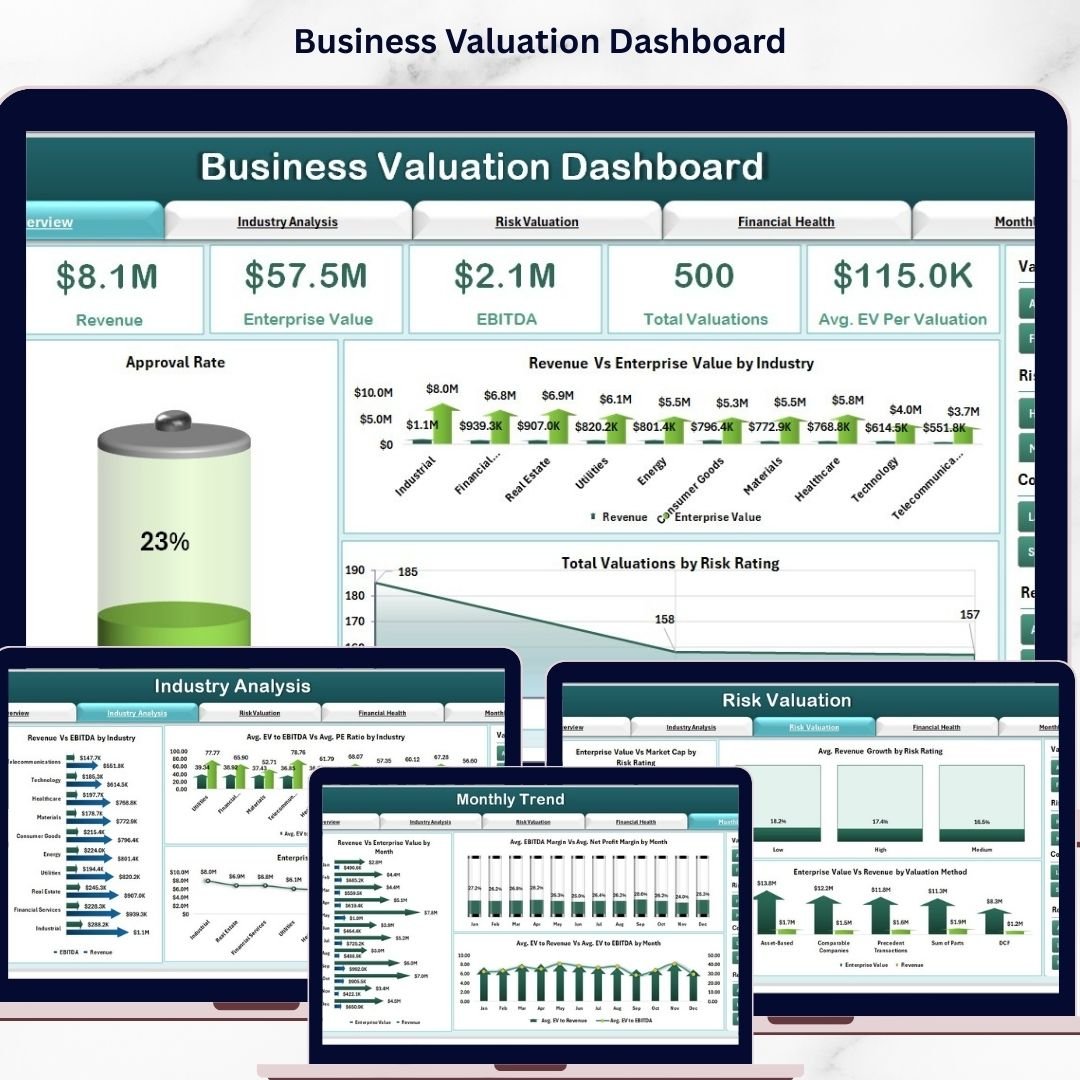
📦 What’s Inside the Business Valuation Dashboard in Excel
This template includes multiple analytical pages for complete business evaluation:
📊 Overview Page – Snapshot of key valuation metrics with KPI cards
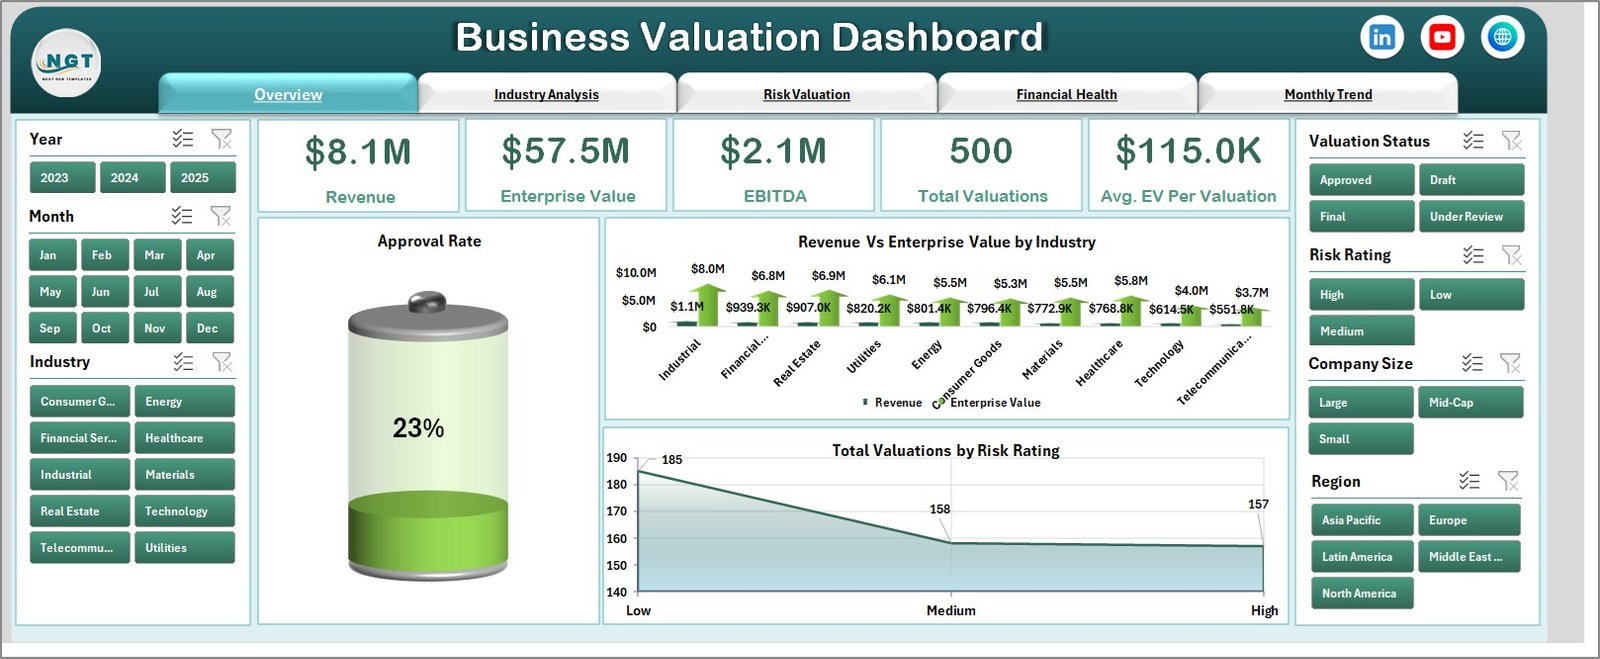
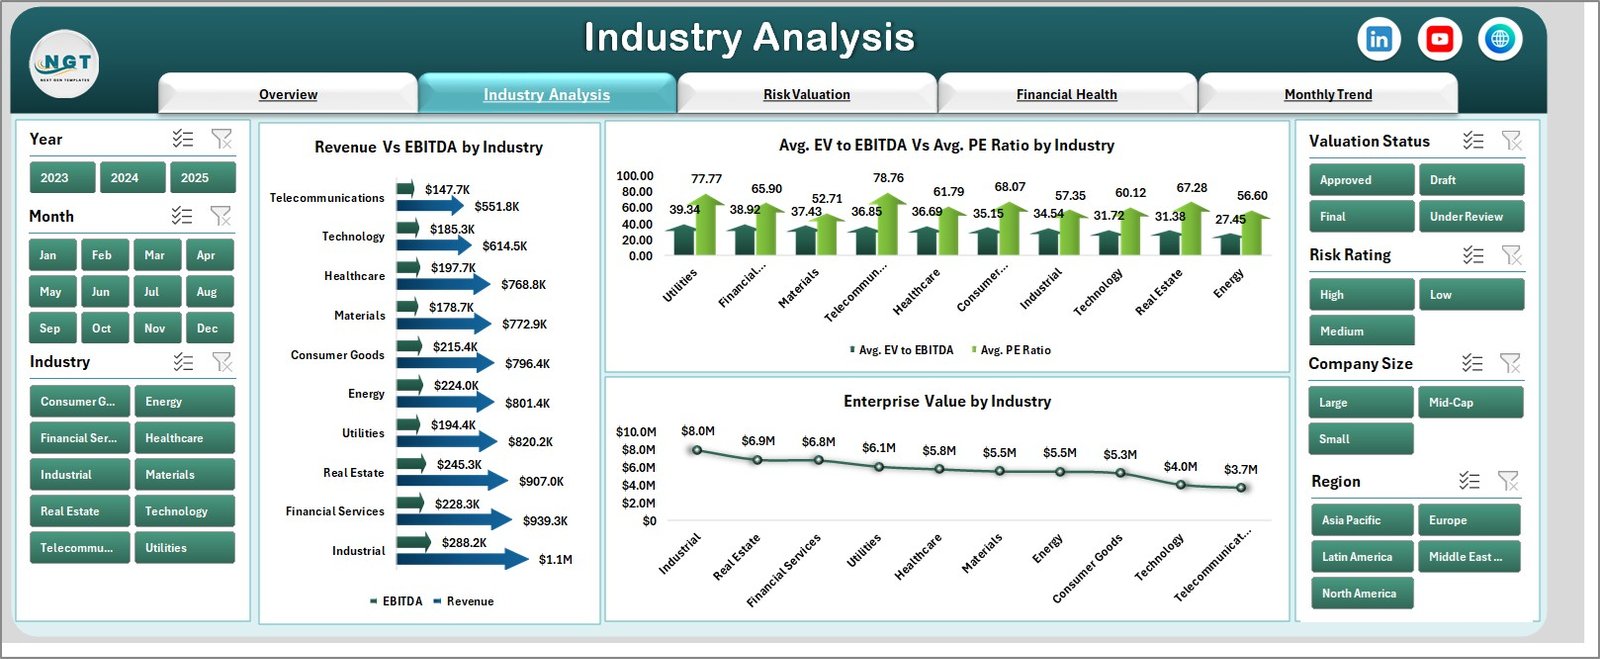
🏭 Industry Analysis – Compare performance across industries
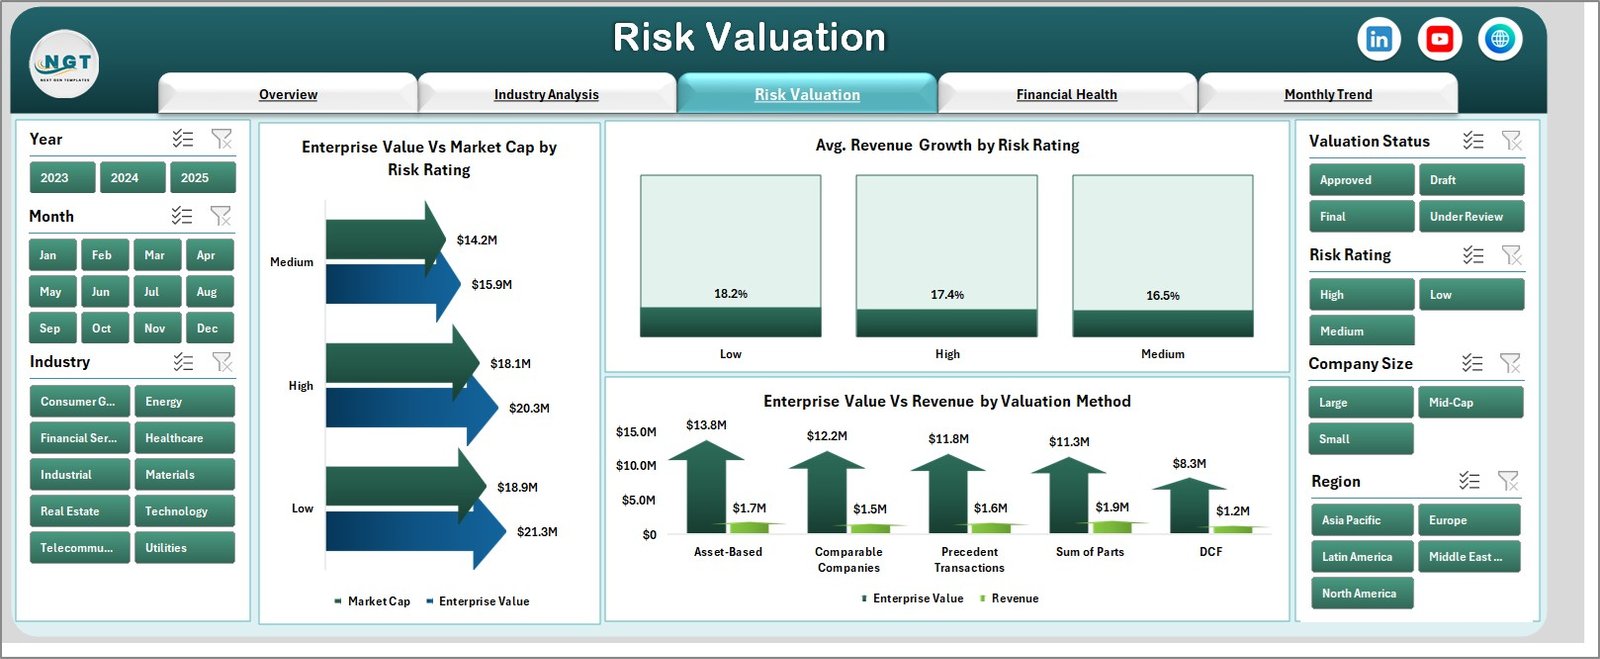
⚠️ Risk Valuation Page – Analyze risk impact on valuation
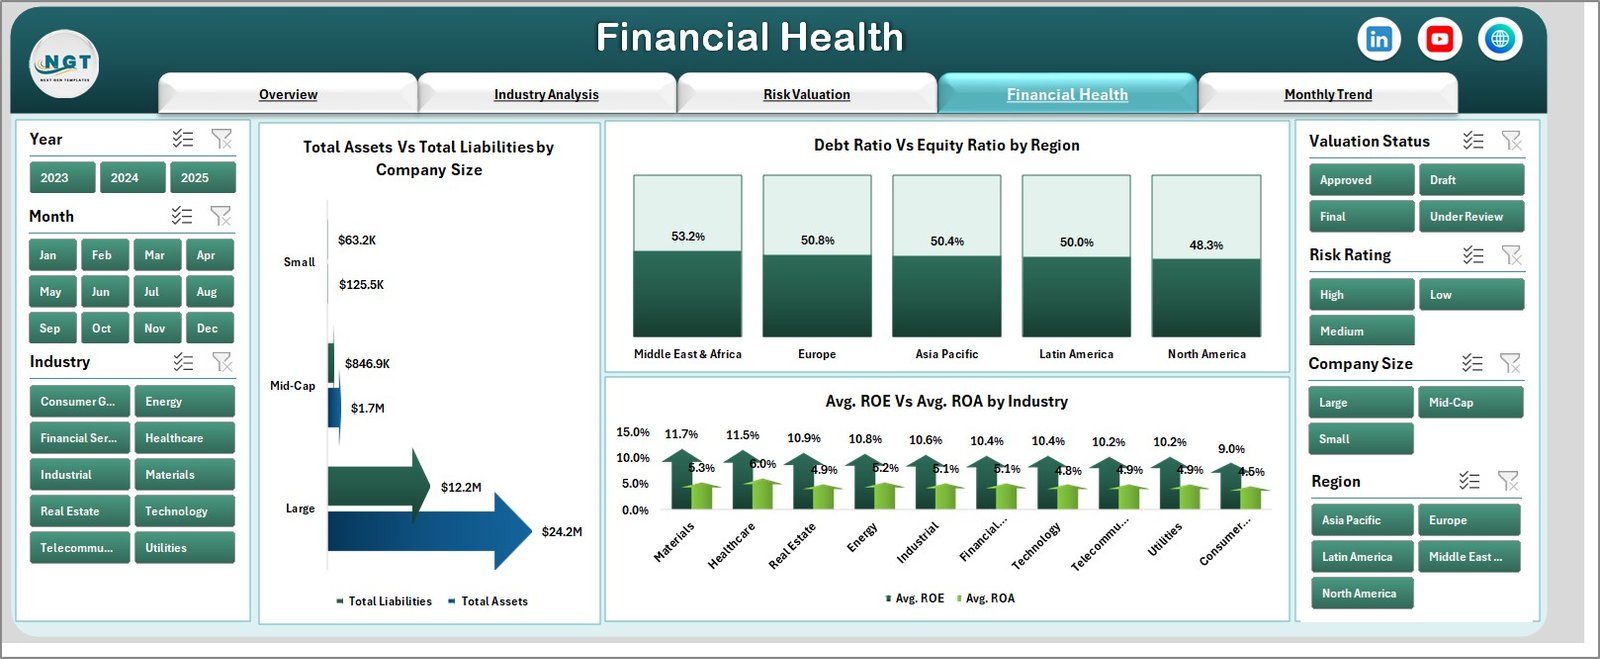
💰 Financial Health Page – Evaluate assets, liabilities, and profitability
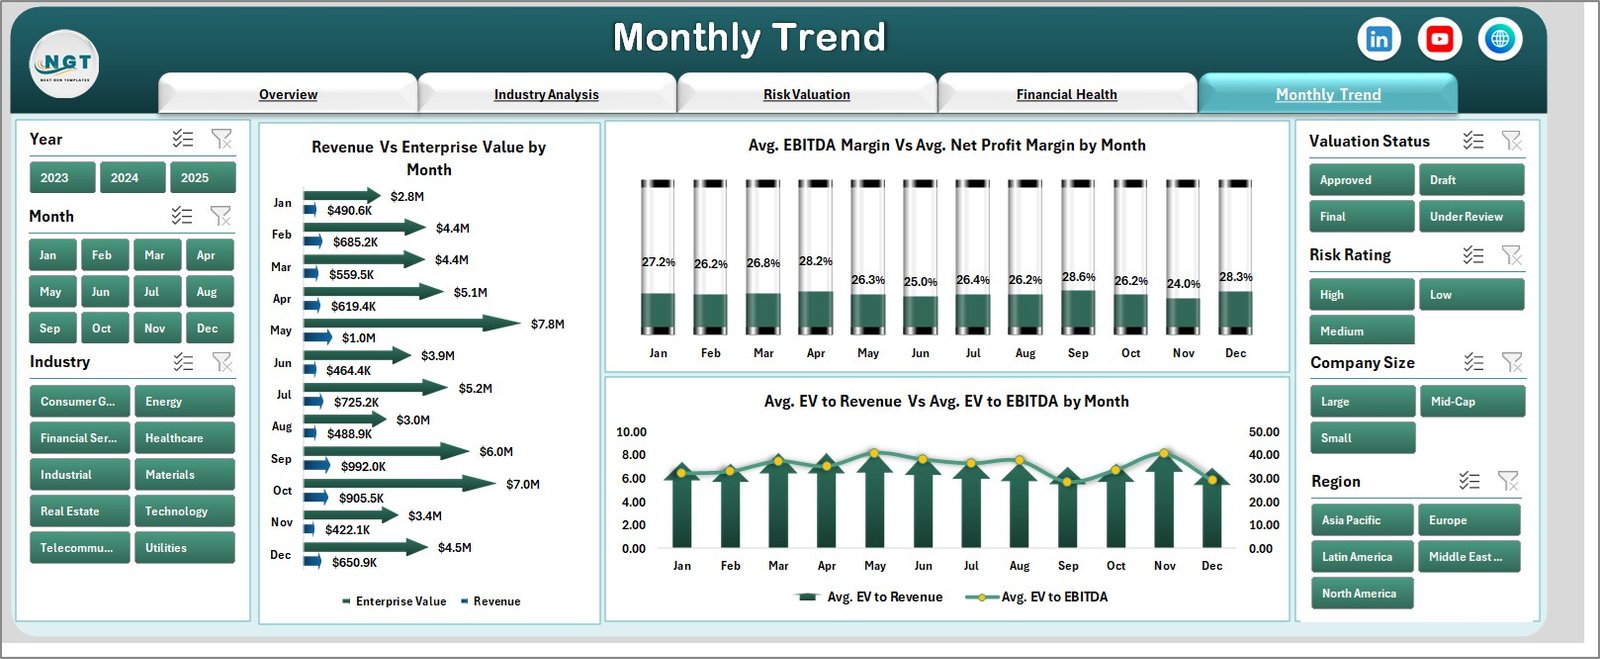
📅 Month Analysis Page – Track trends and performance over time
📂 Additional Sheets:
-
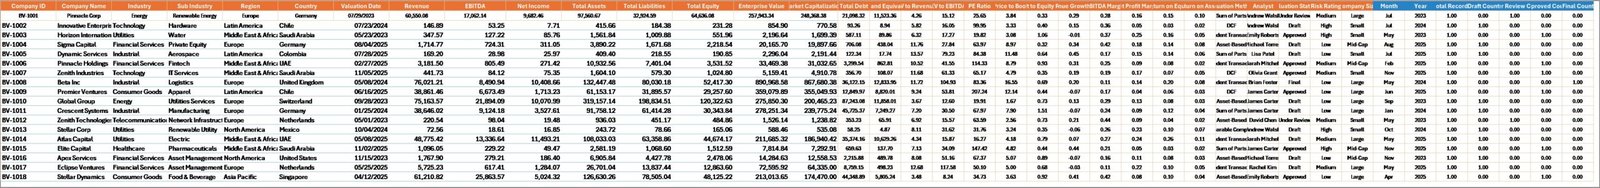
Data Sheet – Stores raw data
-
Support Sheet – Handles backend calculations
Everything is designed to give you a complete financial analysis system.
⚙️ How to Use the Business Valuation Dashboard in Excel
Using this dashboard is simple and effective:
👉 Enter your data in the Data Sheet
👉 Calculations update automatically in the Support Sheet
👉 Dashboard visuals refresh instantly
👉 Use slicers to filter by industry, risk, or time
👉 Analyze charts and KPIs for insights
Within minutes, you can convert raw financial data into professional business insights.
👨💼 Who Can Benefit from This Business Valuation Dashboard in Excel
This dashboard is ideal for:
📊 Financial Analysts – Perform detailed valuation analysis
💼 Business Owners – Understand company worth and growth
📈 Investors – Evaluate investment opportunities
🏦 Investment Bankers – Analyze deals and performance
📉 Consultants – Provide data-driven recommendations
🚀 Startup Founders – Track growth and financial health
Anyone involved in financial planning and valuation will benefit from this tool.
🔗 Click hare to read the Detailed blog post
Explore the complete guide with features, benefits, and best practices.
👉 Visit our YouTube channel to learn step-by-step video tutorials:
https://youtube.com/@PKAnExcelExpert