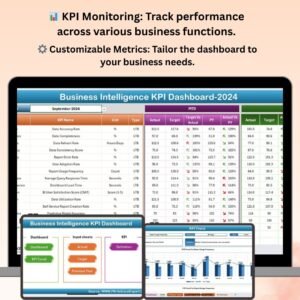
The Business Intelligence KPI Dashboard in Excel is a powerful tool designed to help businesses track and analyze their key performance indicators (KPIs) with ease. This Excel-based dashboard brings together critical business data in one centralized location, providing real-time insights into your company’s performance across various metrics.
This tool is ideal for business managers, executives, and decision-makers who need to monitor and assess multiple aspects of their business operations. Whether you’re tracking sales, marketing, finance, or customer service, this dashboard enables you to make data-driven decisions, identify trends, and optimize business strategies.
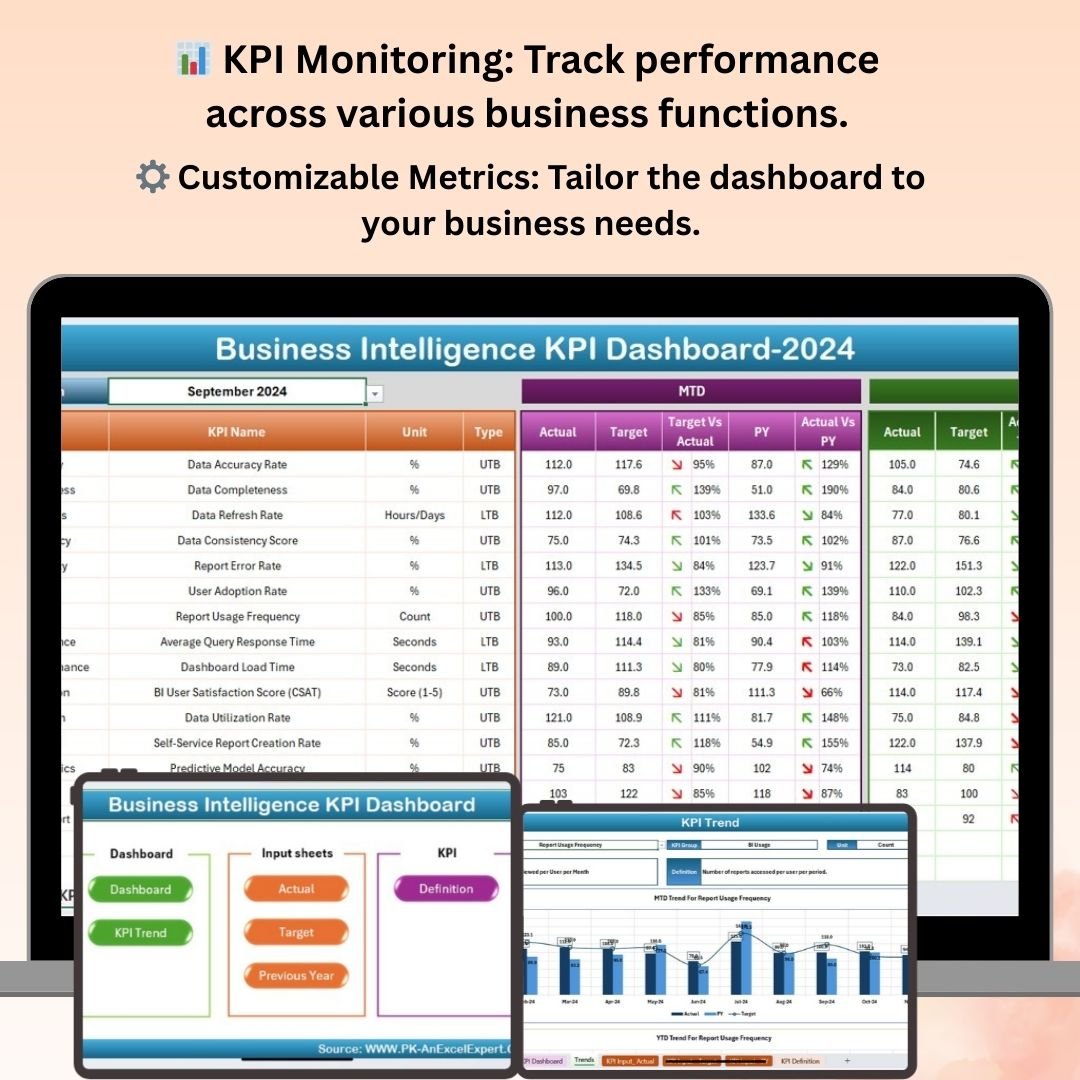
Key Features of the Business Intelligence KPI Dashboard in Excel
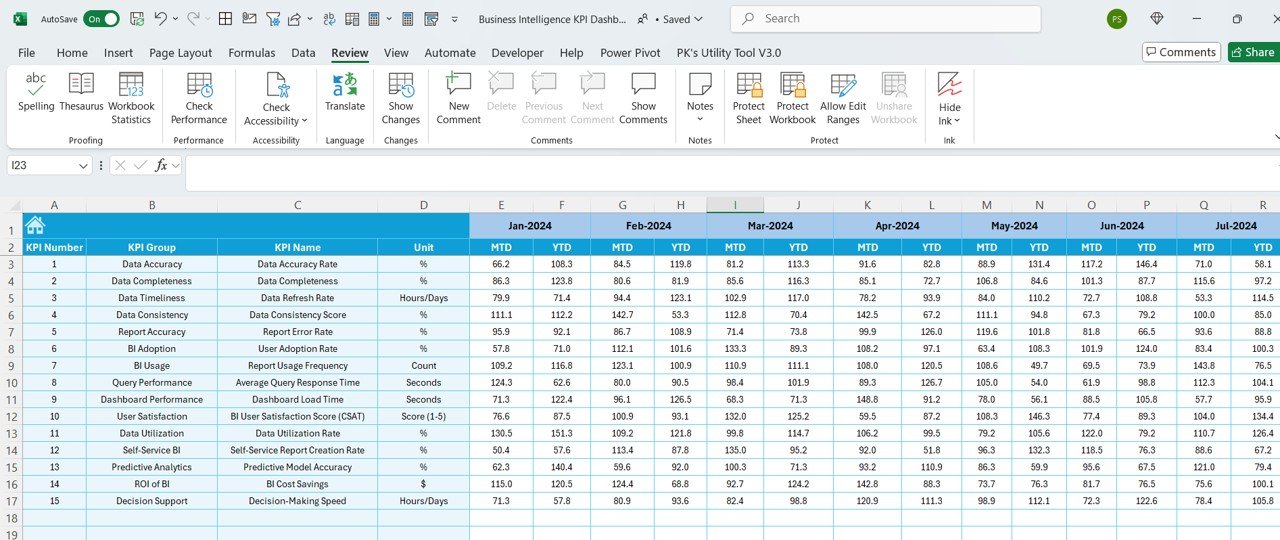
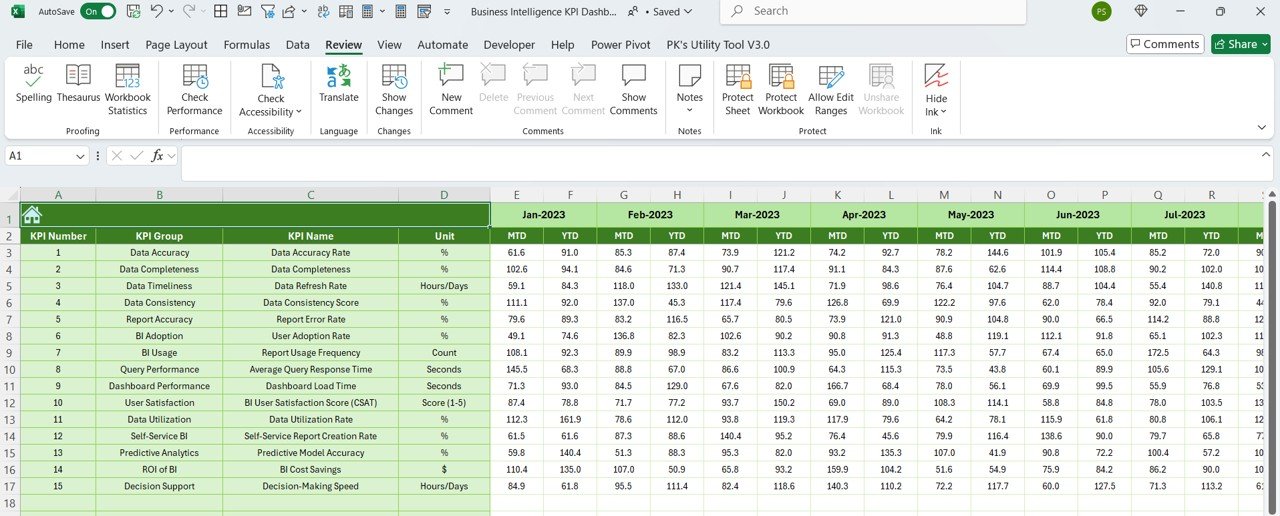
📊 Comprehensive KPI Monitoring
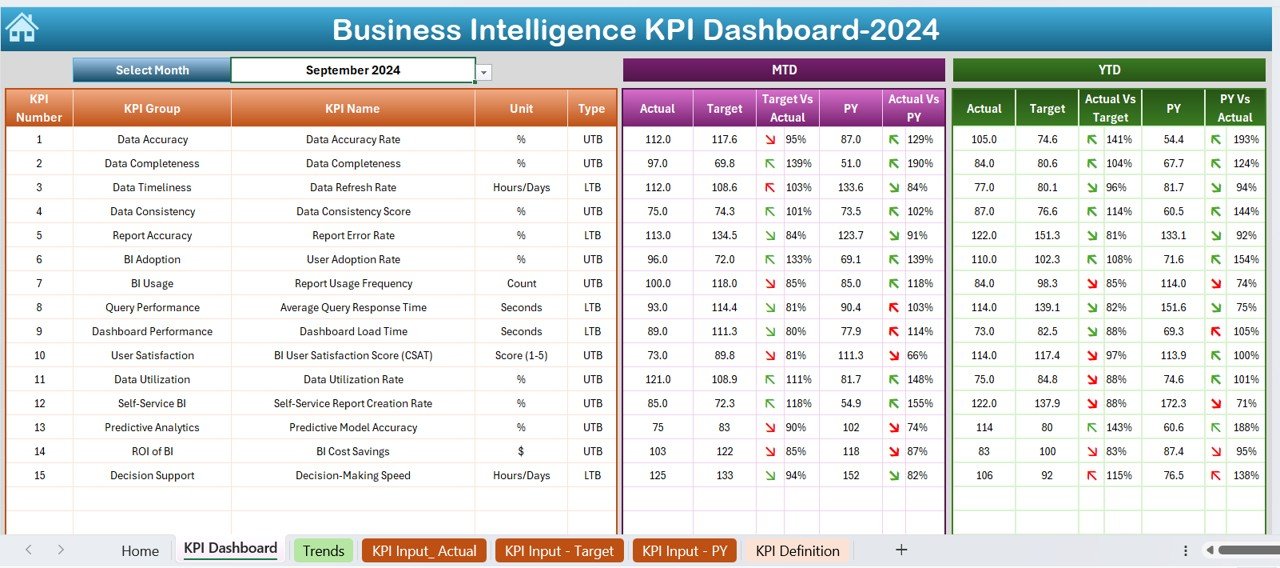
Track multiple KPIs across different business functions, such as sales performance, customer satisfaction, revenue growth, and operational efficiency. View real-time data to monitor performance and assess how well your company is meeting its goals.
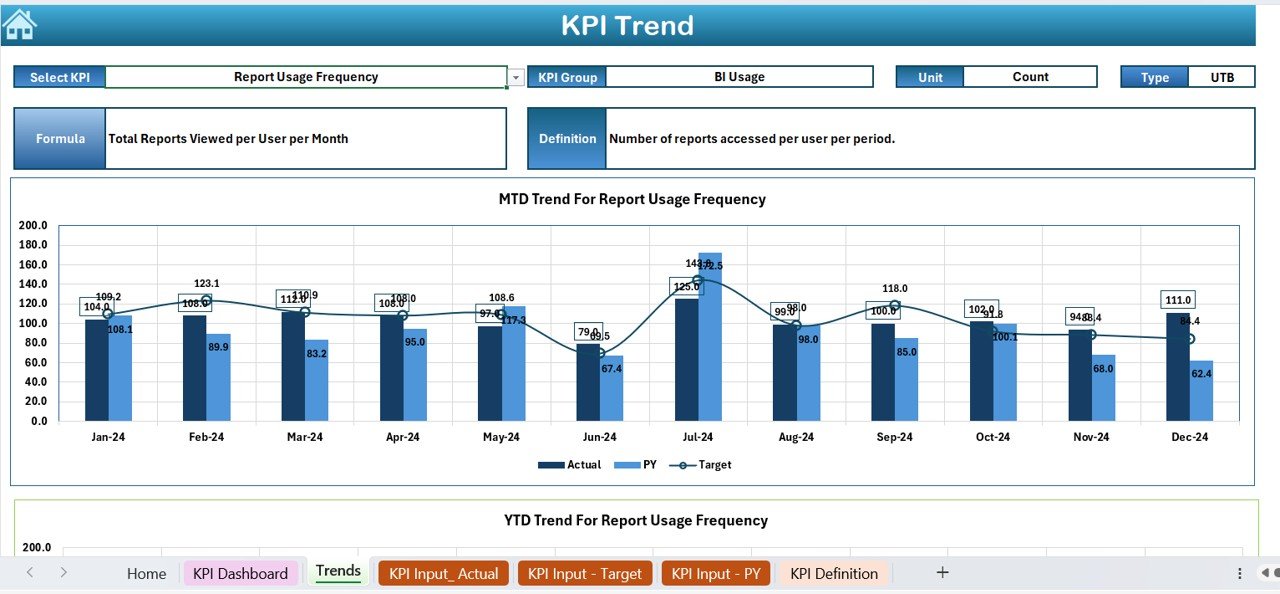
📈 Interactive Visuals & Reporting
Visualize your data with dynamic charts, graphs, and tables. Customize the visuals to display trends, comparisons, and performance metrics, making it easier to interpret and present your business performance.
📅 Real-Time Performance Tracking
Track your business performance in real time. The dashboard is automatically updated as you input new data, ensuring you have up-to-date insights for quick decision-making.
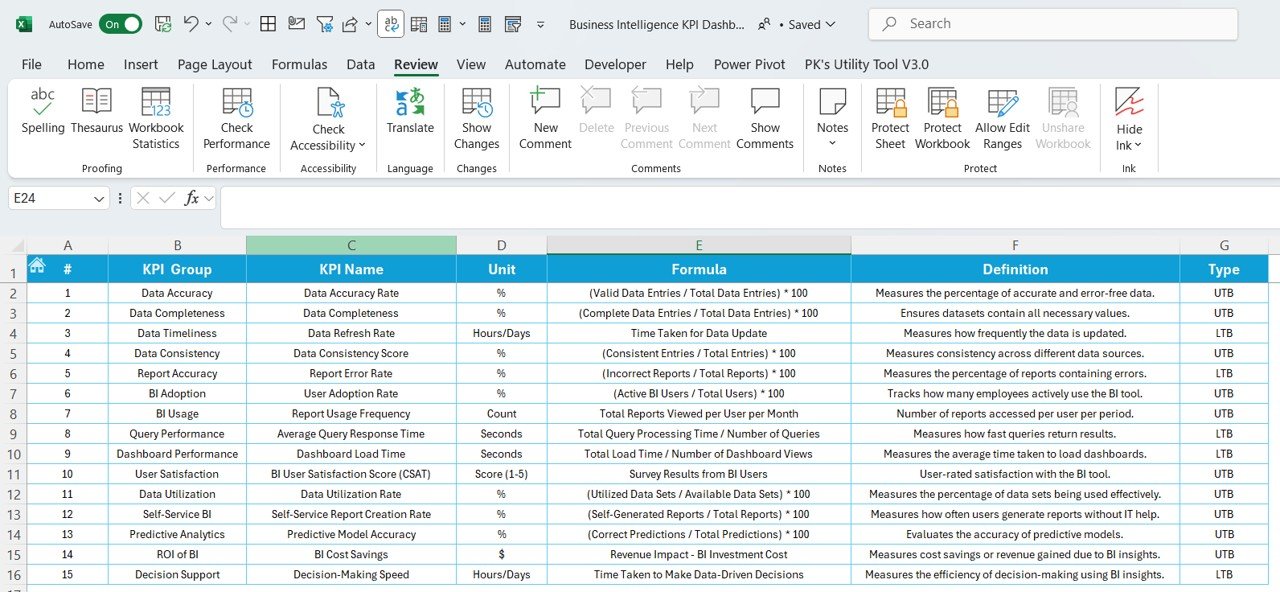
⚙️ Customizable KPIs & Metrics
Adapt the dashboard to fit your business needs by customizing KPIs and metrics. Add, remove, or modify metrics such as sales revenue, customer retention rates, or employee productivity to suit your specific business goals.
📊 Time-Based Analysis & Trends
Analyze business performance over time, whether weekly, monthly, quarterly, or yearly. Track trends, identify patterns, and make informed decisions to adjust strategies and achieve better results.
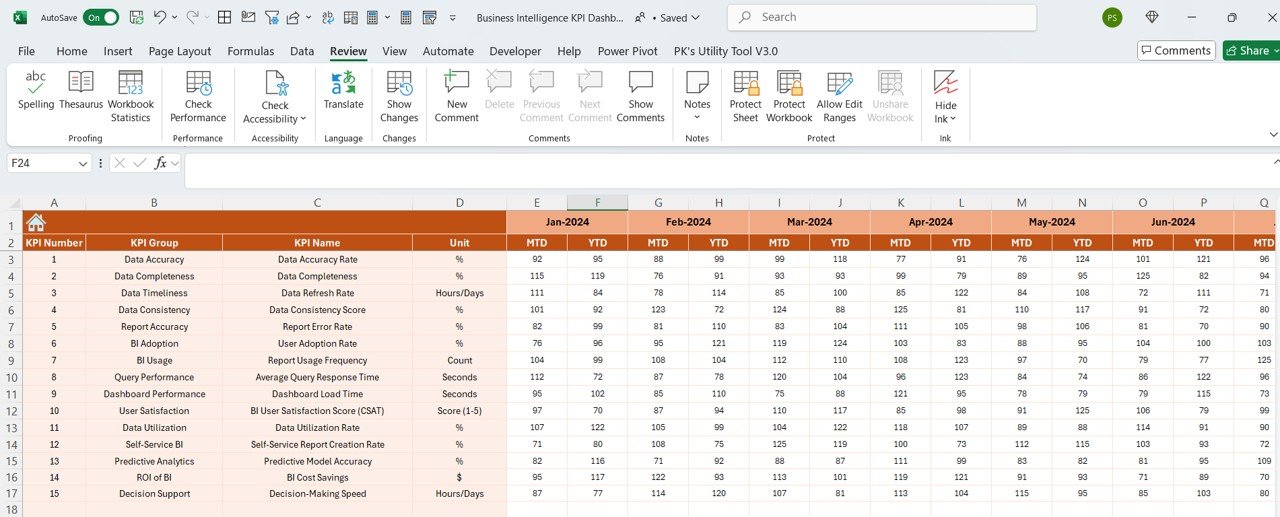
🔄 Data Integration & Analysis
Easily integrate data from various sources and monitor key business performance indicators all in one place. Analyze how different functions impact overall business performance.
Why You’ll Love the Business Intelligence KPI Dashboard in Excel

✅ Centralized Business Performance Tracking
Bring together your business data into one easy-to-use dashboard. Monitor key metrics in real time to stay on top of performance across all business functions.
✅ Data-Driven Insights
Utilize the dashboard to generate actionable insights from your business data. Identify opportunities for growth, improvement, and optimization.
✅ Visualize Business Trends
Track business trends and performance patterns over time. Make informed decisions based on clear and concise visual reports.
✅ Improve Decision-Making
With real-time updates and detailed reports, make data-driven decisions to improve business operations, maximize profits, and achieve strategic goals.
✅ Customizable to Your Needs
Tailor the dashboard to meet the unique requirements of your business. Modify KPIs, data points, and visuals to reflect your company’s specific goals and objectives.
What’s Inside the Business Intelligence KPI Dashboard in Excel?
- KPI Monitoring: Track key performance metrics across different business functions.
- Dynamic Visuals: Visualize data trends and comparisons with charts, graphs, and tables.
- Real-Time Data Tracking: Get updated business performance data with automatic syncing.
- Customizable Metrics: Adjust KPIs and metrics to suit your business needs.
- Time-Based Performance Analysis: Analyze data over different periods to track progress and identify trends.
- Data Integration: Bring together data from multiple sources for comprehensive performance analysis.
How to Use the Business Intelligence KPI Dashboard in Excel
1️⃣ Download the Template: Instantly access the Business Intelligence KPI Dashboard in Excel.
2️⃣ Set Up KPIs & Metrics: Input your business metrics and customize the dashboard with relevant KPIs.
3️⃣ Track Real-Time Performance: Input data regularly and track your performance in real time.
4️⃣ Visualize Results: Use charts and graphs to visualize performance trends and compare metrics.
5️⃣ Make Data-Driven Decisions: Analyze performance data to optimize strategies and improve overall business outcomes.
Who Can Benefit from the Business Intelligence KPI Dashboard in Excel?
🔹 Business Executives & Managers
🔹 Marketing Teams & Sales Leaders
🔹 Finance & Operations Managers
🔹 Small & Medium Enterprises (SMEs)
🔹 Large Corporations & Enterprises
🔹 Data Analysts & Business Analysts
🔹 E-commerce & Online Businesses
Maximize your business performance and make better decisions with the Business Intelligence KPI Dashboard in Excel. Track your key metrics, visualize trends, and analyze real-time data to optimize your business strategies.
Click here to read the Detailed blog post
Visit our YouTube channel to learn step-by-step video tutorials
Youtube.com/@PKAnExcelExpert


Reviews
There are no reviews yet.