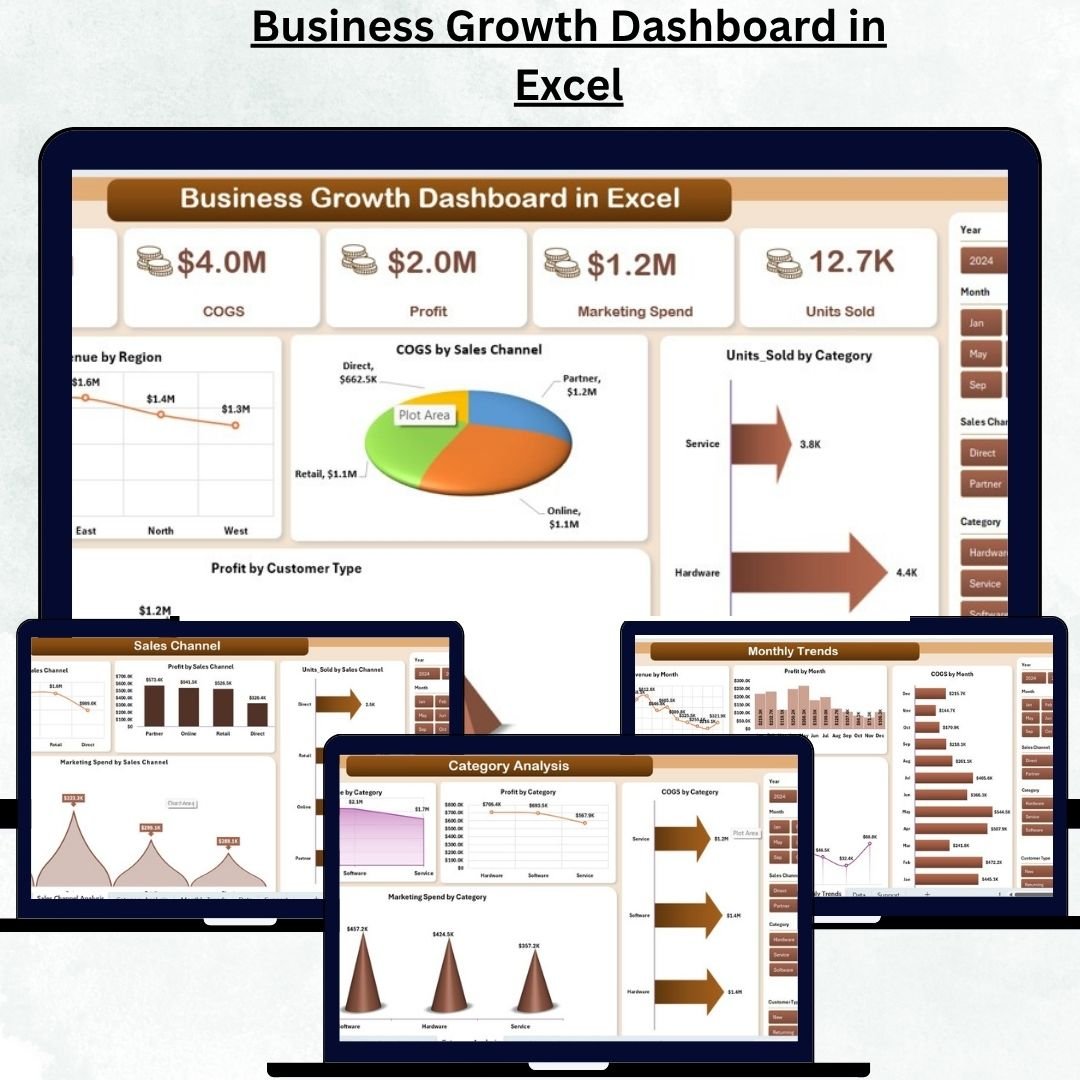
Every successful business thrives on insights — not assumptions. The Business Growth Dashboard in Excel is a ready-to-use, data-driven tool that helps you monitor revenue, profit, marketing spend, and operational efficiency in one interactive Excel file. Designed for entrepreneurs, analysts, and business leaders, this dashboard transforms raw data into clear visual stories that highlight your company’s true growth performance.Business Growth Dashboard in Excel
Unlike traditional spreadsheets, this dashboard features interactive cards, slicers, and trend charts — allowing you to explore growth metrics in real time. Whether you’re tracking monthly sales, regional revenue, or marketing ROI, this Excel dashboard provides everything you need to make faster, smarter decisions.Business Growth Dashboard in Excel
✨ Key Features of Business Growth Dashboard in Excel
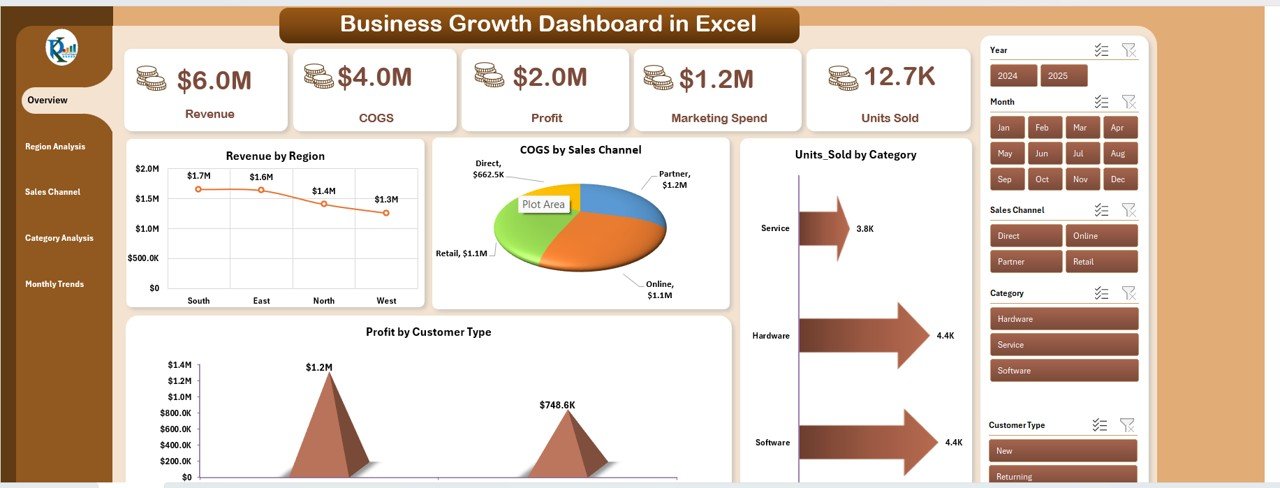
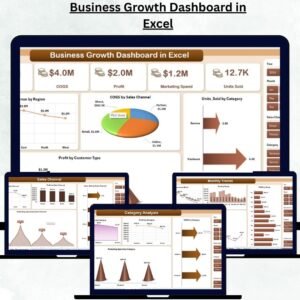
📊 Comprehensive Overview Page – View top KPIs like Revenue, COGS, Profit, Marketing Spend, and Units Sold in one clean layout. Each KPI card updates instantly as data changes.
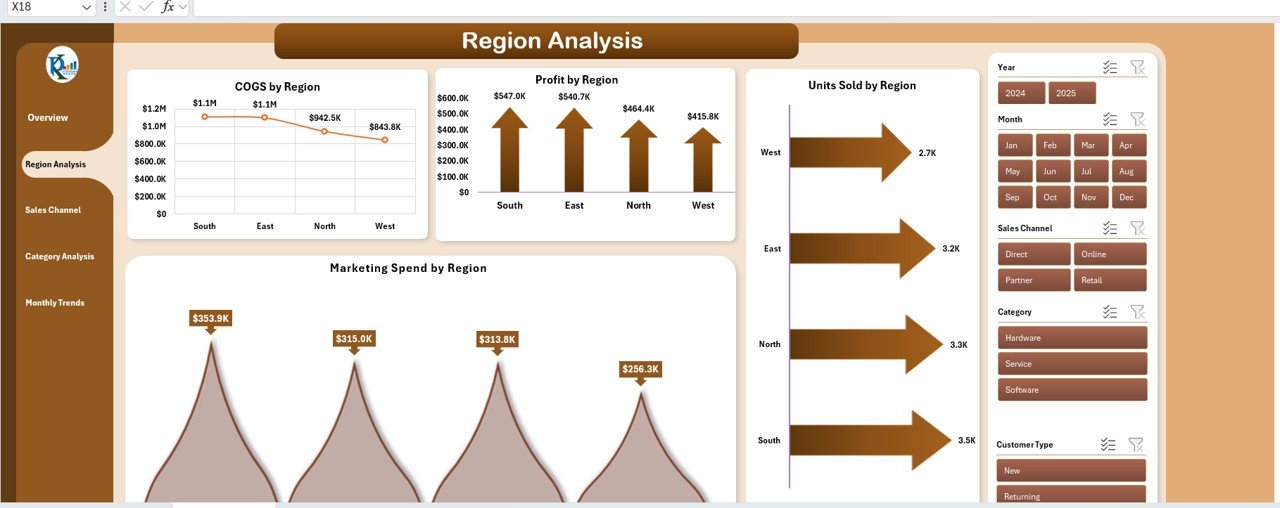
🌍 Region Analysis – Identify which regions perform best by tracking Revenue, Marketing Spend, and Units Sold by Region. Discover cost-impact trends across departments to optimize regional strategies.
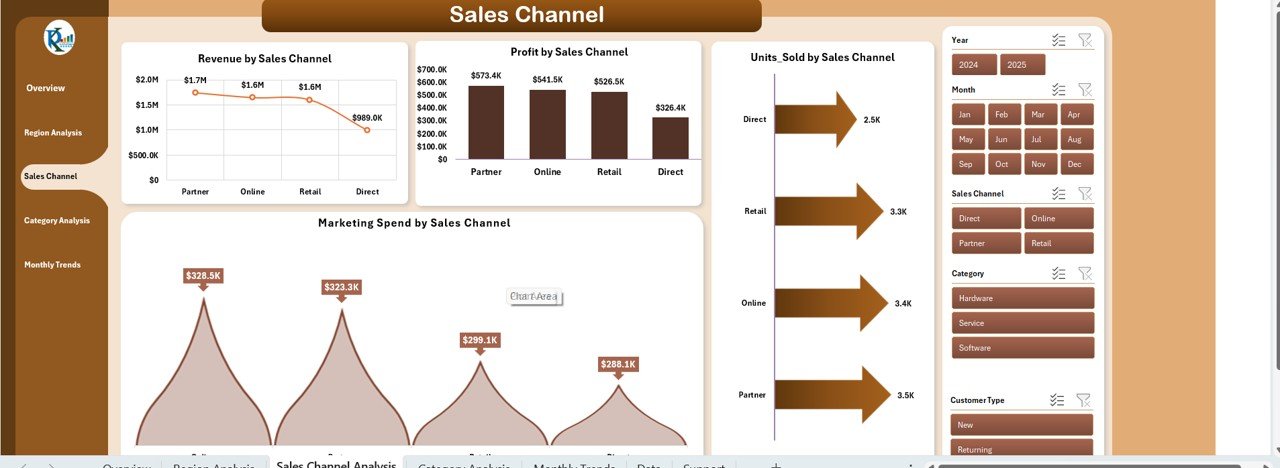
🛒 Sales Channel Insights – Compare Revenue and Profitability across online, retail, distributor, and direct channels. Evaluate marketing efficiency per channel for better investment planning.
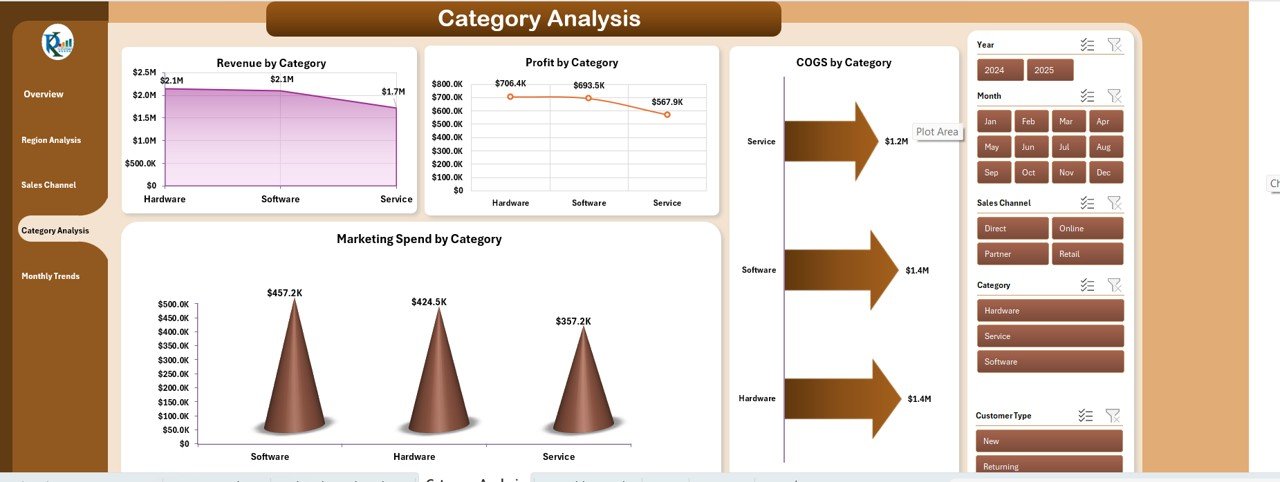
📦 Category Performance – Monitor Revenue, COGS, and Marketing Spend by Category to spot high-profit or cost-intensive segments.
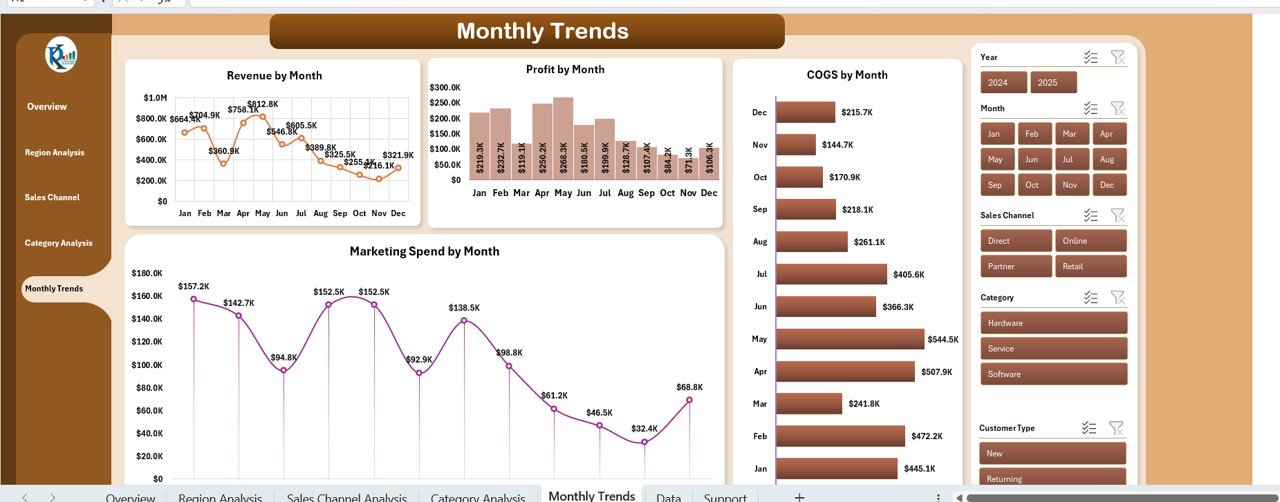
📅 Monthly Trends Visualization – Analyze Revenue, Profit, and Marketing Spend by Month for seasonality and forecasting.
⚙️ Automated Calculations – Built with pivot tables and Excel formulas, ensuring live updates without manual work.
📈 Customizable KPIs – Add or modify metrics such as ROI, Conversion Rate, or Customer Lifetime Value to suit your unique business model.
🔍 Interactive Slicers – Filter by month, category, or region for instant insights.
📂 What’s Inside the Business Growth Dashboard in Excel
This dashboard includes multiple analytical tabs designed for comprehensive performance monitoring:
1️⃣ Overview Sheet – The main control panel showing five key KPI cards and interactive charts such as Revenue by Region, Profit by Customer Type, and Units Sold by Category.
2️⃣ Region Analysis Sheet – Detailed comparison of regional performance and departmental cost impact.
3️⃣ Sales Channel Analysis Sheet – Evaluate the contribution of each channel and identify high-ROI sales modes.
4️⃣ Category Analysis Sheet – Track category-wise performance, comparing revenue, cost, and ad spend.
5️⃣ Monthly Trends Sheet – Month-over-month trend charts help you visualize patterns and predict future growth.
6️⃣ Data Sheet – The foundation of the dashboard where you input your raw data like sales, cost, and marketing figures.
Each sheet is carefully linked, ensuring seamless automation — once you update data in the Data Sheet, the entire dashboard refreshes automatically.
🧭 How to Use the Business Growth Dashboard in Excel
1️⃣ Enter your data in the Data Sheet tab. Include your monthly sales, expenses, marketing costs, and customer details.
2️⃣ Refresh pivot tables using the refresh button or right-click command.
3️⃣ Select filters and slicers (month, region, or channel) to focus on specific areas.
4️⃣ Analyze visuals on Overview, Region, and Category pages for performance insights.
5️⃣ Customize KPIs if needed to match your business requirements — Excel formulas are editable.
You don’t need advanced Excel skills; everything is pre-built and automated for you!
👥 Who Can Benefit from This Business Growth Dashboard in Excel
💼 Business Owners & Entrepreneurs – Track your company’s performance and identify profitable areas effortlessly.
📊 Financial Analysts – Get precise insights into cost, revenue, and margin trends.
📣 Marketing Managers – Measure marketing ROI, customer reach, and conversion results.
🏢 Corporate Executives – Review real-time business performance in a visually engaging format.
💡 Consultants & Startups – Use it as a powerful reporting and decision-making tool for clients or investors.
This dashboard is not just a report — it’s your business growth command center!


Reviews
There are no reviews yet.