Budget control is the backbone of financial stability. However, when budgets are managed using scattered spreadsheets, manual calculations, and static reports, overspending often goes unnoticed until it becomes a serious problem.
That is exactly where the Budget Performance Dashboard in Google Sheets delivers real impact.
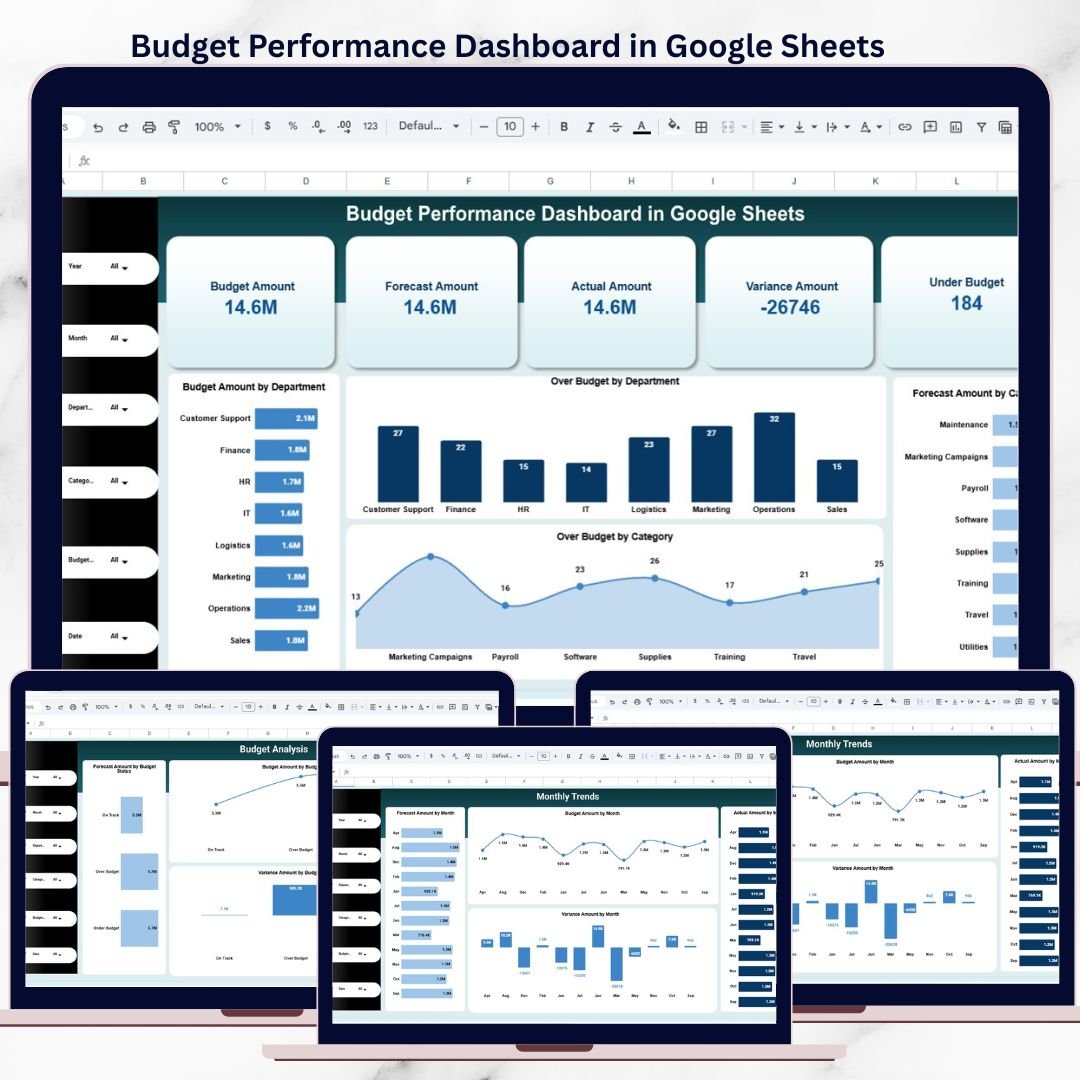
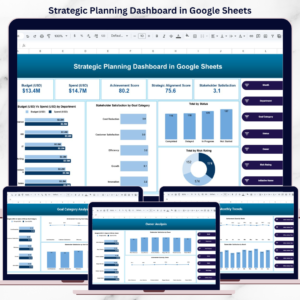
This ready-to-use Google Sheets dashboard helps finance and business teams track budget, forecast, actual spending, and variance in one interactive view. Instead of reacting late to budget issues, teams gain real-time visibility and take proactive financial decisions with confidence.
Built entirely in Google Sheets, this dashboard combines powerful financial KPIs, dynamic charts, filters, and trend analysis—without requiring expensive BI tools or technical expertise.
⭐ Key Features of Budget Performance Dashboard in Google Sheets
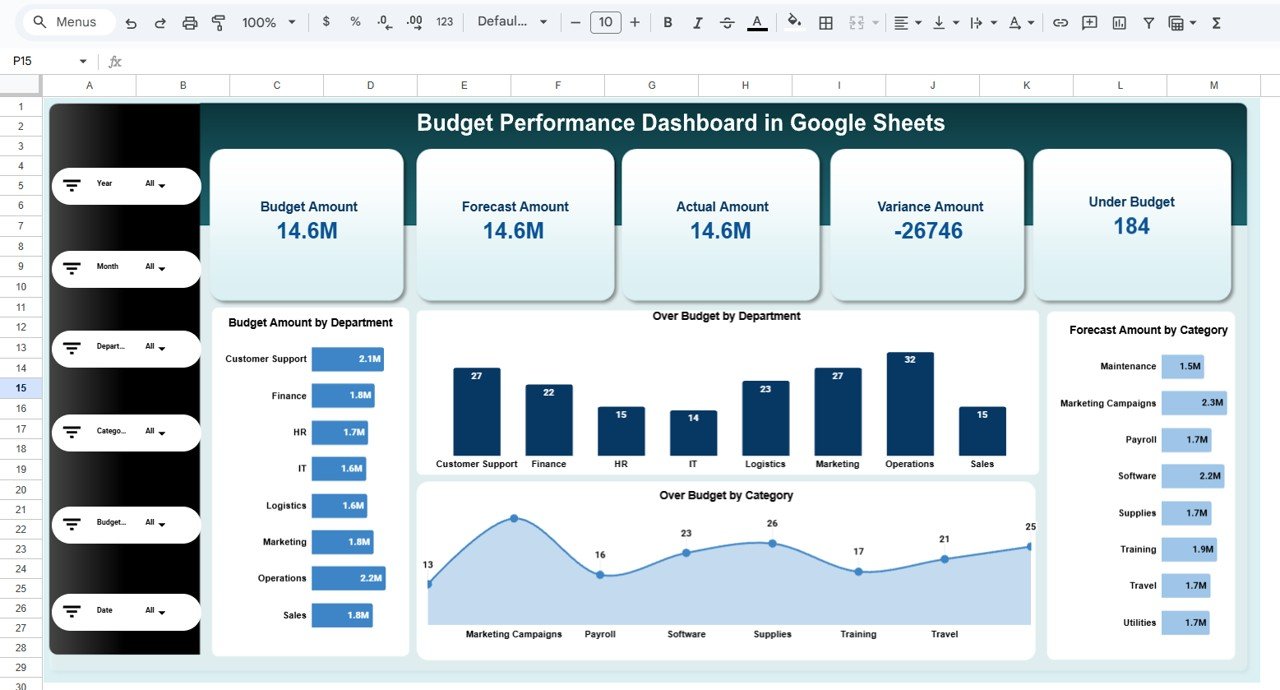
📊 Interactive Budget KPI Dashboard
Track Budget, Forecast, Actual, and Variance with live KPI cards.
📅 Dynamic Filters & Slicers
Analyze budget performance by Year, Month, Department, Category, Budget Status, and Date.
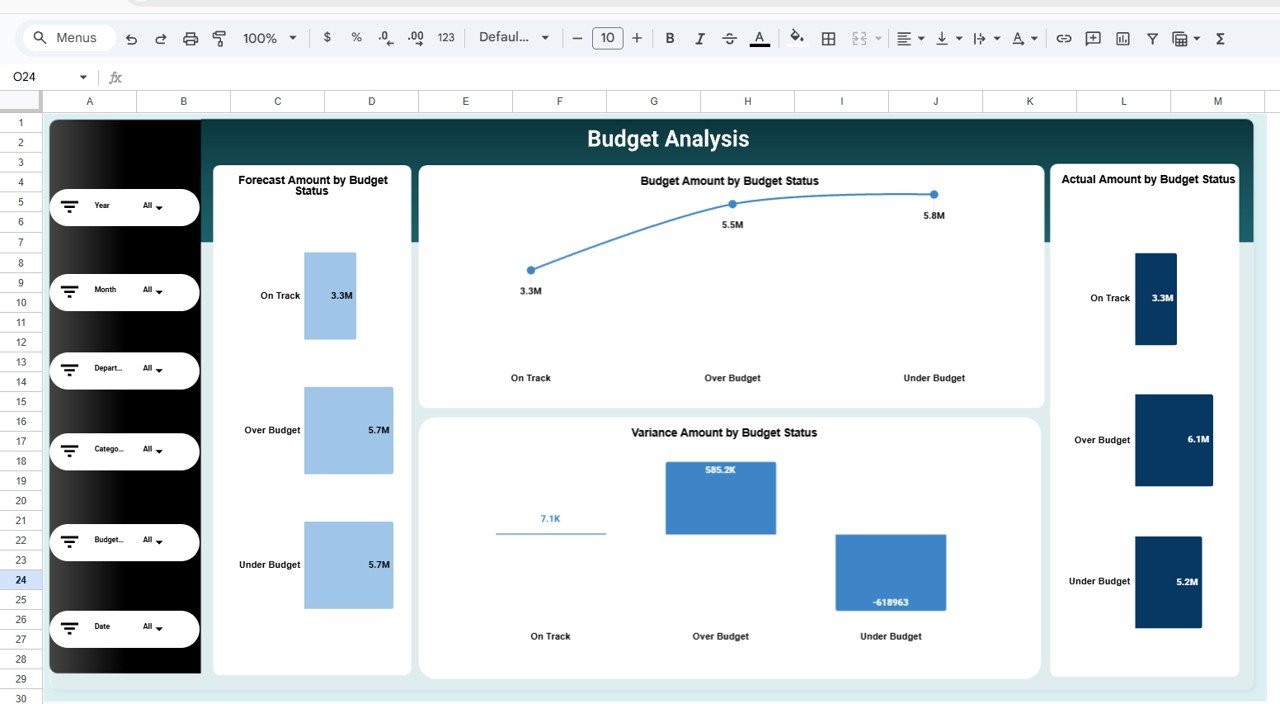
📈 Variance & Budget Status Tracking
Instantly identify Over Budget, Under Budget, and On-Track areas.
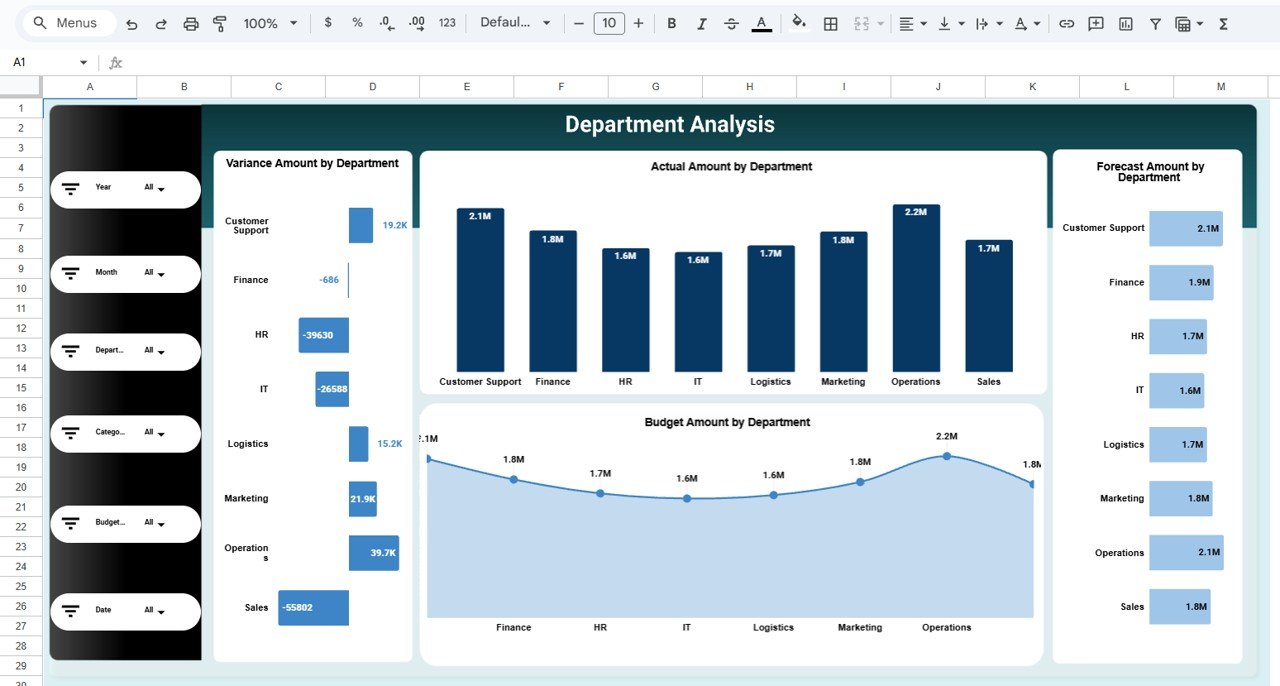
🏢 Department-Wise Budget Analysis
Monitor spending accountability across departments.
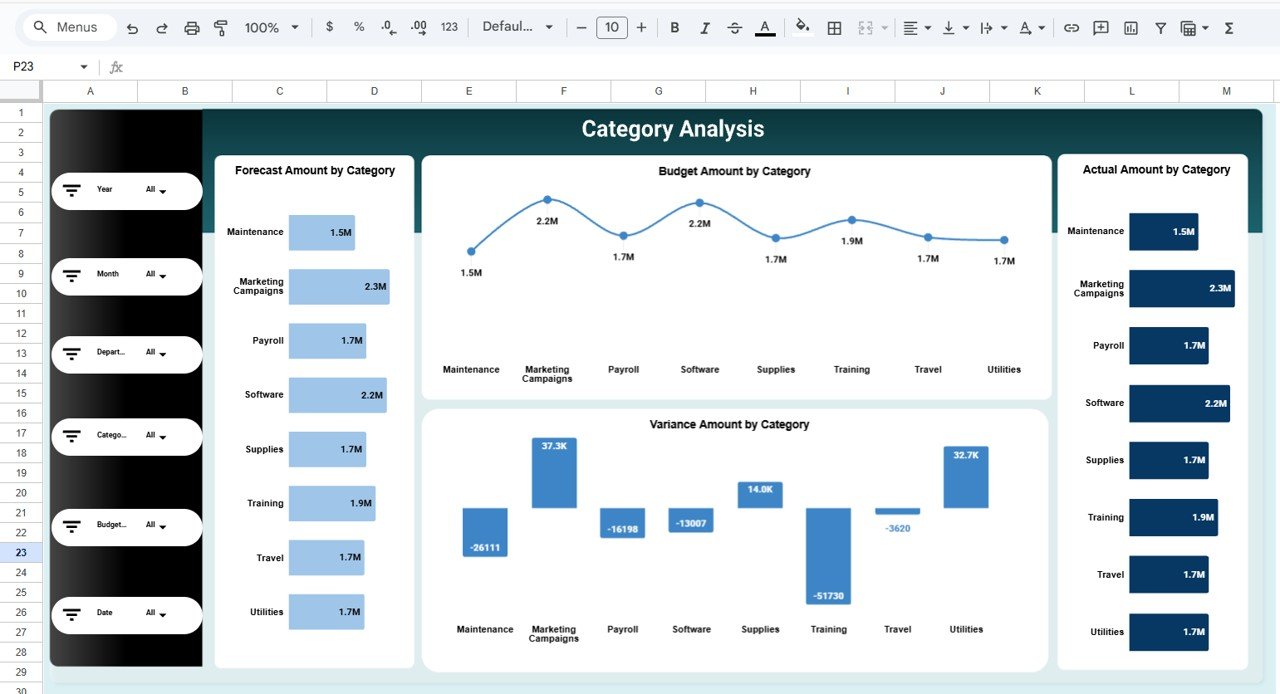
📂 Category-Level Cost Insights
Understand which expense categories drive overspending or savings.
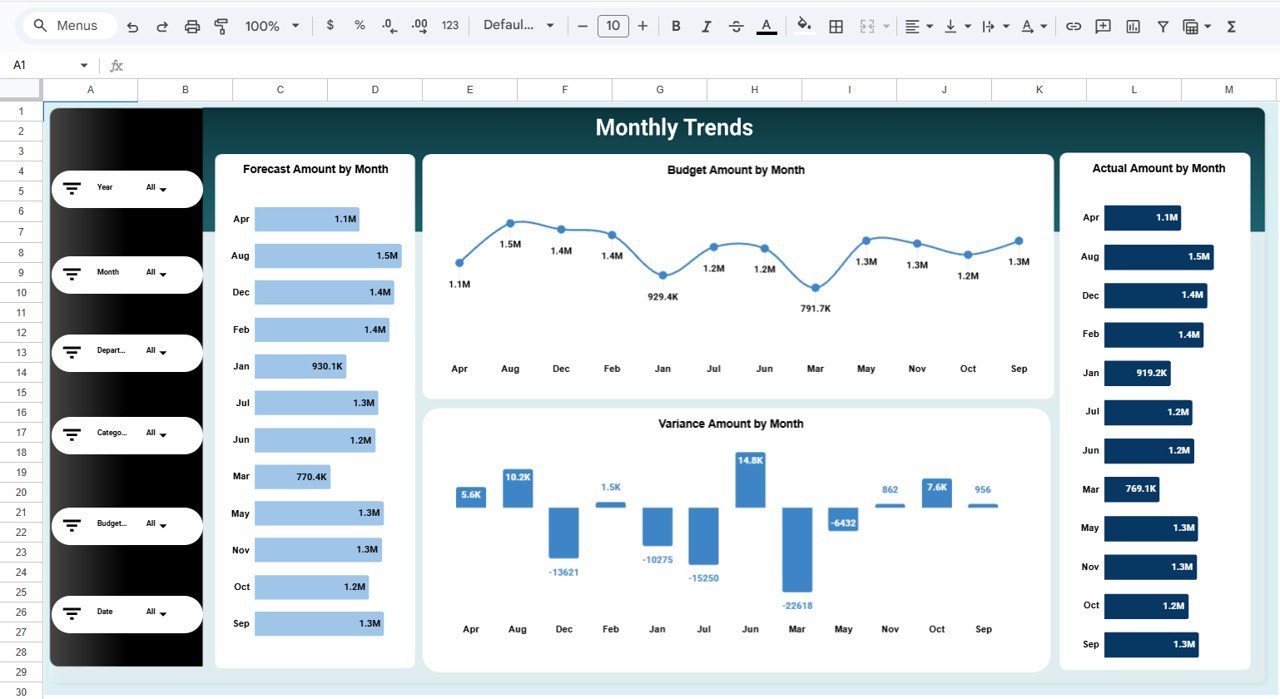
📉 Monthly Trend Analysis
Track budget, forecast, actual, and variance trends over time.
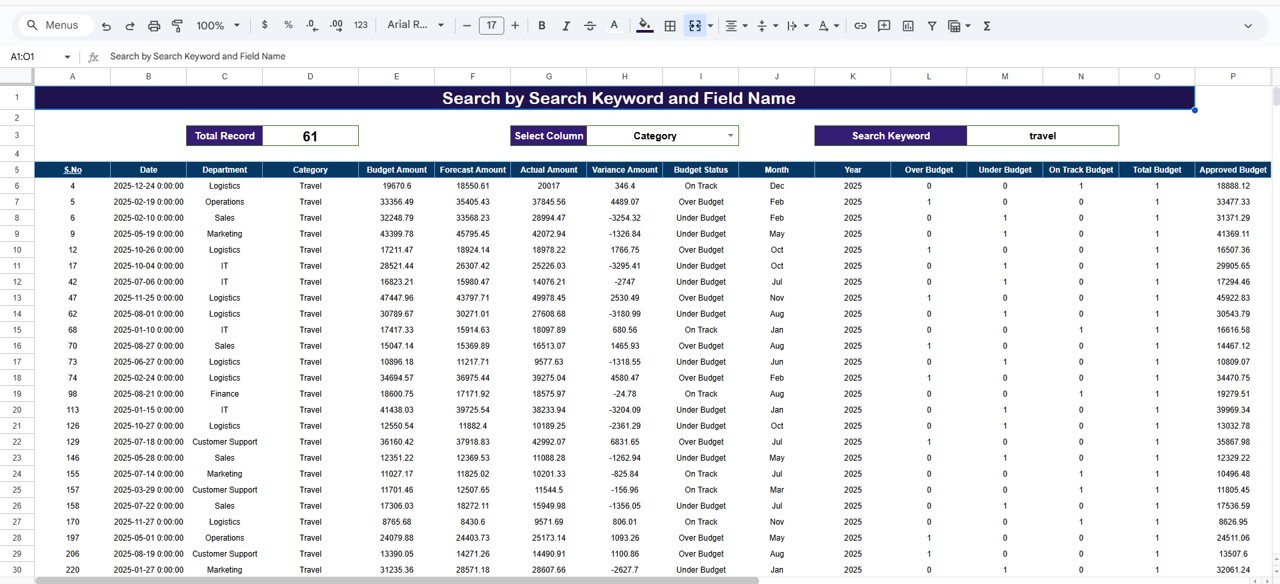
🔎 Search & Drill-Down Capability
Find transactions quickly using keyword-based search.
☁️ Built in Google Sheets
Real-time collaboration, cloud access, and easy sharing.
📦 What’s Inside the Budget Performance Dashboard in Google Sheets?
This dashboard includes multiple analytical pages, each designed for deep financial insights:
📌 Budget Performance Overview Page
High-level snapshot of budget health with KPI cards and charts.
📌 Category Analysis Page
Budget, Forecast, Actual, and Variance by expense category.
📌 Department Analysis Page
Financial performance comparison across departments.
📌 Budget Status Analysis Page
Clear view of On-Track, Over Budget, and Under Budget areas.
📌 Monthly Trends Page
Time-based analysis to identify seasonal spending patterns.
📌 Search & Data Sheet
Keyword search, detailed records, approval tracking, and audit support.
Together, these pages form a complete budget monitoring and analysis system.
🛠️ How to Use the Budget Performance Dashboard in Google Sheets
Using this dashboard is simple and intuitive:
1️⃣ Enter budget, forecast, and actual data in the data sheet
2️⃣ Use built-in formulas and pivots for automatic calculations
3️⃣ Apply filters to analyze specific departments or categories
4️⃣ Review KPI cards, charts, and trends
5️⃣ Identify risks early and take corrective action
Because everything updates dynamically, no manual recalculation is required.
👥 Who Can Benefit from This Budget Performance Dashboard?
This dashboard is ideal for:
💼 Finance Teams & Accountants
📊 FP&A Professionals
🏢 Department Heads
👨💼 Business Managers
📋 Operations & Cost Control Teams
🏛️ Startups, SMEs & Enterprises
Whether you manage a small departmental budget or a large organizational budget, this dashboard adapts easily.
🚀 Why This Budget Performance Dashboard Is a Must-Have
✔ Improves budget visibility instantly
✔ Prevents budget overruns proactively
✔ Saves hours of manual reporting
✔ Enhances financial transparency
✔ Supports faster and smarter decisions
✔ No costly BI tools required
This dashboard turns Google Sheets into a powerful budget intelligence tool.
🔗 Click here to read the Detailed blog post
Watch the step-by-step video tutorial:
📺 Visit our YouTube channel to learn step-by-step video tutorials and dashboard walkthroughs.


Reviews
There are no reviews yet.