Unlock the full potential of neuroscience and AI data with the Brain-Computer Interfaces Dashboard in Power BI 🚀. In today’s rapidly evolving tech landscape, BCI systems generate massive volumes of complex data—from signal accuracy to latency and device performance.
However, without the right tools, this data becomes overwhelming.
That’s where this interactive and ready-to-use Power BI dashboard becomes a game-changer.
It transforms raw BCI data into real-time insights, dynamic visuals, and actionable KPIs, helping you monitor performance, optimize systems, and make faster, data-driven decisions.
🚀 Key Feature of Brain-Computer Interfaces Dashboard in Power BI
✅ 📊 Interactive Power BI Dashboard
Visualize complex BCI datasets with dynamic charts and slicers.
✅ 📈 Real-Time KPI Monitoring
Track accuracy, latency, signal quality, and user activity.
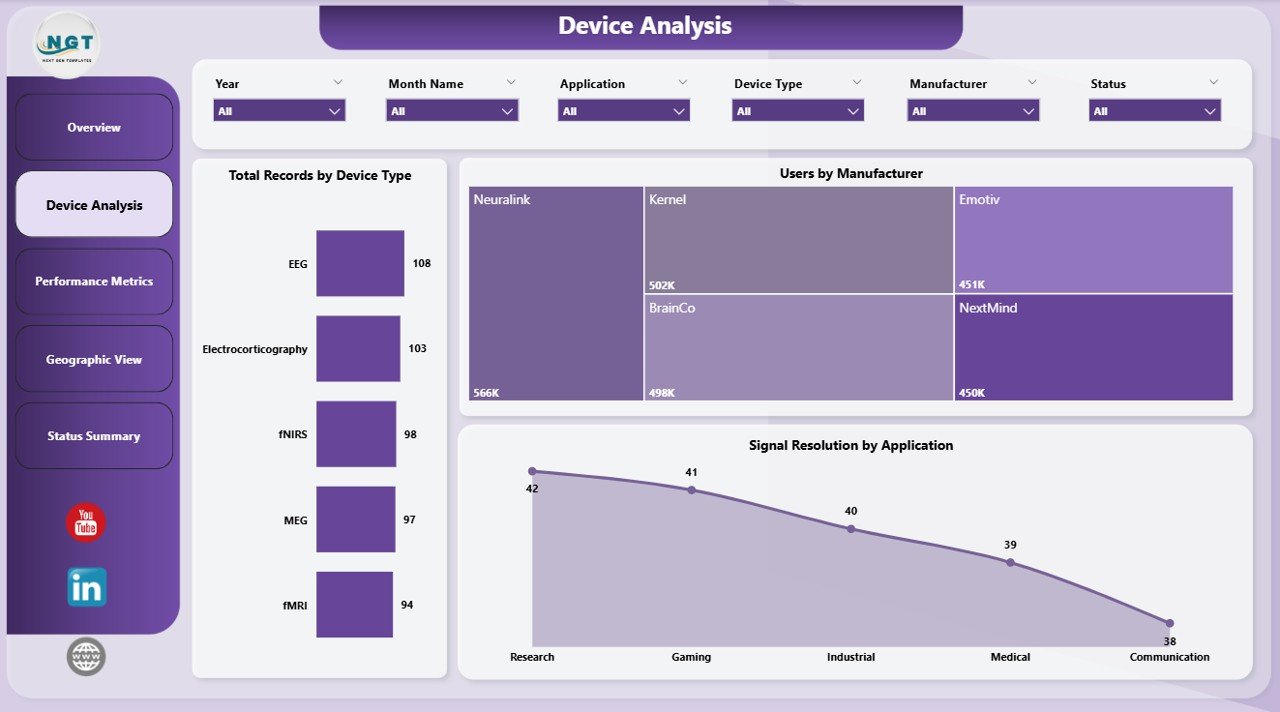
✅ 🧠 Device Performance Analysis
Compare performance across manufacturers and device types.
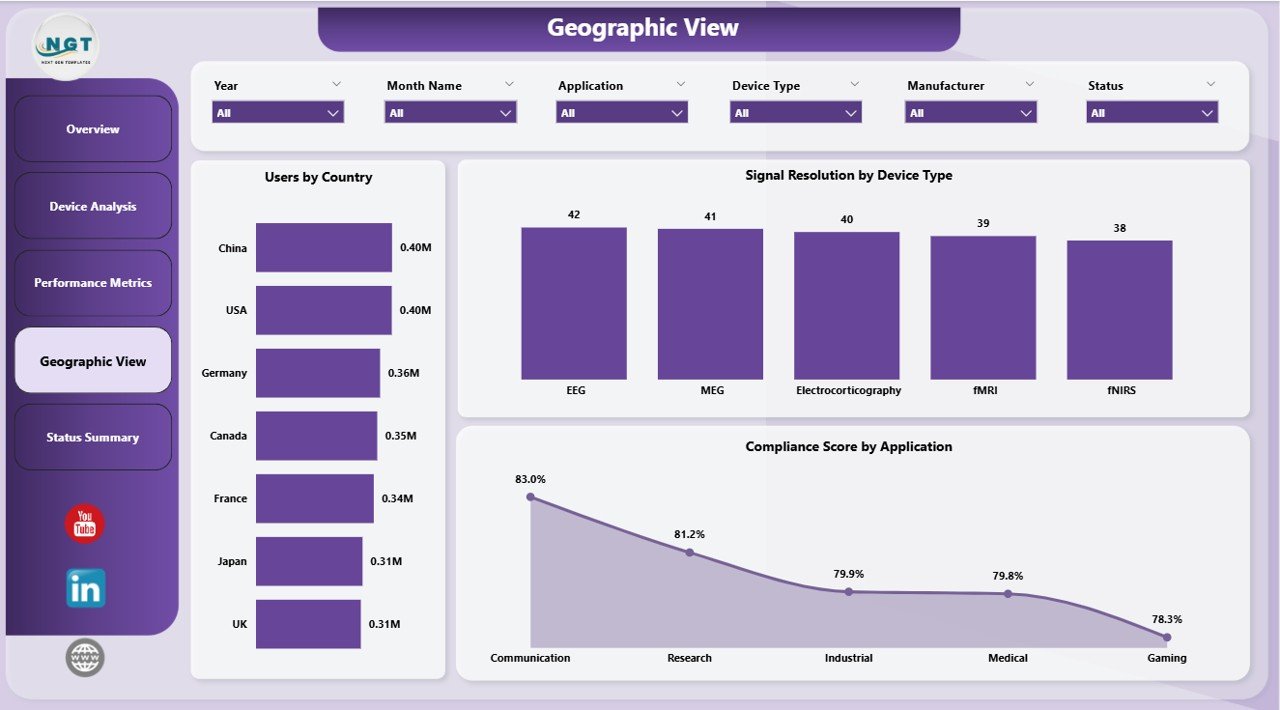
✅ 🌍 Geographic Insights
Analyze user distribution and system performance globally.
✅ ⚙️ Operational Health Monitoring
Track compliance, latency, and system status.
✅ 🔍 Advanced Filtering (Slicers)
Customize analysis based on region, device, or status.
✅ ⚡ Automated Insights & Reporting
Reduce manual effort with real-time data visualization.
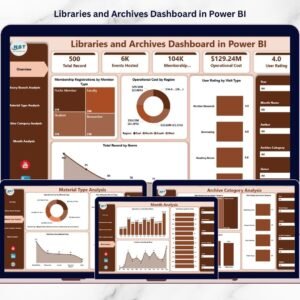
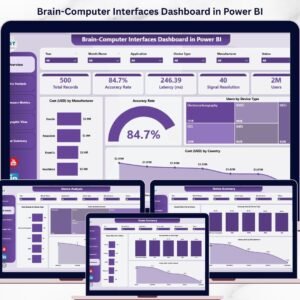
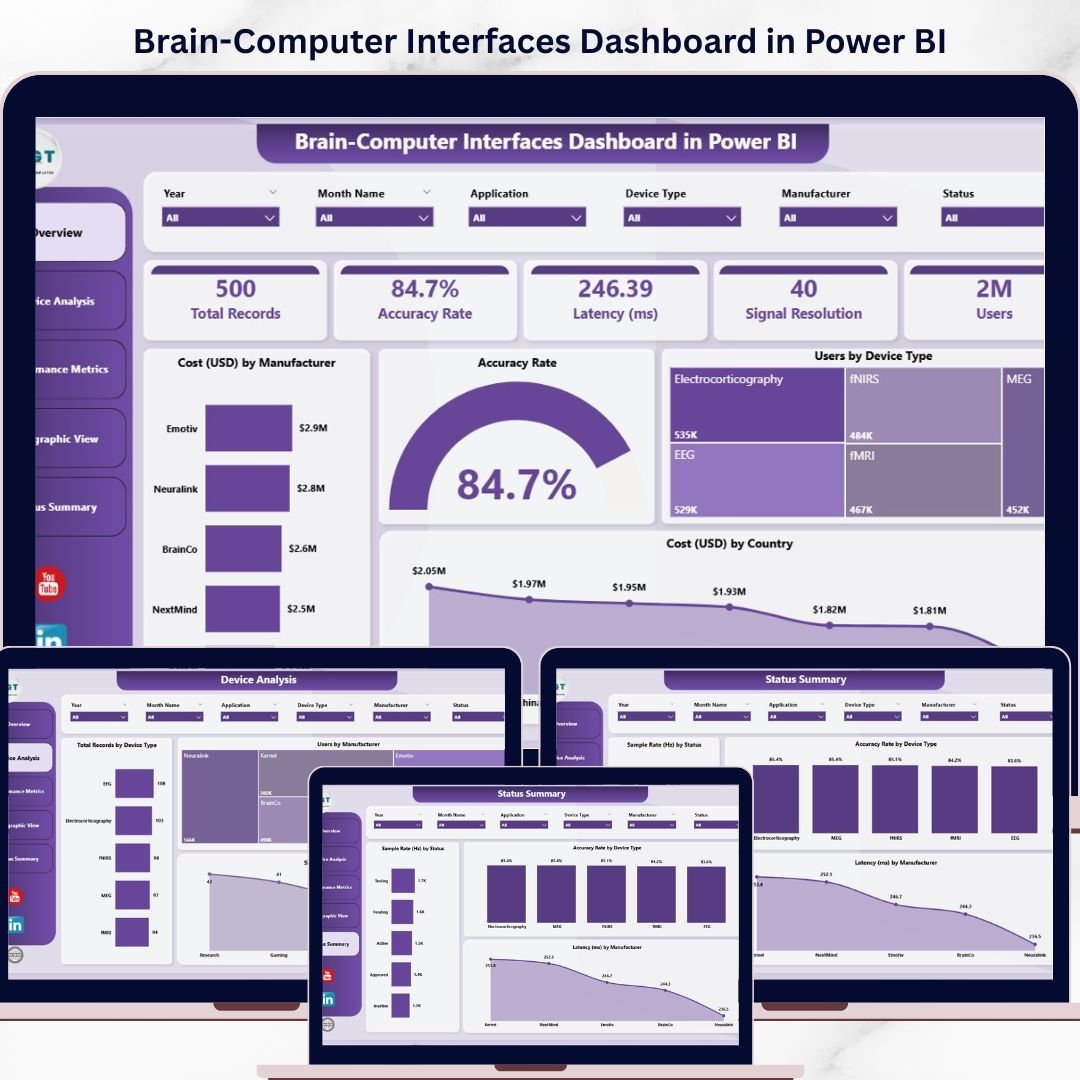
📦 What’s Inside the Brain-Computer Interfaces Dashboard in Power BI
This dashboard includes 5 powerful analytical pages:
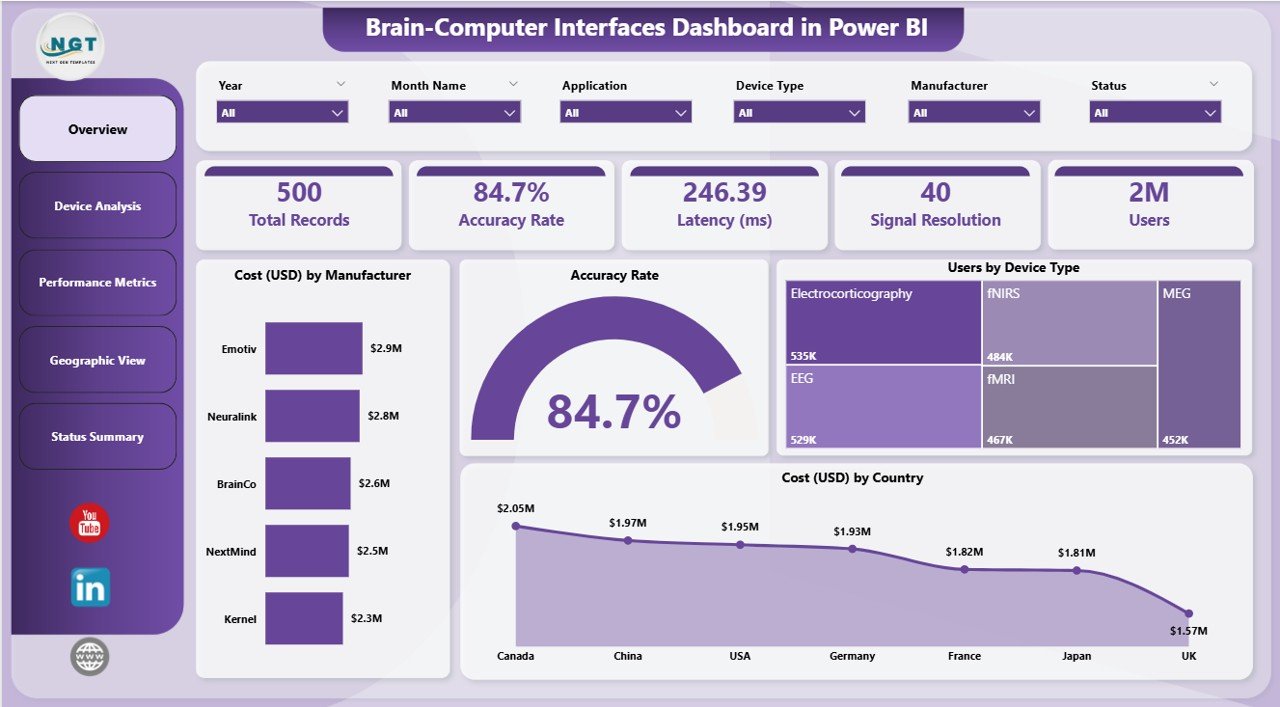
🏠 Overview Page – Snapshot of key KPIs and performance
⚙️ Device Analysis – Evaluate device-level performance
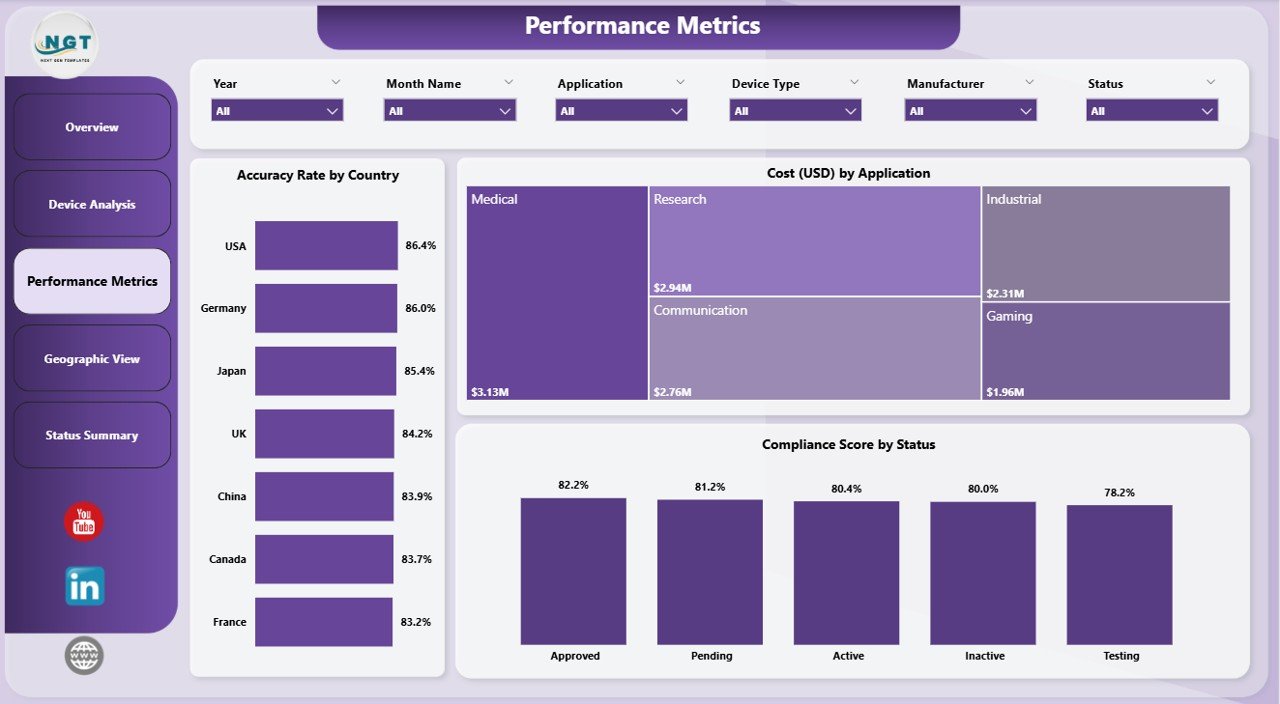
📈 Performance Metrics – Track accuracy, compliance, and costs
🌍 Geographic View – Analyze global trends and distribution
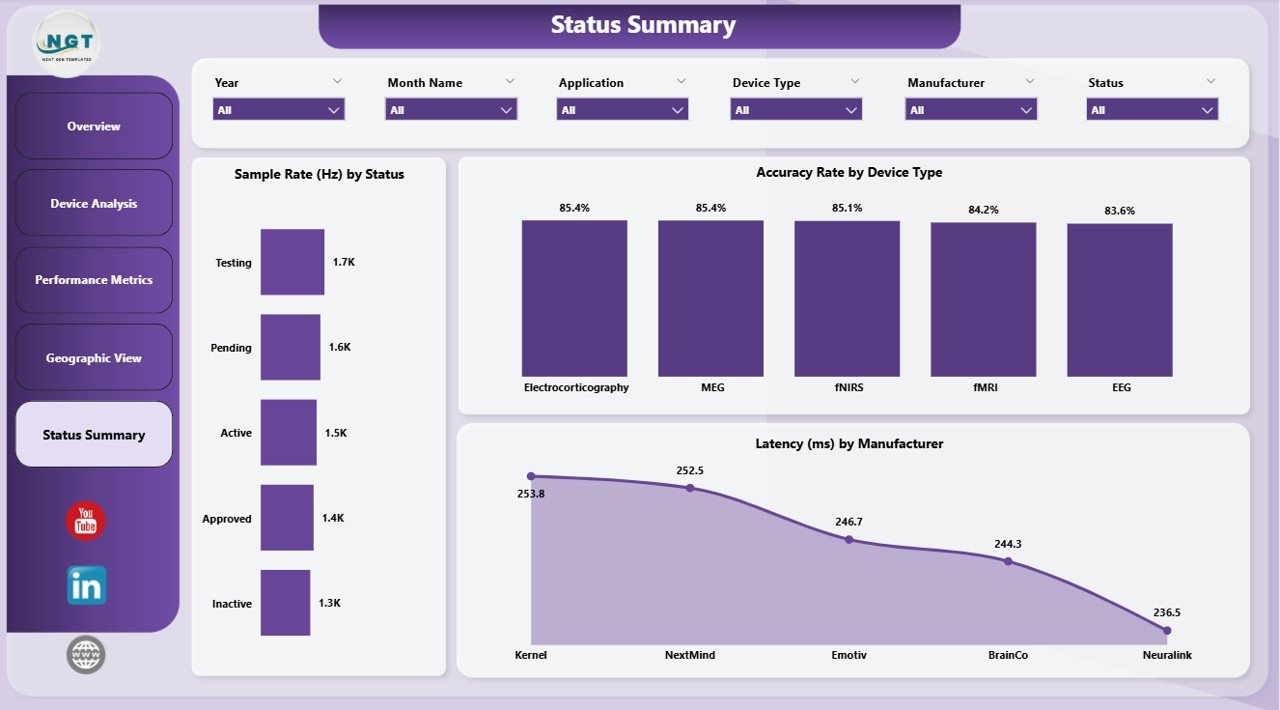
📊 Status Summary – Monitor system health and efficiency
👉 Together, these pages deliver a complete 360° view of BCI performance and analytics.
⚙️ How to Use the Brain-Computer Interfaces Dashboard in Power BI
Getting started is simple:
👉 Import your BCI dataset into Power BI
👉 Connect your data sources
👉 Use slicers to filter by device, region, or status
👉 Analyze KPI cards and charts
👉 Take data-driven actions
Within minutes, you can turn complex BCI data into powerful insights 📊.
👨💻 Who Can Benefit from This Brain-Computer Interfaces Dashboard in Power BI
This dashboard is ideal for:
🏥 Healthcare Professionals – Monitor patient-device interaction
🧪 Researchers & Scientists – Analyze neuroscience data
🤖 AI & Robotics Teams – Improve human-machine interaction
🎮 Gaming Industry Experts – Track engagement and performance
📊 Data Analysts – Generate insights and reports
👉 Anyone working in BCI, neuroscience, AI, or advanced analytics will benefit from this tool.
🔗 Click hare to read the Detailed blog post
Explore the full guide with features, benefits, and best practices.
👉 Visit our YouTube channel to learn step-by-step video tutorials:
https://youtube.com/@PKAnExcelExpert