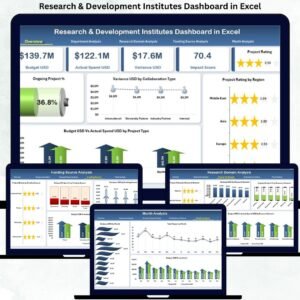


Unlock the power of advanced neuroscience data with the Brain-Computer Interfaces Dashboard in Excel 🚀. In today’s fast-evolving tech landscape, BCI systems generate massive datasets—from user activity to device performance and signal accuracy. However, managing this data manually can be overwhelming.
That’s where this ready-to-use and interactive Excel dashboard becomes a game-changer.
It transforms complex BCI data into clear visuals, actionable insights, and structured KPIs—all in one place. As a result, you can monitor performance, optimize systems, and make faster, smarter decisions with confidence.
🚀 Key Feature of Brain-Computer Interfaces Dashboard in Excel
✅ 📊 Interactive Excel Dashboard
Visualize complex BCI data with dynamic charts and slicers.
✅ 📈 Performance KPI Tracking
Monitor accuracy, latency, compliance, and user activity.
✅ 🧠 Device & Application Insights
Analyze performance across devices and use cases.
✅ 🌍 Geographic Analysis
Compare BCI performance across countries and regions.
✅ ⚙️ Operational Status Monitoring
Track system health and efficiency in real time.
✅ 🔍 Smart Filtering with Slicers
Customize insights instantly based on your needs.
✅ 📂 Structured Data Management
Separate Data and Support sheets for smooth operations.
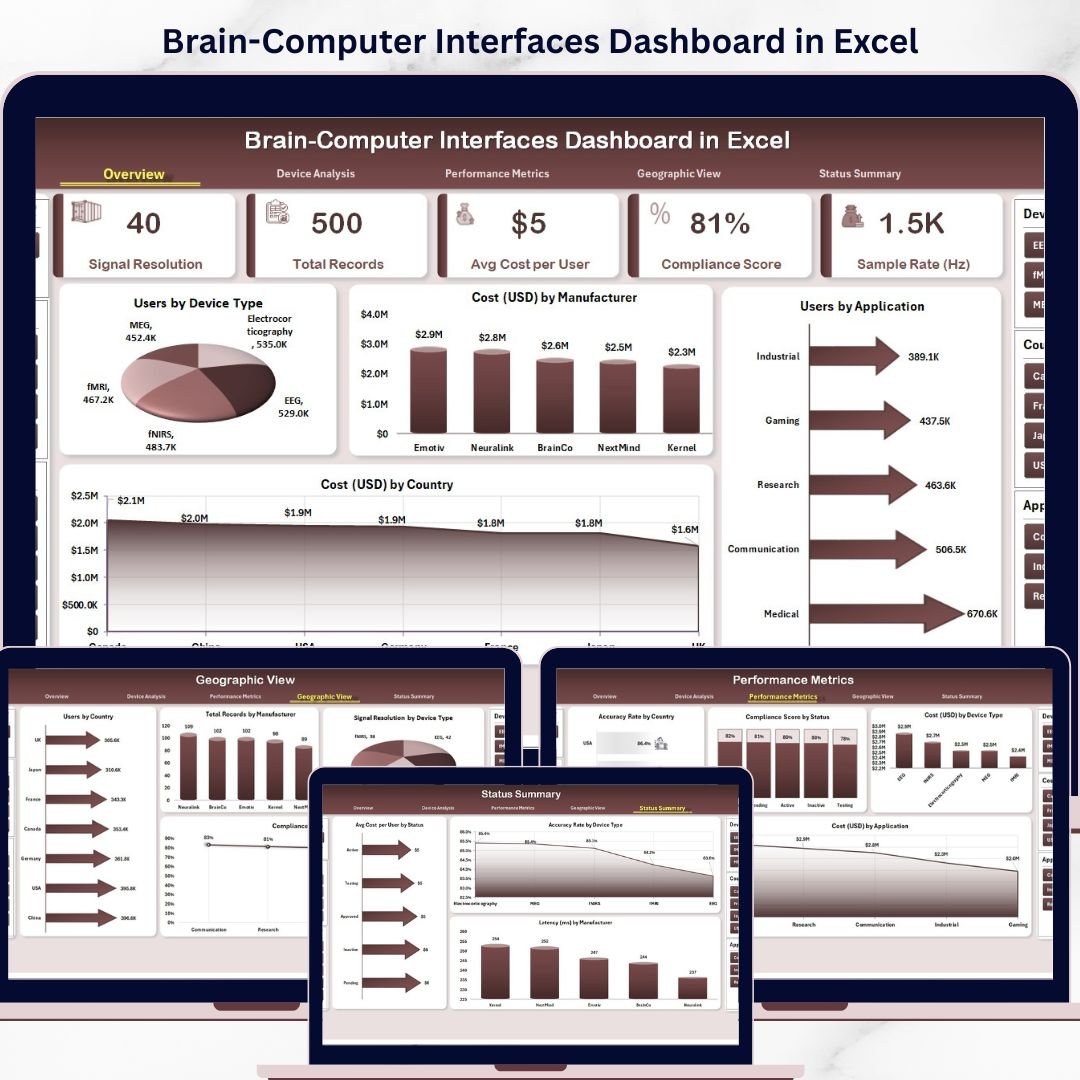
📦 What’s Inside the Brain-Computer Interfaces Dashboard in Excel
This dashboard includes 5 powerful analytical pages:
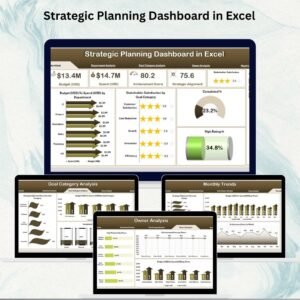
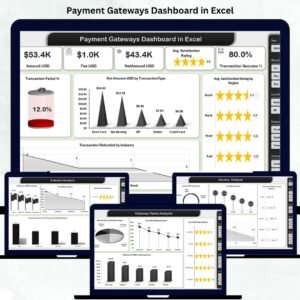
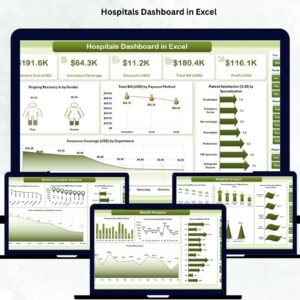
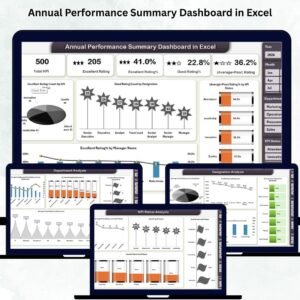
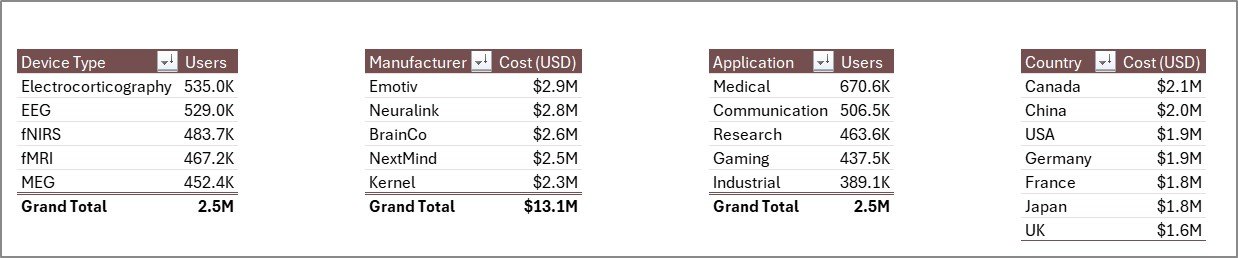
📊 Overview Page – Snapshot of users, cost, and applications

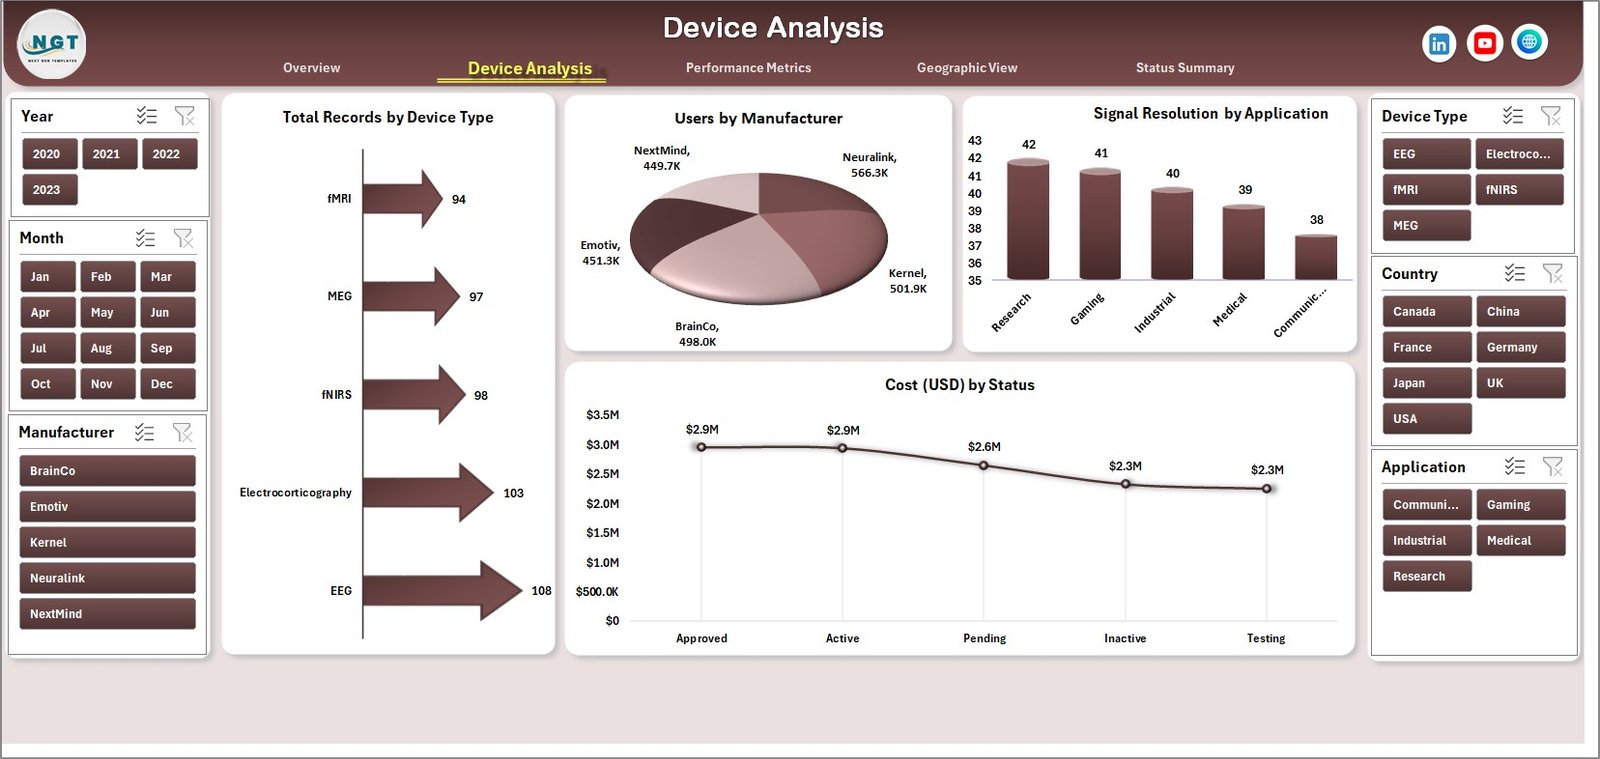
⚙️ Device Analysis – Evaluate device-level performance
📈 Performance Metrics – Track accuracy, compliance, and costs
🌍 Geographic View – Analyze global performance trends
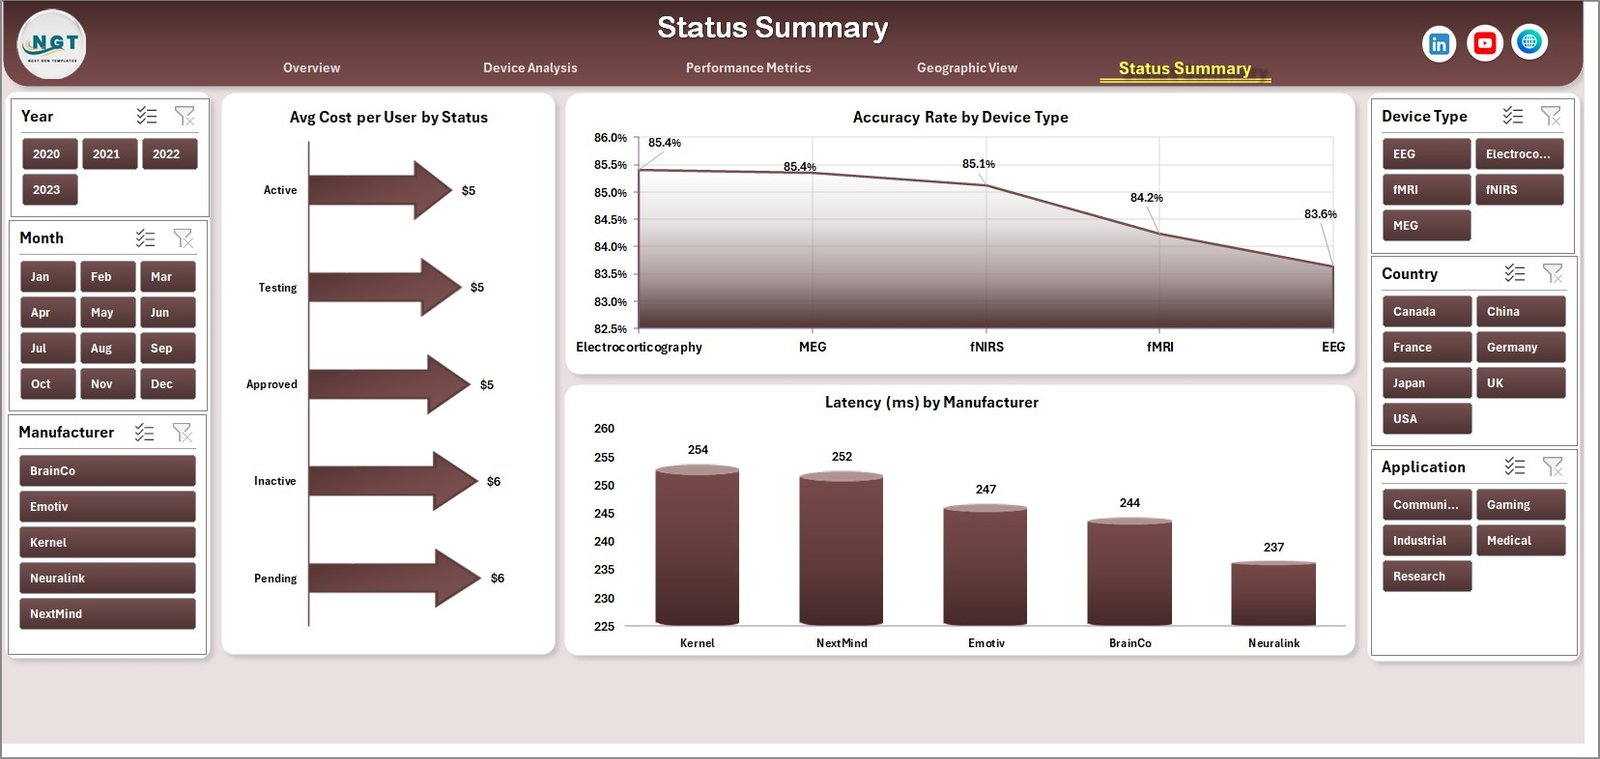
📊 Status Summary – Monitor system health and operational metrics
📂 Additional Sheets:
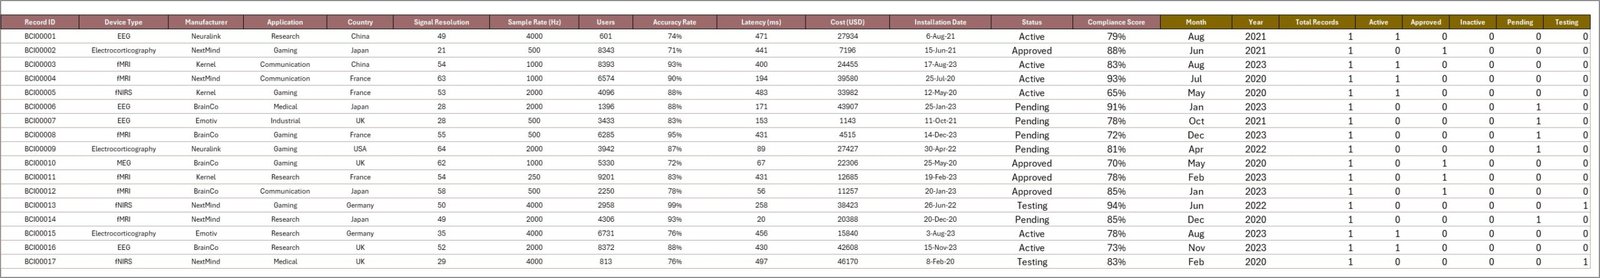
- Data Sheet – Stores raw BCI data
- Support Sheet – Handles calculations and dropdowns
👉 Together, these components deliver a complete 360° view of BCI system performance.
⚙️ How to Use the Brain-Computer Interfaces Dashboard in Excel
Getting started is simple:
👉 Enter your data into the Data Sheet
👉 Click Refresh All to update visuals
👉 Use slicers to filter by device, country, or status
👉 Analyze KPIs and charts
👉 Take data-driven actions
Within minutes, you can transform raw BCI data into powerful insights 📊.
👨💻 Who Can Benefit from This Brain-Computer Interfaces Dashboard in Excel
This dashboard is ideal for:
🏥 Healthcare Professionals – Monitor patient-device interaction
🧪 Researchers & Scientists – Analyze experimental data
🤖 AI & Robotics Teams – Improve human-machine interaction
🎮 Gaming Industry Experts – Track engagement and performance
📊 Data Analysts – Generate insights and reports
👉 Anyone working with BCI systems, neuroscience, or advanced tech analytics will benefit from this tool.
🔗 Click hare to read the Detailed blog post
Explore the full guide with features, benefits, and best practices.
👉 Visit our YouTube channel to learn step-by-step video tutorials:
https://youtube.com/@PKAnExcelExpert