The Biotechnology Dashboard is one of the fastest-growing sectors in the world, generating vast amounts of data every single day—from R&D spending to clinical trials and regulatory approvals. Managing this complex information effectively is essential for innovation, compliance, and cost optimization. But while many companies invest in expensive BI tools, Excel remains a cost-effective, flexible, and powerful platform for actionable dashboards.
The Biotechnology Dashboard in Excel is a ready-to-use template that transforms raw biotech data into interactive KPIs, charts, and reports. It centralizes key metrics like R&D costs, approvals, trial performance, and regional operations into one file, helping managers and executives make fast, data-driven decisions without the need for complex tools.
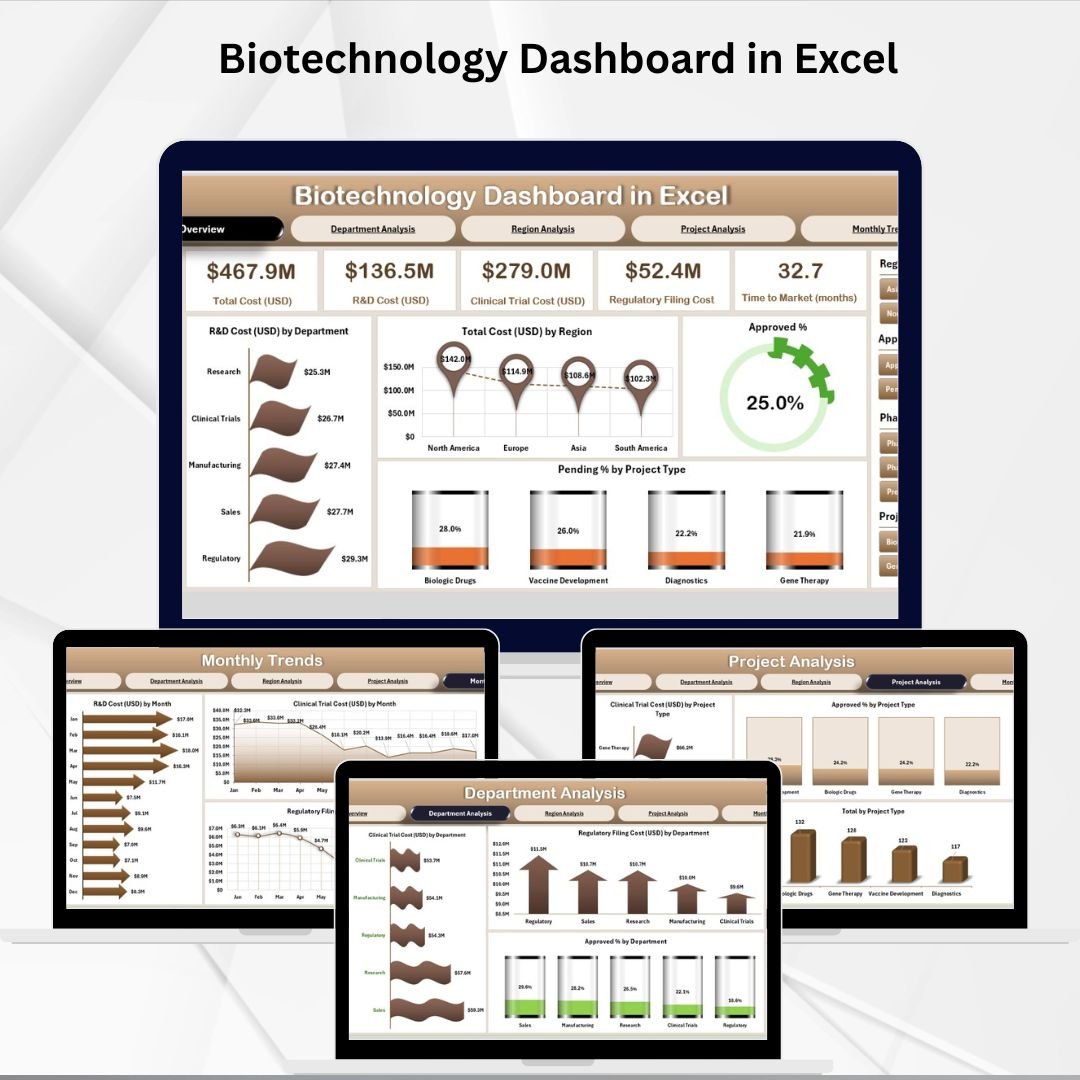
✨ Key Features of the Biotechnology Dashboard in Excel
-
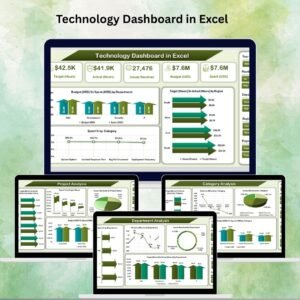
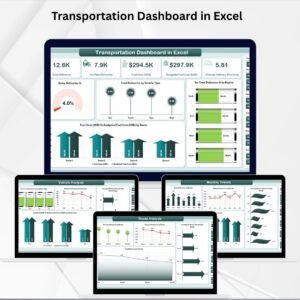
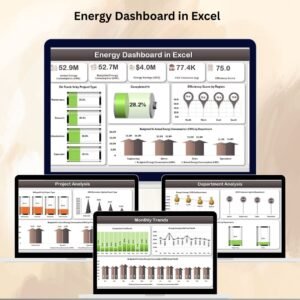
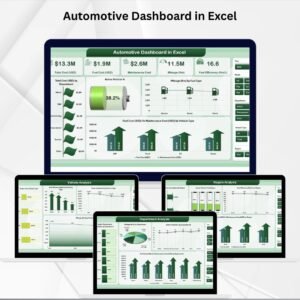
📊 Five Analytical Pages – Overview, Department Analysis, Region Analysis, Project Analysis, and Monthly Trends.
-
📝 Supporting Sheets – Data Sheet and Support Sheet for clean, consistent reporting.
-
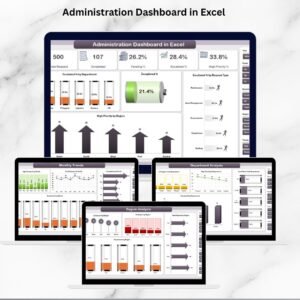
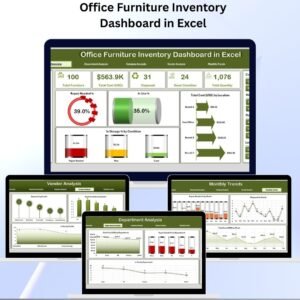
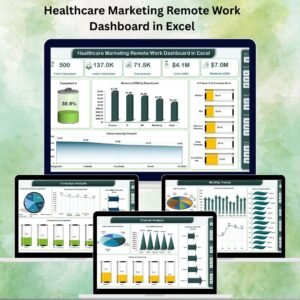
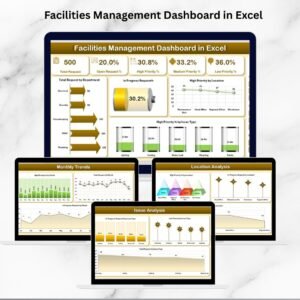
🎯 KPI Cards – Track total R&D cost, total costs by region, and approval percentages at a glance.
-
📈 Dynamic Charts – Visualize R&D, clinical trials, regulatory filings, and approvals by department, region, and project type.
-
🎛️ Slicers & Filters – One-click filtering by department, region, or project type.
-
⚡ Pivot-Driven Automation – Update the data sheet once, and the dashboard refreshes instantly.
-
🖥️ Excel-Based – No need for additional BI software—simple, accessible, and customizable.
📦 What’s Inside the Biotechnology Dashboard
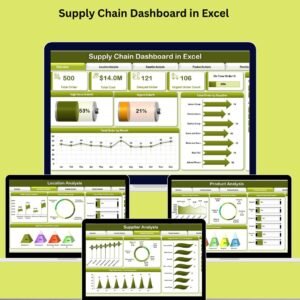
This dashboard template is organized into five primary reporting pages plus supporting sheets:
-
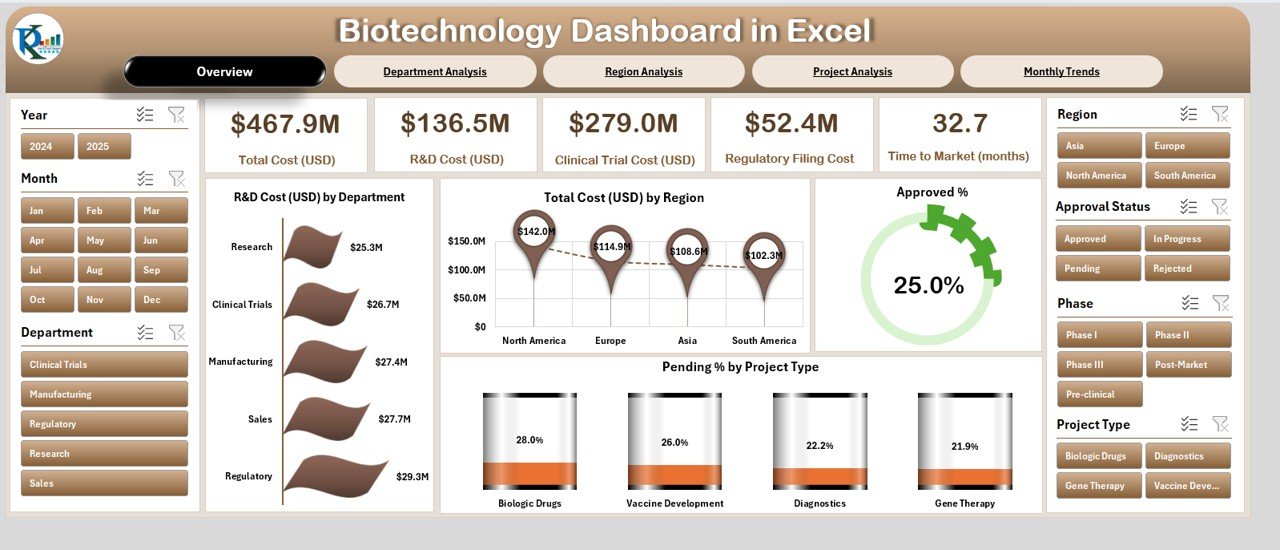
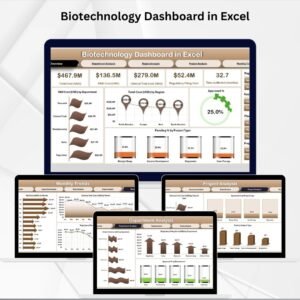
Overview Page – Quick KPIs and charts, including R&D Cost by Department, Total Cost by Region, Approved % by Project Type, and Pending %.
-
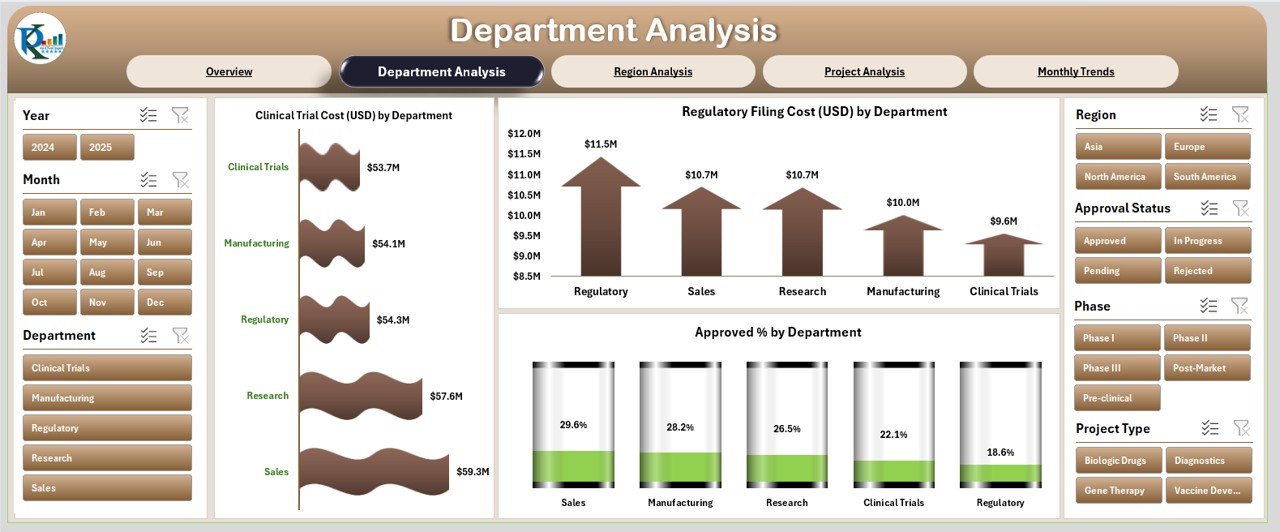
Department Analysis – Compare clinical trial and regulatory filing costs by department, plus approval percentages for each team.
-
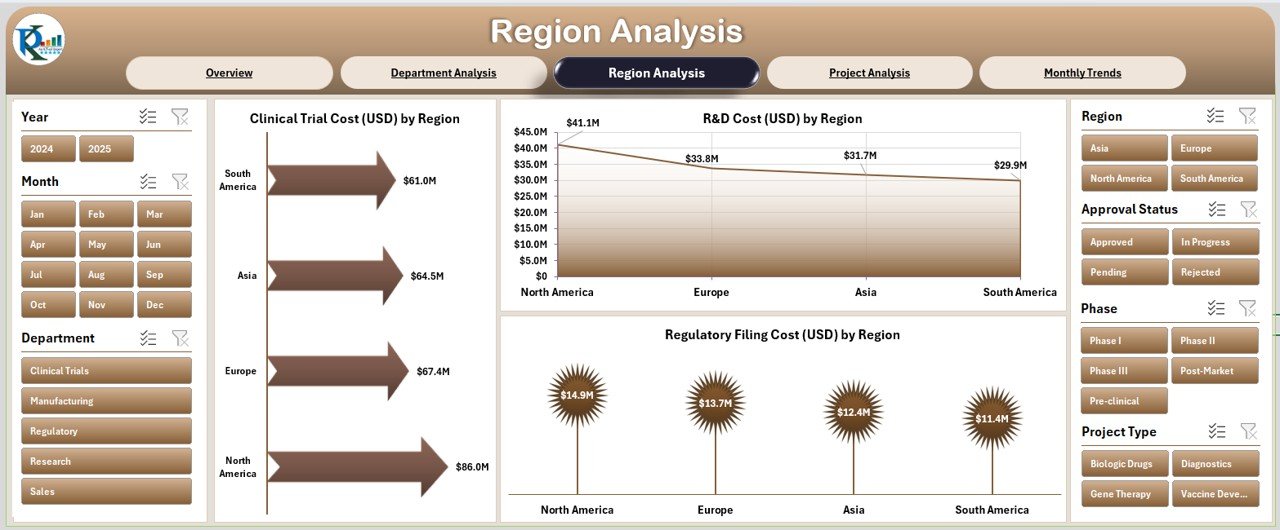
Region Analysis – Track R&D, clinical trial, and filing costs by region to identify performance gaps and resource needs.
-
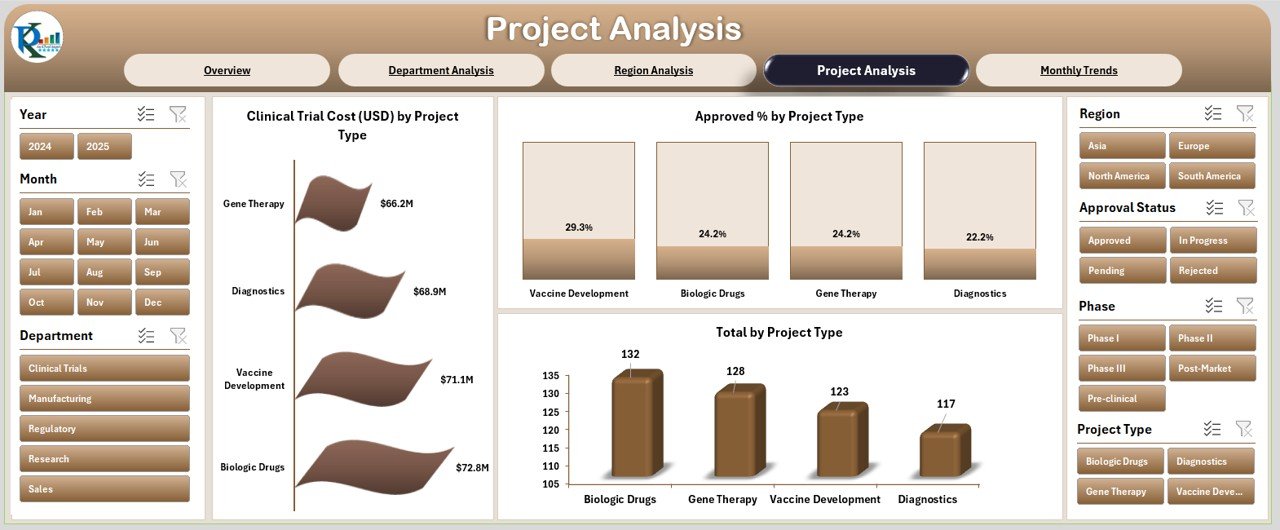
Project Analysis – Drill into costs, approvals, and total spend by project type—ideal for portfolio management.
-
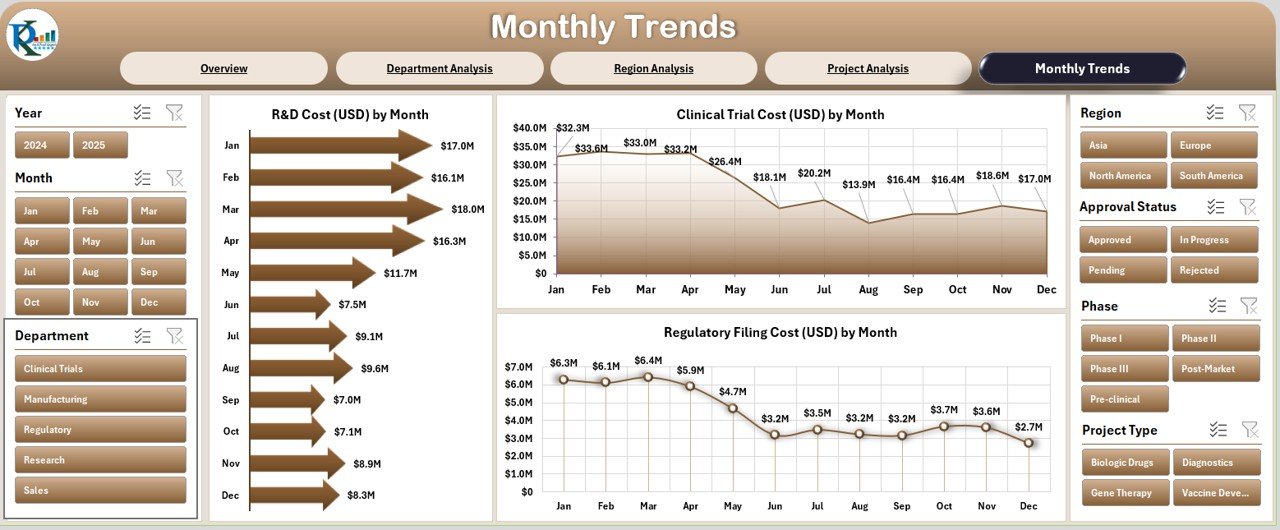
Monthly Trends – Analyze R&D, clinical trial, and regulatory filing costs over time for trend forecasting and budgeting.
Data Sheet – Stores raw numbers like project details, costs, and approvals.
Support Sheet – Contains reference values and dropdown lists to ensure consistent reporting.
🛠️ How to Use the Biotechnology Dashboard
-
Update Data Sheet – Enter biotech data such as R&D costs, trial results, approvals, and filing expenses.
-
Explore KPIs – Check the Overview Page for a high-level snapshot.
-
Dive Deeper – Use Department, Region, or Project Analysis pages for detailed insights.
-
Spot Trends – Track progress over months in the Monthly Trends page.
-
Customize Easily – Add KPIs, modify charts, or link with SQL/Access for automation.
With minimal setup, your team will have instant visibility into biotech operations.
👥 Who Can Benefit from This Dashboard
-
Research Managers – Monitor trial progress and R&D efficiency.
-
Financial Controllers – Track costs by department, region, and project type.
-
Compliance Teams – Ensure proper monitoring of regulatory filing activities.
-
Executives & Investors – Gain quick insights into approvals, spending, and performance trends.
-
Startups & Enterprises – Scalable solution for organizations of all sizes.


Reviews
There are no reviews yet.