


Transform your renewable energy operations with the Biofuel Plants Dashboard in Excel 🚀. In today’s fast-growing biofuel industry, managing data across plant performance, revenue, margins, feedstock, and technology can be overwhelming.
However, this powerful and ready-to-use Excel dashboard simplifies everything. It converts complex biofuel data into clear visuals, actionable insights, and structured reports—all in one place.
With this dashboard, you can monitor plant uptime, revenue trends, profit margins, and operational efficiency effortlessly. As a result, you can make faster, smarter, and data-driven decisions to improve performance and profitability.
🚀 Key Feature of Biofuel Plants Dashboard in Excel
✅ 📊 Interactive Excel Dashboard
Analyze biofuel operations using dynamic charts and slicers.
✅ 📈 Complete KPI Tracking
Track uptime %, revenue, margin %, and plant performance.
✅ 📅 Multi-Page Analytical Dashboard
Explore insights across multiple structured pages.
✅ 🌾 Feedstock & Technology Insights
Evaluate performance across feedstock types and technologies.
✅ 🌍 Country-Level Analysis
Compare plant performance across regions.
✅ ⚙️ Automated Calculations
Support sheet handles backend calculations for accurate results.
✅ 📂 Organized Data Structure
Separate Data and Support sheets for efficient management.
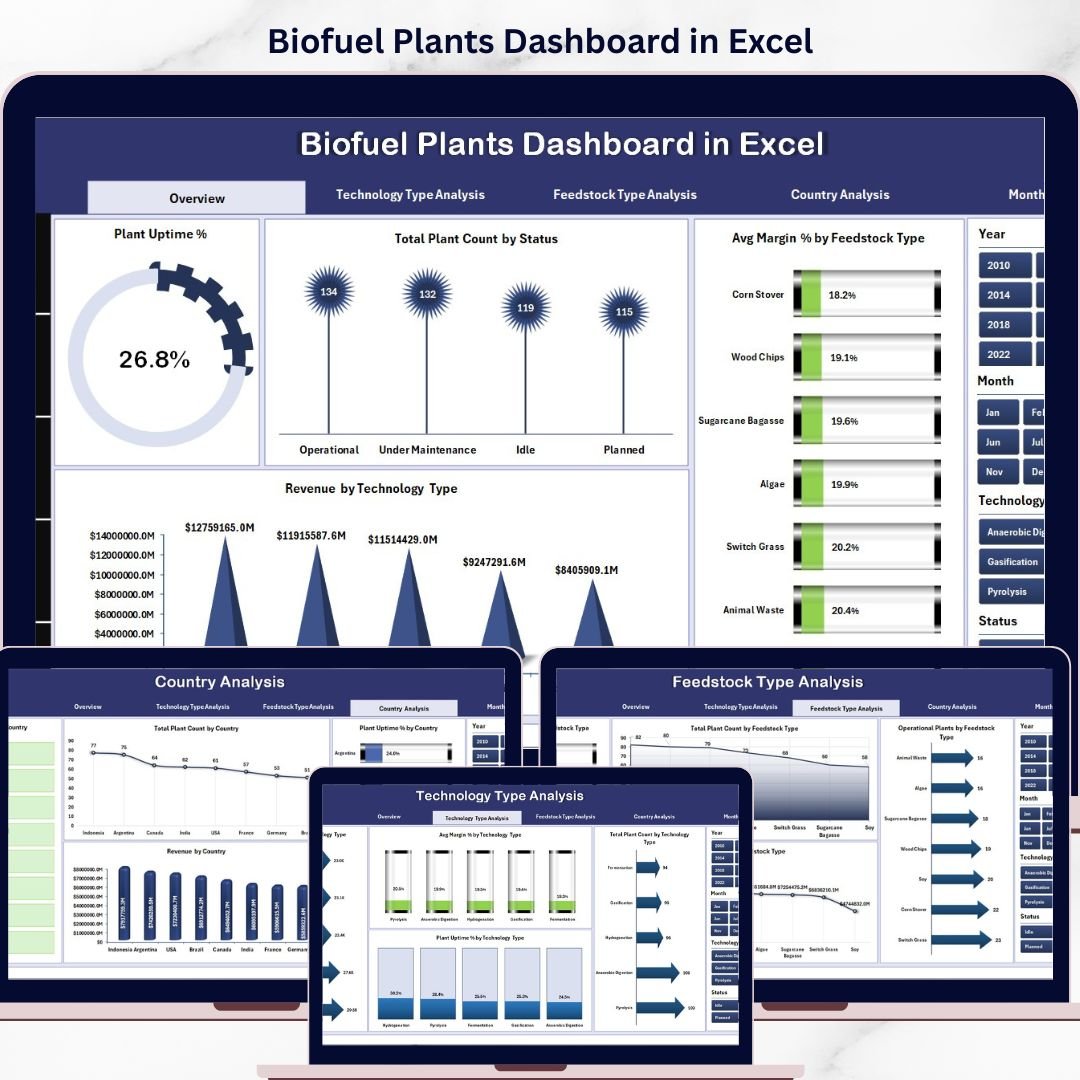
📦 What’s Inside the Biofuel Plants Dashboard in Excel
This template includes 5 powerful analytical pages:
📊 Overview Page – Snapshot of KPIs with performance cards and charts

⚙️ Technology Type Analysis – Evaluate efficiency across technologies
🌾 Feedstock Type Analysis – Analyze raw material performance
🌍 Country Analysis – Compare regional plant performance
📅 Month Analysis – Track trends and growth over time
📂 Additional Sheets:
-
Data Sheet – Stores all raw biofuel plant data
-
Support Sheet – Handles calculations and backend logic
Everything is designed to give you a complete 360° view of biofuel operations.
⚙️ How to Use the Biofuel Plants Dashboard in Excel
Getting started is simple:
👉 Enter your data in the Data Sheet
👉 Calculations update automatically in the Support Sheet
👉 Use slicers to filter by feedstock, technology, or country
👉 Analyze KPI cards and charts
👉 Identify trends and take action
Within minutes, you can transform raw data into powerful operational insights 📊.
👨🔬 Who Can Benefit from This Biofuel Plants Dashboard in Excel
This dashboard is ideal for:
🌱 Biofuel Plant Managers – Monitor plant performance
📊 Renewable Energy Analysts – Analyze trends and KPIs
⚙️ Operations Teams – Optimize production efficiency
💰 Financial Analysts – Track revenue and profitability
🏛️ Energy Consultants – Provide strategic insights
Anyone involved in biofuel production and renewable energy analytics will benefit from this solution.
🔗 Click hare to read the Detailed blog post
Explore the full guide with detailed features, benefits, and best practices.
👉 Visit our YouTube channel to learn step-by-step video tutorials:
https://youtube.com/@PKAnExcelExpert