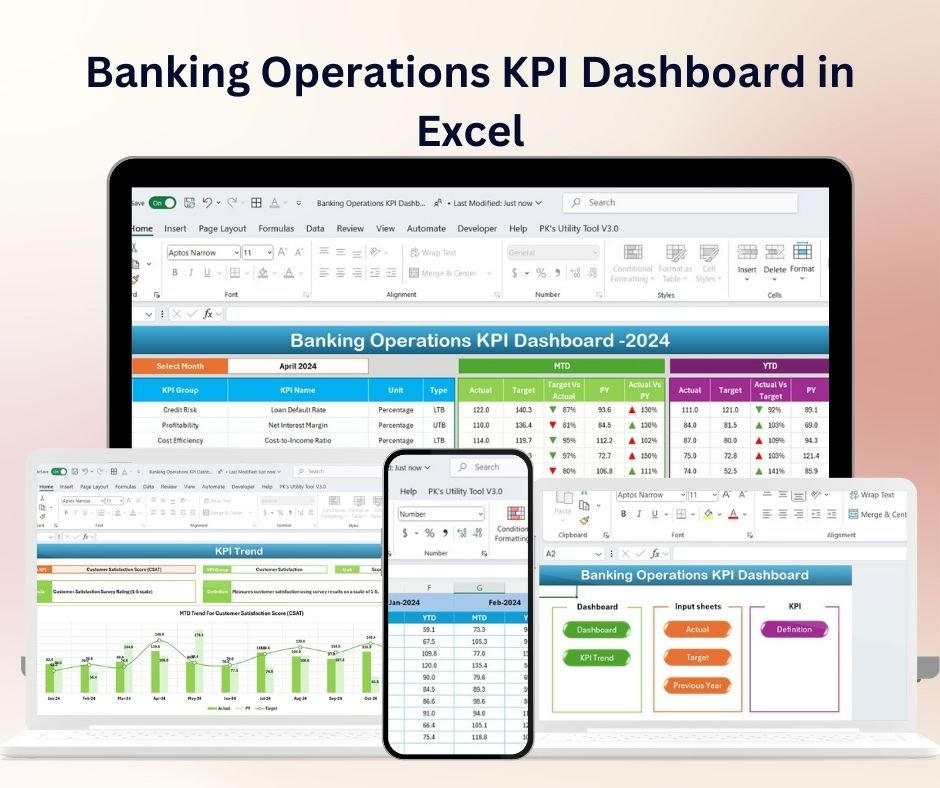
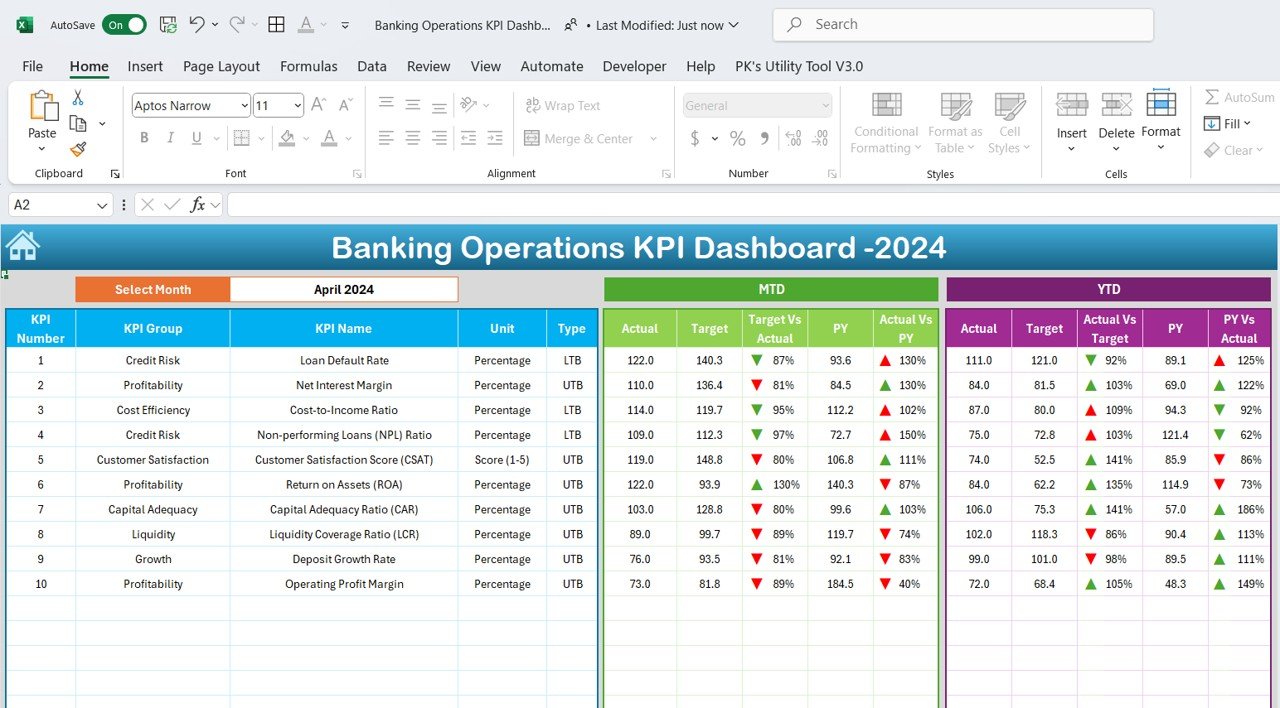
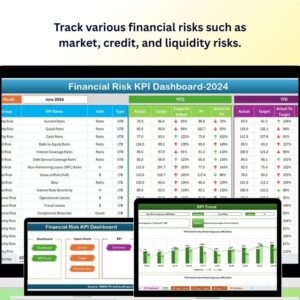
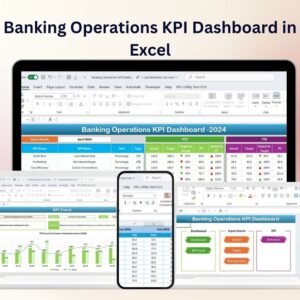
The Banking Operations KPI Dashboard in Excel is a powerful tool designed to help financial institutions, banking managers, and analysts track key performance indicators (KPIs) and analyze the performance of their banking operations. This fully customizable dashboard allows you to monitor a wide range of banking metrics such as loan processing times, customer satisfaction, deposit growth, and much more, all in a single, visually appealing format.
Using this dashboard, you can easily track the performance of various departments, identify trends, and assess the efficiency of daily operations. Whether you’re managing customer service, loan approvals, or branch performance, this KPI dashboard enables you to visualize data quickly and make data-driven decisions to improve banking operations.
Key Features of the Banking Operations KPI Dashboard:
📊 Comprehensive KPI Monitoring
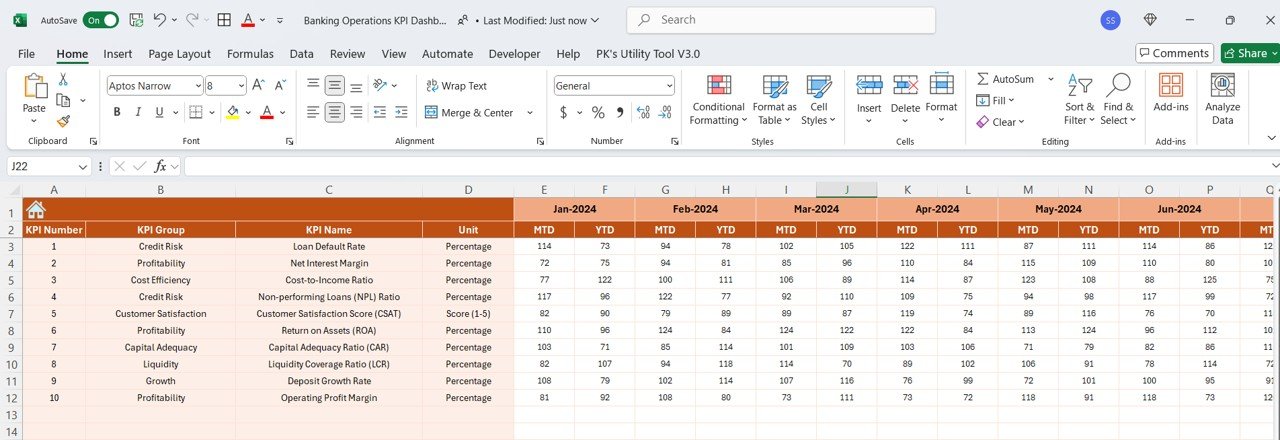
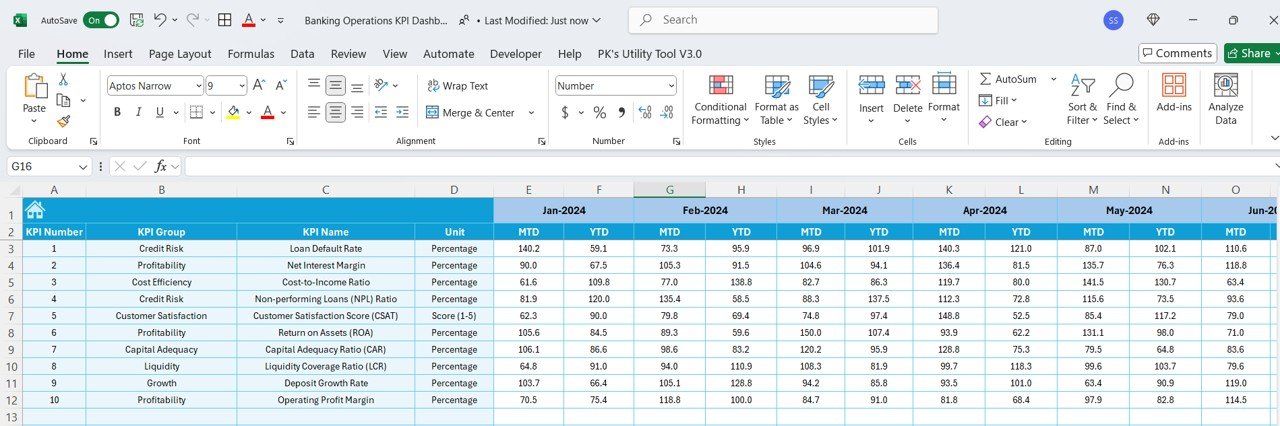
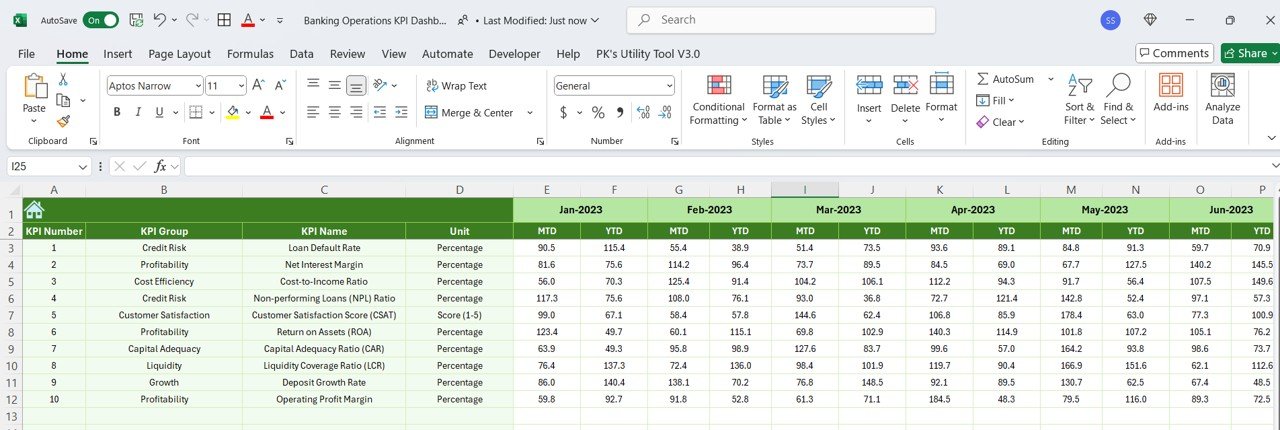
Track multiple key performance indicators across various banking functions, such as loan processing time, customer satisfaction, deposit growth, and account turnover. View all of your performance data in one place for a comprehensive overview of banking operations.
📅 Customizable Time Frames
Monitor performance over different time frames, such as weekly, monthly, or quarterly, and adjust time periods to match your bank’s reporting cycle. This feature helps you analyze trends and adjust strategies as needed.
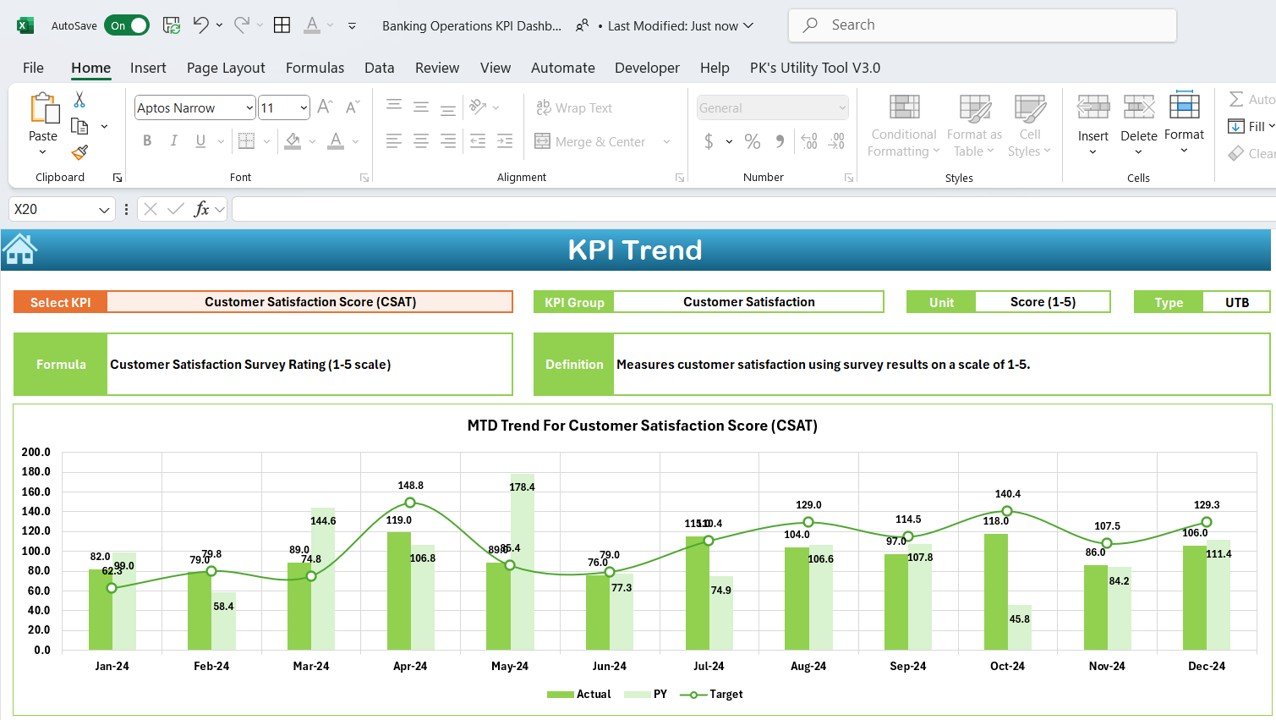
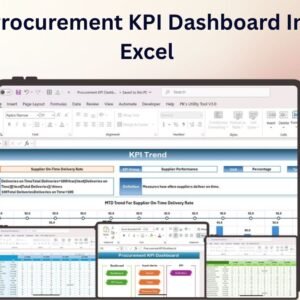
📈 Dynamic Data Visualizations
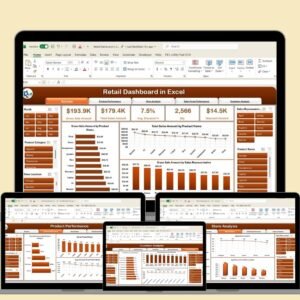
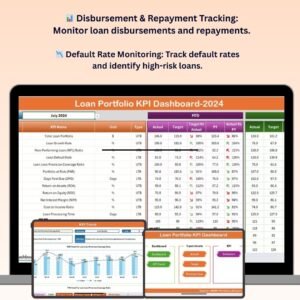
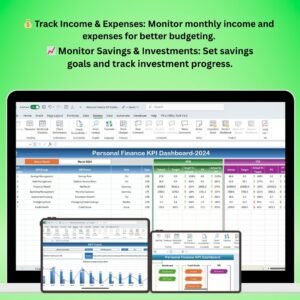
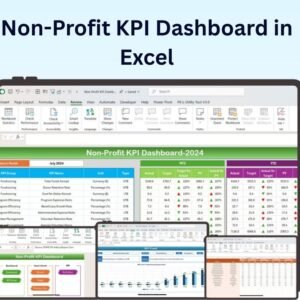
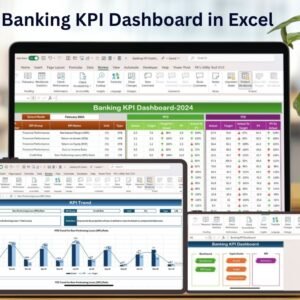
Visualize your KPIs with dynamic graphs, bar charts, and pie charts that provide an easy-to-understand, at-a-glance overview of performance. This makes it easier to identify areas that need attention and assess overall performance trends.
🔄 Real-Time Updates
As you enter new data, the dashboard automatically updates to reflect the latest metrics. This ensures that you always have access to real-time insights without manually recalculating or adjusting formulas.
⚙️ Customizable Design and Metrics
Easily adjust the dashboard to fit your unique needs. Add or remove KPIs, change color schemes, and tweak data visualization settings to ensure the dashboard meets your reporting and tracking requirements.
Why You’ll Love the Banking Operations KPI Dashboard:
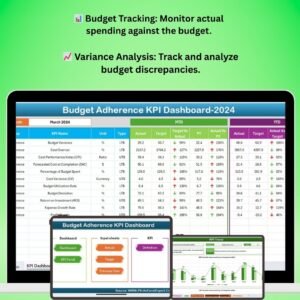
✅ Simplifies Performance Tracking – Keep track of multiple KPIs in one place, reducing the need for separate reports and complex spreadsheets. ✅ Improves Data Visualization – Use graphs and charts to present banking data in a visually appealing and easy-to-understand format. ✅ Real-Time Insights – Always have access to the most up-to-date data as the dashboard updates automatically when new information is entered. ✅ Customizable for Your Bank – Tailor the dashboard to reflect the specific KPIs and goals relevant to your banking operations. ✅ Boosts Decision-Making – With real-time data and easy-to-read visualizations, this dashboard helps you make more informed decisions for improving efficiency and performance.
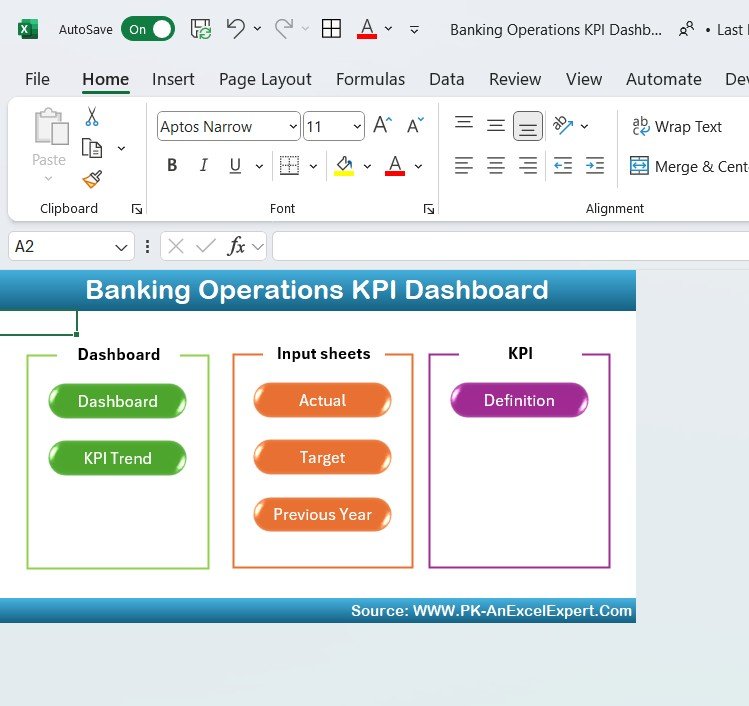
What’s Inside the Banking Operations KPI Dashboard:
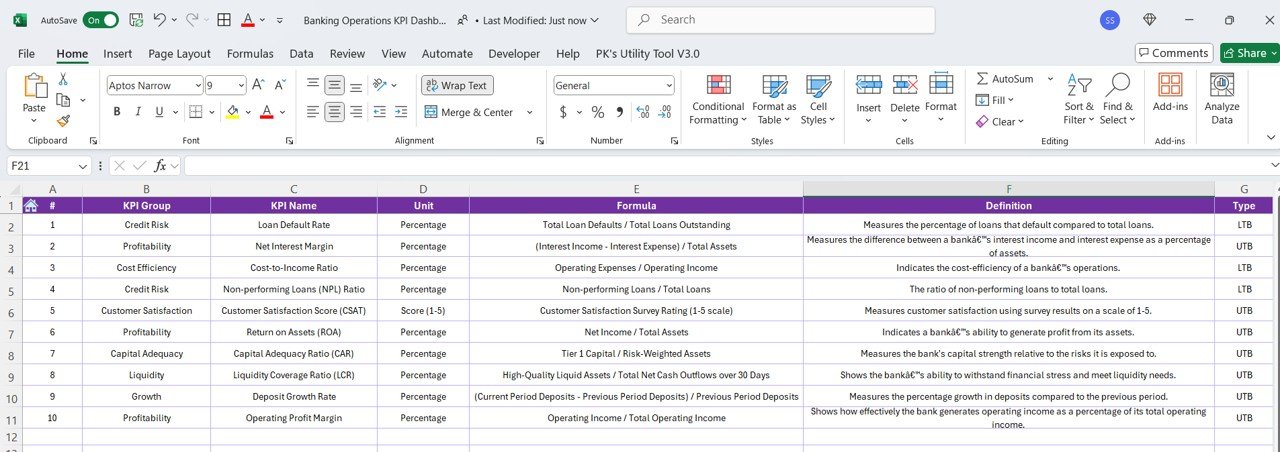
- Multiple KPI Tracking – Monitor a wide variety of banking KPIs such as loan processing time, customer satisfaction, and account turnover.
- Dynamic Charts and Graphs – Use bar charts, pie charts, and trend lines to visualize your data in an engaging way.
- Customizable Inputs – Tailor the dashboard by adding or removing metrics, adjusting time frames, and modifying chart designs.
- Real-Time Updates – Automatically update KPIs and charts as you enter new data.
- Comprehensive Overview – Get a clear, visual summary of banking performance at a glance.
How to Use the Banking Operations KPI Dashboard:
1️⃣ Download the Template – Get access to your Excel file instantly after purchase. 2️⃣ Input Banking Data – Add your current KPIs, performance data, and targets. 3️⃣ Visualize Your Data – Watch the dashboard generate real-time visualizations and performance updates. 4️⃣ Track and Improve – Use the data insights to identify trends and make improvements in banking operations.
Who Can Benefit from the Banking Operations KPI Dashboard:
- Banking Managers
- Financial Analysts
- Branch Managers
- Customer Service Teams
- Banking Operations Teams
- Financial Institutions
Optimize your banking operations with this comprehensive KPI dashboard, helping you stay on top of performance and ensure efficient operations at all levels.
Click here to read the Detailed blog post
https://www.pk-anexcelexpert.com/banking-operations-kpi-dashboard-in-excel/
Visit our YouTube channel to learn step-by-step video tutorials


Reviews
There are no reviews yet.