The Banking KPI Dashboard in Power BI is a powerful tool for financial institutions, bank managers, and analysts to monitor and analyze key performance indicators (KPIs) that drive the banking sector. This Power BI dashboard consolidates critical financial data, enabling banks to track performance in real-time, assess profitability, and identify trends in customer behavior, loan performance, deposits, and more.
With interactive charts, real-time data visualization, and customizable features, this dashboard empowers decision-makers to make data-driven choices that enhance operational efficiency, boost revenue, and improve customer satisfaction. Whether you’re managing a single branch or an entire banking network, this dashboard provides the insights you need to optimize bank operations and achieve business goals.
Key Features of the Banking KPI Dashboard in Power BI
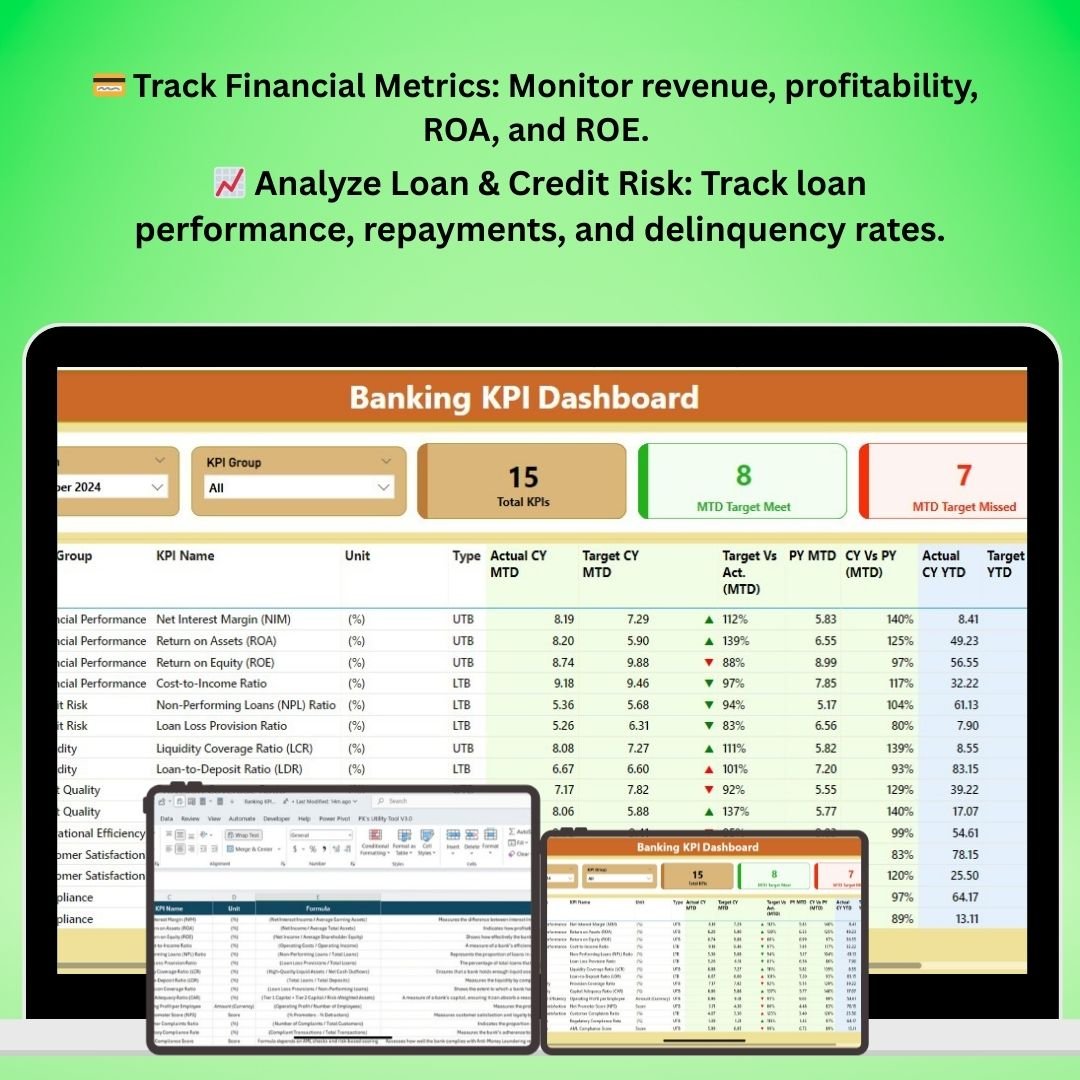
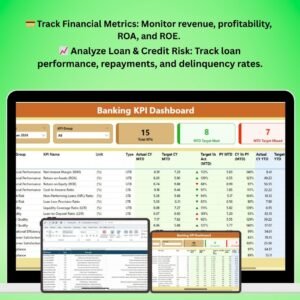
💳 Track Financial KPIs
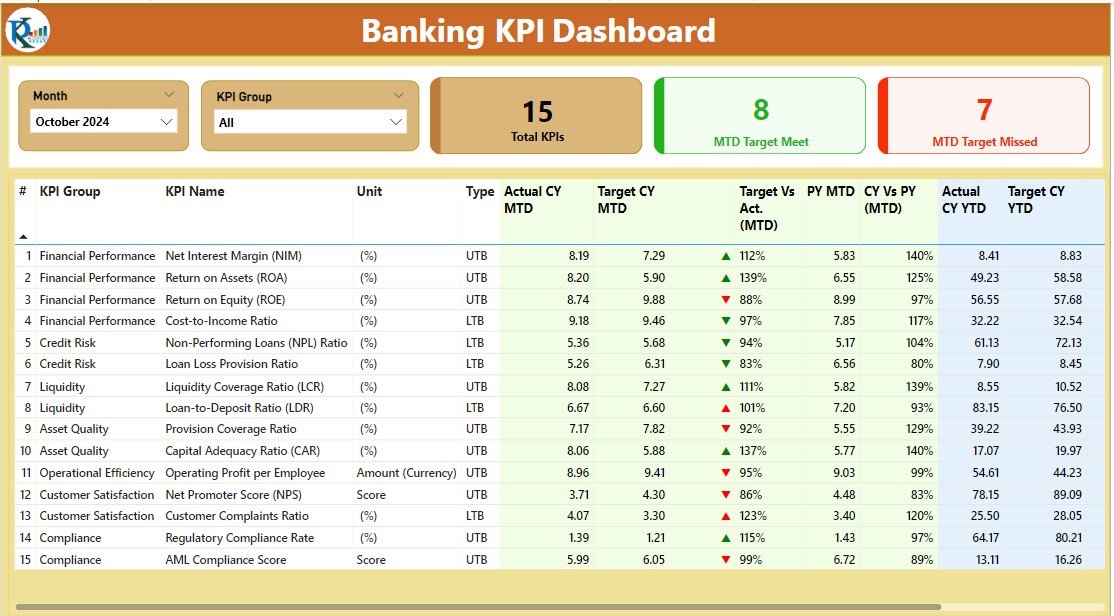
Monitor essential financial metrics such as revenue, net income, and operating costs. Track profitability with KPIs like Return on Assets (ROA), Return on Equity (ROE), and cost-to-income ratio to evaluate your bank’s financial health.
📈 Loan & Credit Performance
Track loan issuance, repayment rates, and credit risk. Analyze the performance of your bank’s loan portfolio, including delinquency rates and loan growth, to manage financial risk effectively.
💰 Deposit & Investment Tracking
Monitor deposits, investment income, and deposit growth. Analyze trends in savings accounts, checking accounts, and time deposits to assess liquidity and profitability.
👥 Customer Behavior & Satisfaction
Gain insights into customer behavior, retention rates, and satisfaction scores. Track key customer metrics like Net Promoter Score (NPS), average account balance, and customer acquisition cost to improve customer experience.
🧑💼 Employee Productivity & Performance
Evaluate employee performance and productivity with KPIs such as transactions per employee, customer interactions, and service efficiency. Identify top performers and areas that need attention.
📊 Interactive & Customizable Dashboards
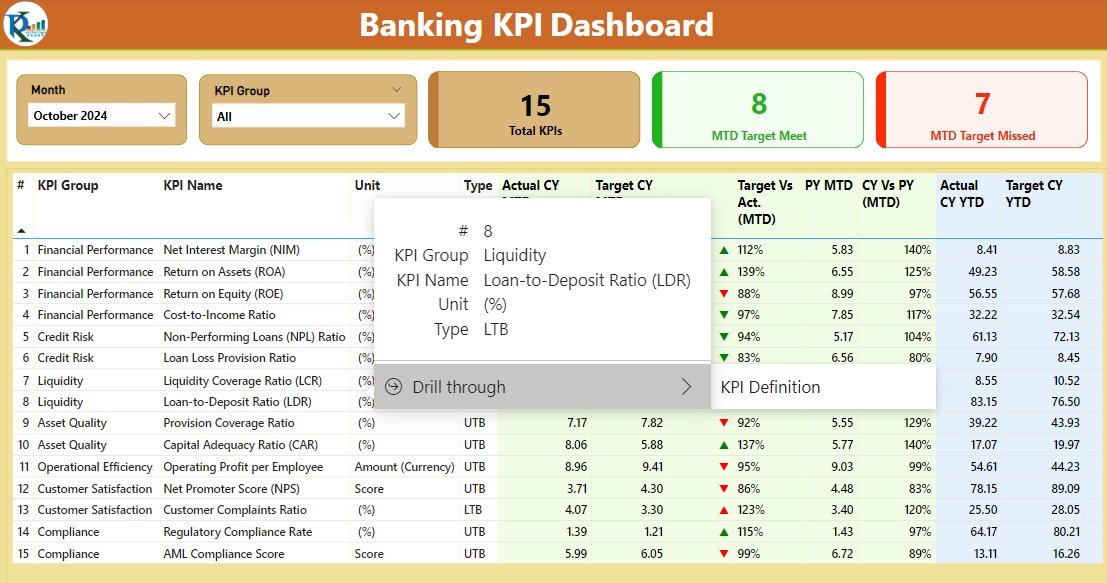
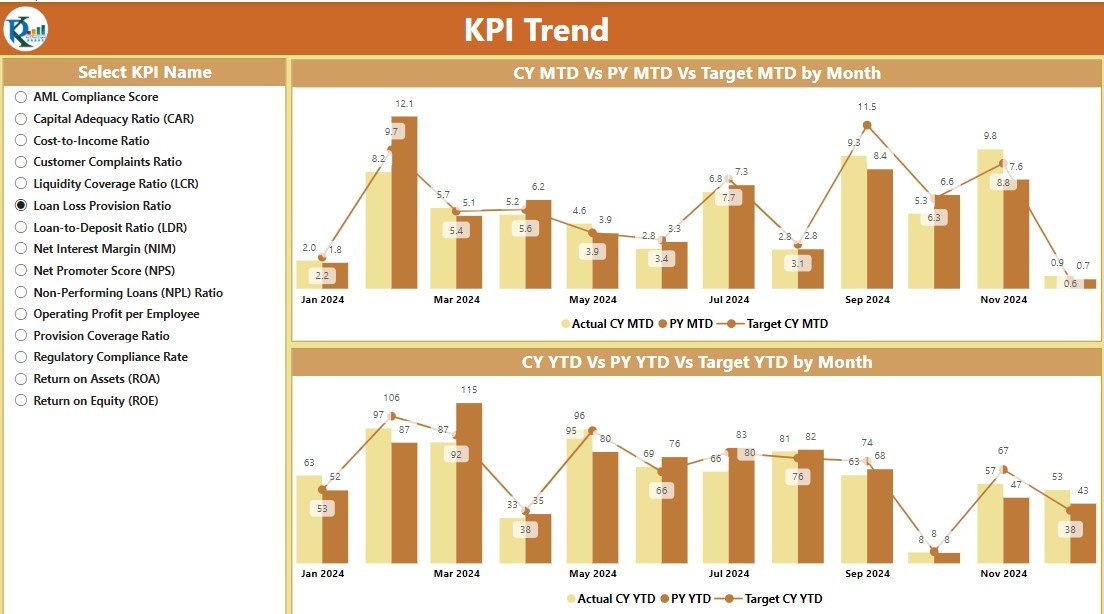
This dashboard is fully interactive, allowing users to drill down into specific metrics, filter data by time period or region, and customize KPIs and reports to suit the bank’s unique needs.
Why You’ll Love the Banking KPI Dashboard in Power BI

✅ Comprehensive Financial Overview
Get a complete view of your bank’s financial performance in one place. Track revenue, expenses, and profit margins to optimize financial decision-making.
✅ Improve Loan & Credit Risk Management
Monitor the performance of loans and credit portfolios to manage risk more effectively. Reduce delinquency rates by tracking loan repayment and identifying potential problem areas.
✅ Enhance Customer Engagement
Track customer satisfaction and behavior metrics to improve customer retention and acquisition strategies. Improve your customer service approach by focusing on key touchpoints that matter.
✅ Optimize Bank Operations
Analyze operational metrics like employee productivity and branch performance to streamline bank operations. Use insights to improve efficiency, reduce costs, and drive higher profitability.
✅ Fully Customizable & Scalable
The dashboard can be fully customized to match the specific needs of your bank. Adjust KPIs, time periods, and reports to track metrics that align with your business objectives.
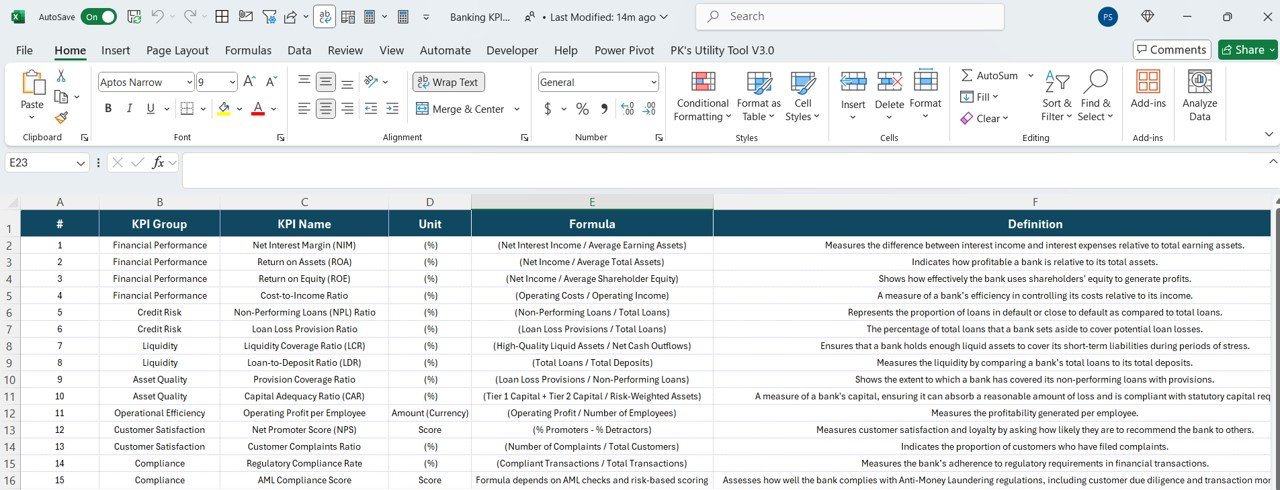
What’s Inside the Banking KPI Dashboard Template in Power BI?
- Financial KPIs: Track revenue, net income, ROA, ROE, and more.
- Loan Performance Metrics: Monitor loan growth, repayment rates, delinquency, and credit risk.
- Deposit & Investment Tracking: Track deposits, investment income, and liquidity levels.
- Customer Metrics: Analyze customer behavior, retention, NPS, and acquisition cost.
- Employee Productivity: Measure employee performance, transactions per employee, and service efficiency.
- Customizable Dashboard: Adjust KPIs and reports to suit your bank’s needs.
How to Use the Banking KPI Dashboard in Power BI
1️⃣ Download the Template: Get instant access to the Banking KPI Dashboard in Power BI.
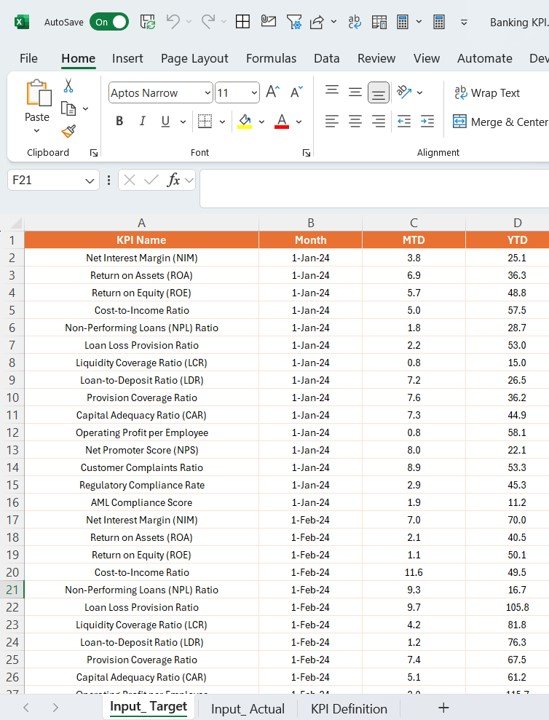
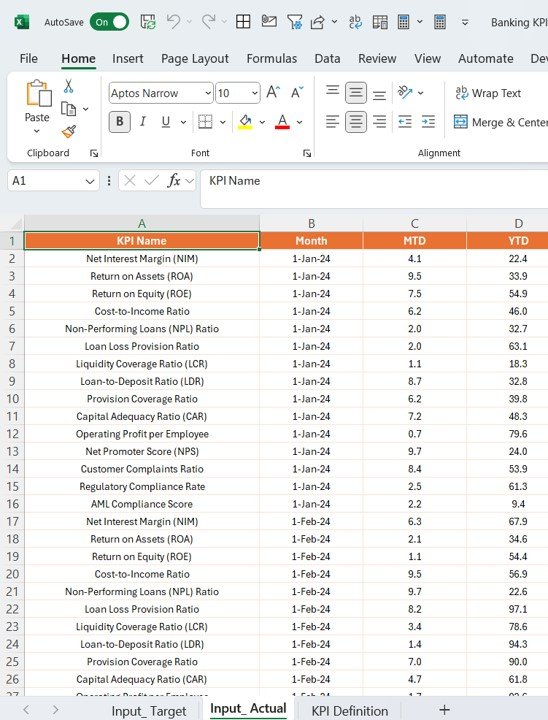
2️⃣ Input Your Bank’s Data: Enter your bank’s key financial data, loan portfolios, customer satisfaction metrics, and operational performance data.
3️⃣ Track & Monitor KPIs: Use the dashboard to monitor and track financial KPIs, loan performance, customer behavior, and employee productivity.
4️⃣ Analyze & Optimize: Use insights from the dashboard to identify areas for improvement and optimize your banking operations.
5️⃣ Generate Reports & Share Insights: Create custom reports to share with stakeholders, executives, or regulators for data-driven decision-making.
Who Can Benefit from the Banking KPI Dashboard in Power BI?
🔹 Bank Managers & Branch Operations
🔹 Financial Analysts & Business Intelligence Teams
🔹 Risk Managers & Loan Officers
🔹 Customer Service & Retention Teams
🔹 Marketing & Sales Teams
🔹 Executives & Decision-Makers in Banking Institutions
Optimize your banking operations with the Banking KPI Dashboard in Power BI. Track key metrics, identify trends, and improve decision-making to drive your bank’s success and profitability.
Click here to read the Detailed blog post
Visit our YouTube channel to learn step-by-step video tutorials
Youtube.com/@PKAnExcelExpert


Reviews
There are no reviews yet.