
Architecture and design projects thrive on precision, creativity, and efficient resource management. Yet, without a structured reporting system, firms often struggle with scattered data, inconsistent reporting, and delayed insights. The Architecture and Design KPI Dashboard in Excel solves this by providing a centralized, interactive, and easy-to-use tool for monitoring performance across critical KPIs.
This dashboard allows studios and firms to track project delivery timelines, cost efficiency, design quality, client satisfaction, and resource utilization—all in one place. Built entirely in Excel, it eliminates the need for expensive BI software while offering robust visual insights through conditional formatting, automated comparisons, and trend analysis.
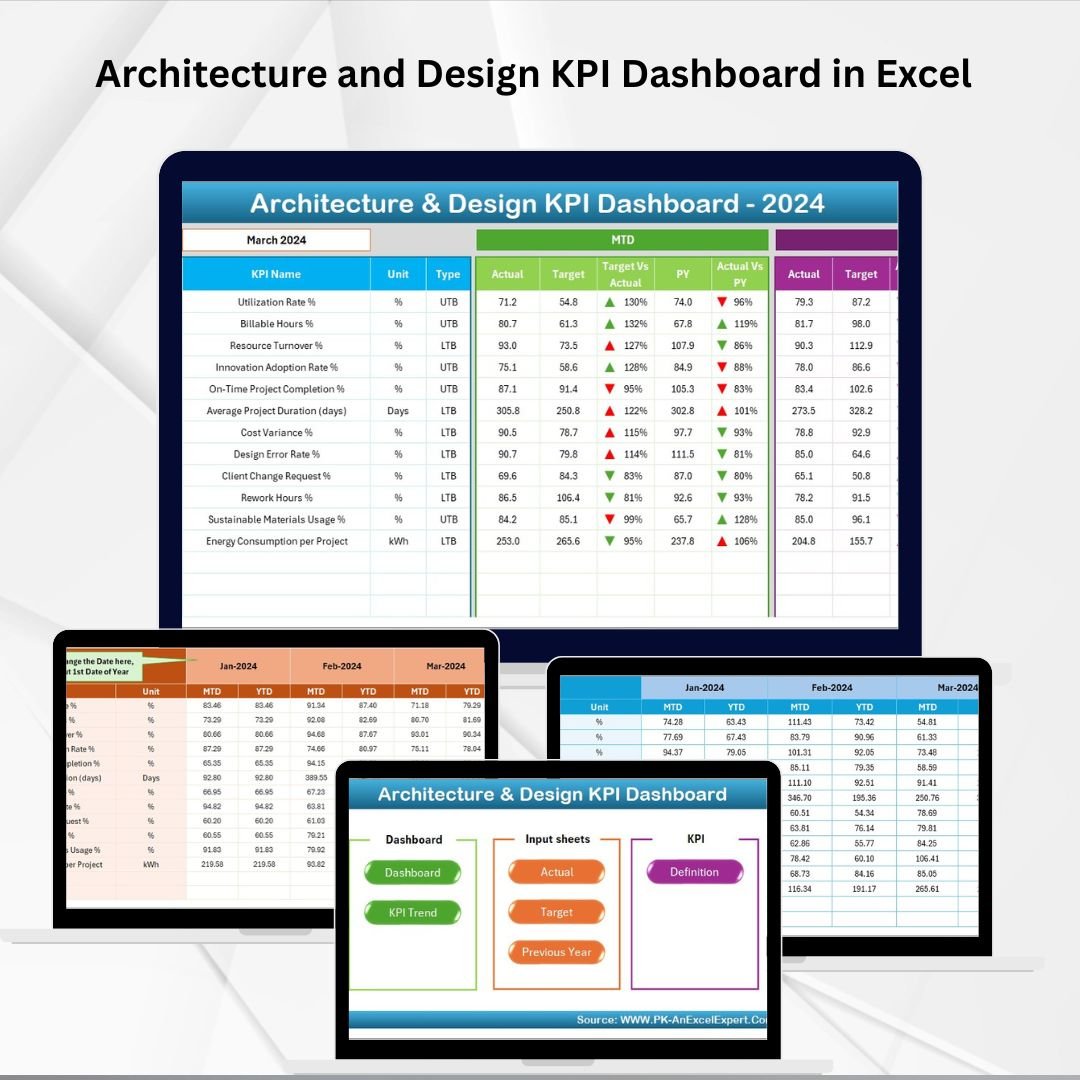
✨ Key Features of Architecture and Design KPI Dashboard in Excel
-
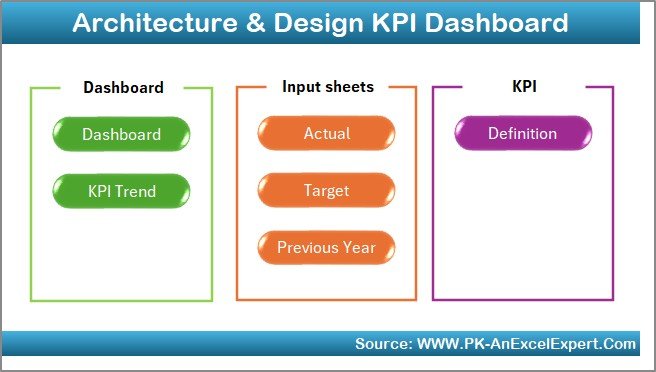
🏠 Home Sheet – Central navigation hub with six quick buttons for instant access to different dashboard sections.
-
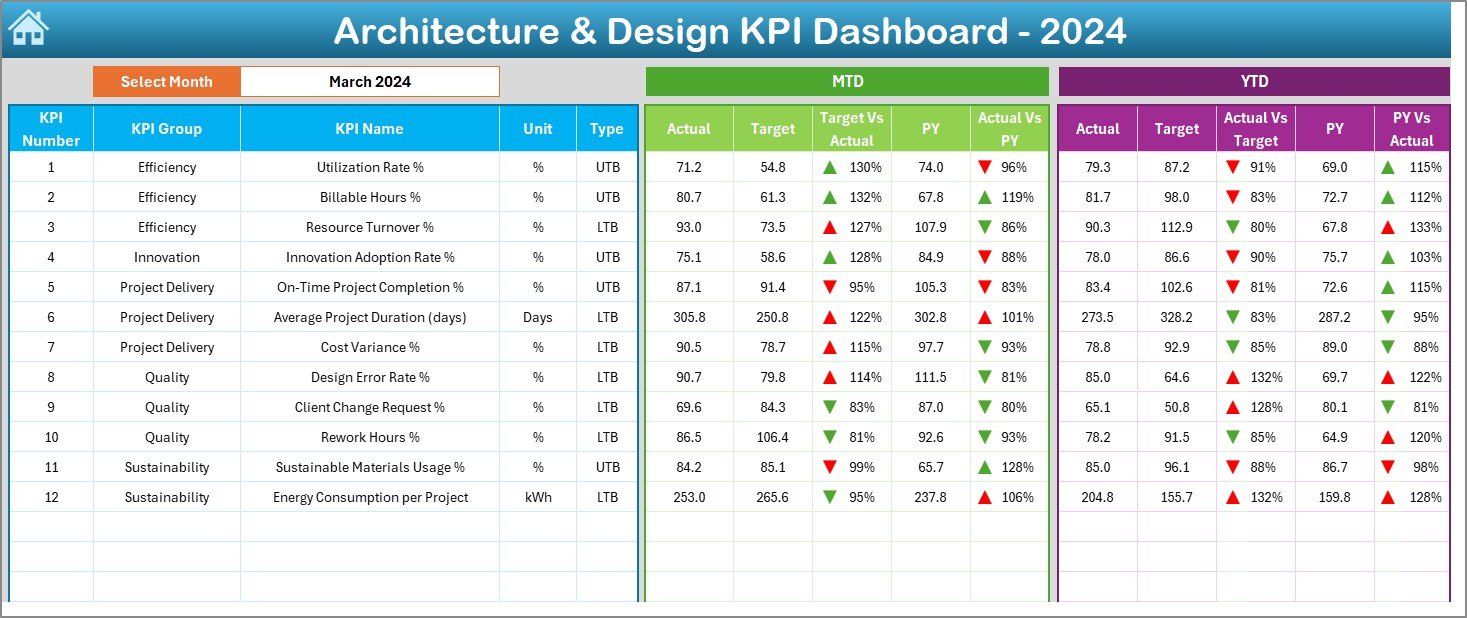
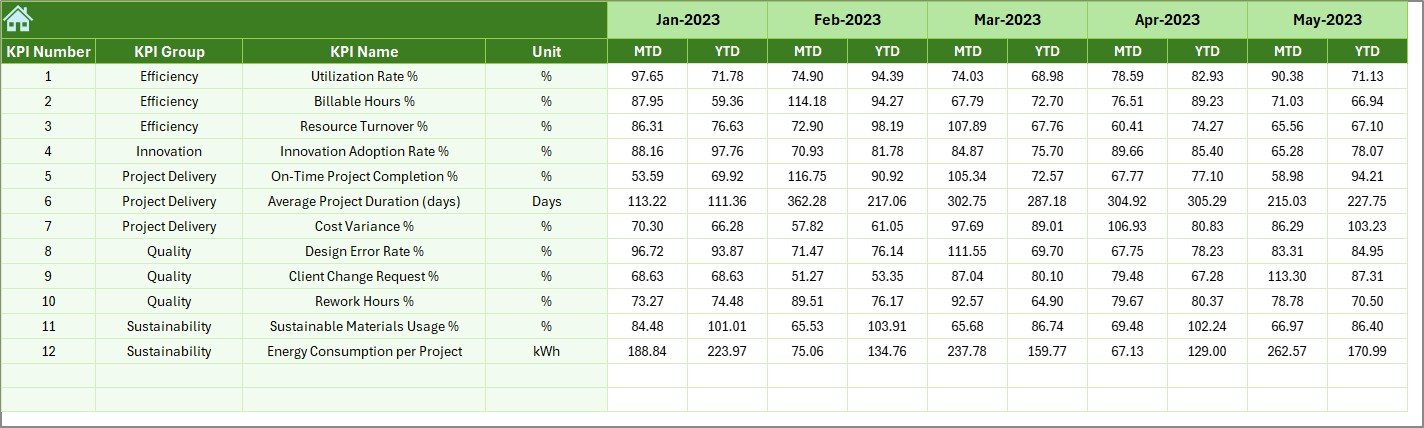
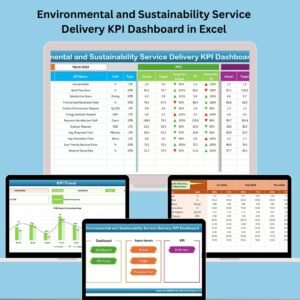
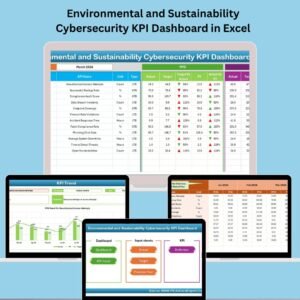
📊 Dashboard Sheet – Visual display of MTD (Month-to-Date) and YTD (Year-to-Date) performance with Actual, Target, and Previous Year comparisons.
-
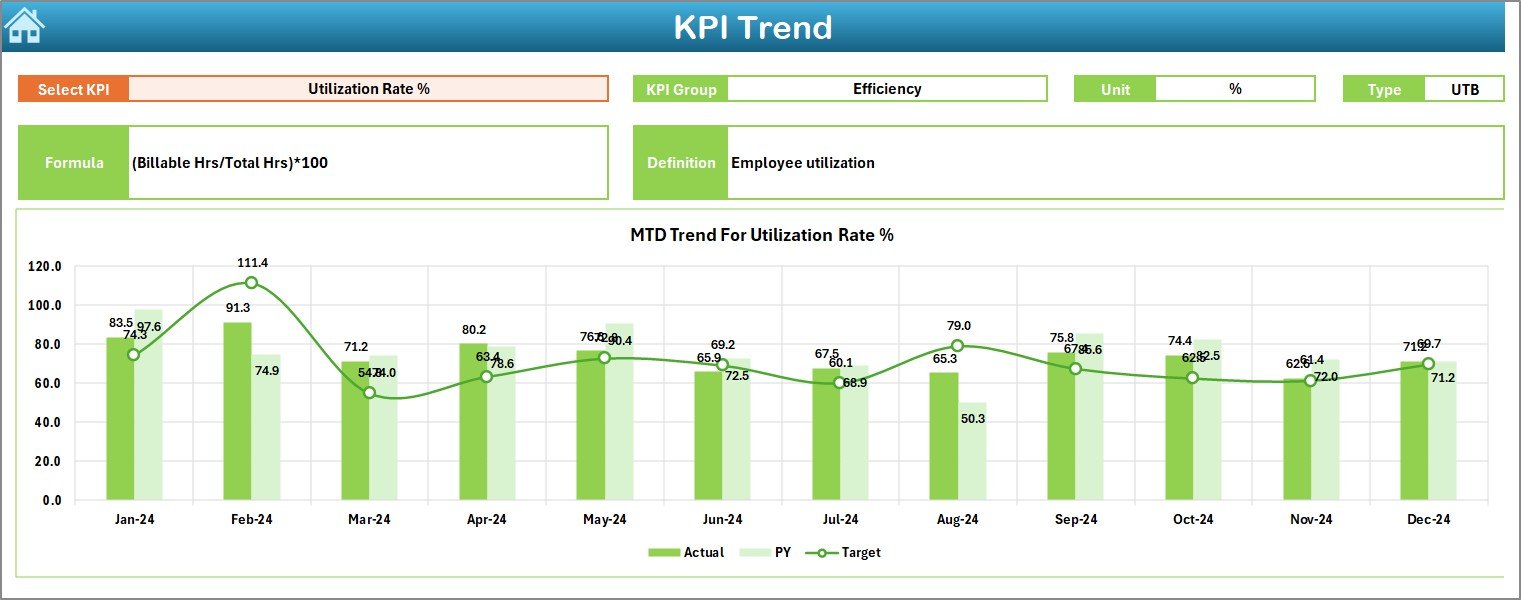
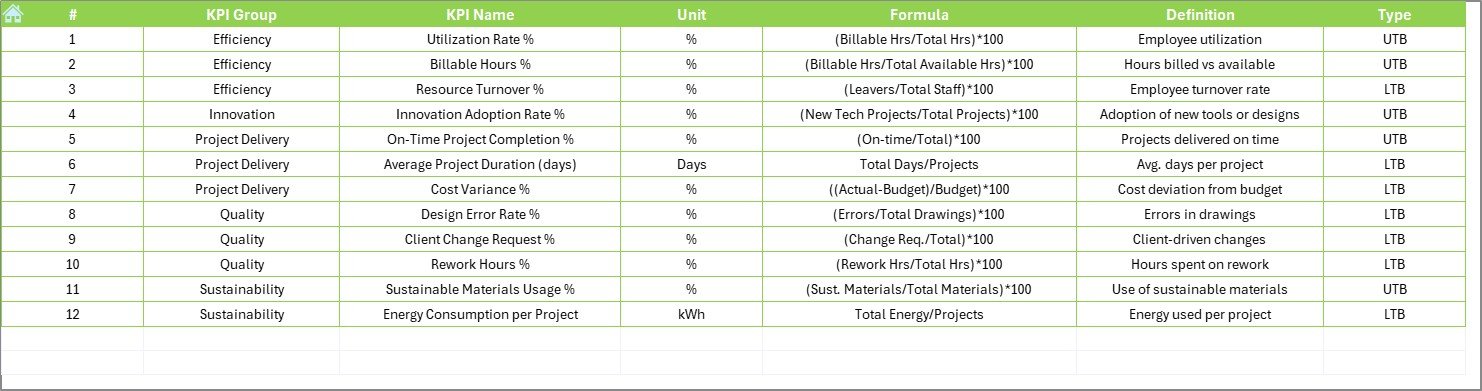
📈 KPI Trend Sheet – Drill into individual KPIs with dropdown selection, viewing formulas, definitions, and performance trends over time.
-
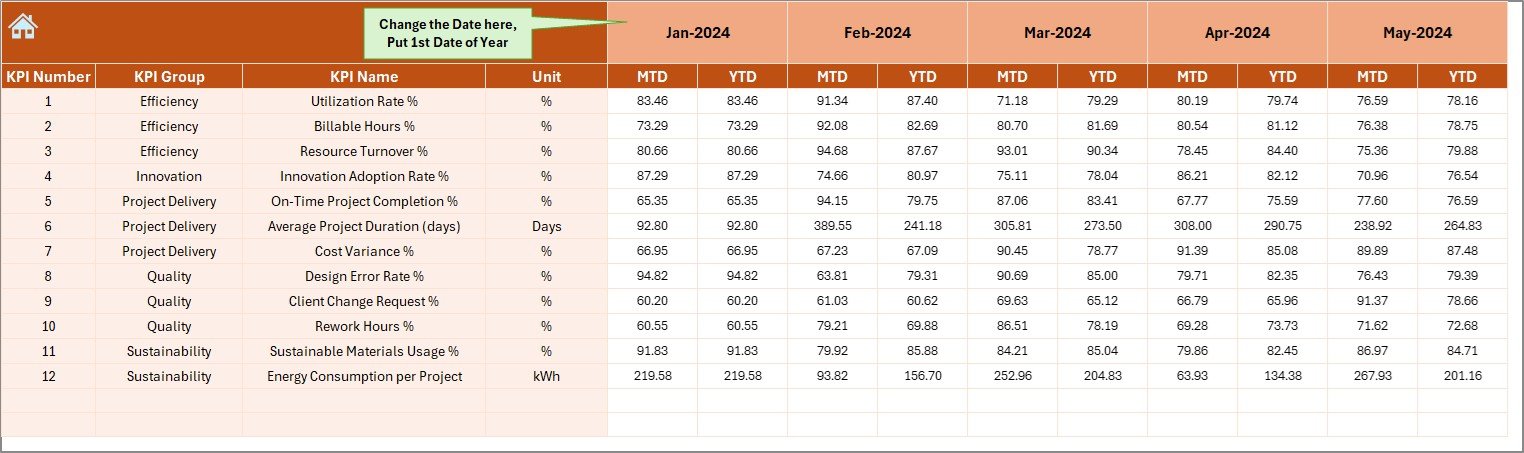
📝 Actual Numbers Input Sheet – Centralized data entry for monthly performance values, feeding automatically into the dashboard.
-
🎯 Target Sheet – Define MTD and YTD goals for each KPI, creating benchmarks for comparison.
-
📅 Previous Year Numbers Sheet – Store last year’s data for YOY (Year-on-Year) comparisons and growth evaluation.
-
📘 KPI Definition Sheet – Standardized reference sheet with KPI names, groups, units, formulas, and definitions for clarity and transparency.
📂 What’s Inside the Dashboard
This pre-built Excel template includes seven structured worksheets:
-
Home Sheet – The index page with navigation buttons.
-
Dashboard Sheet – Main control panel with instant performance insights.
-
KPI Trend Sheet – Trend visualization for selected KPIs.
-
Actual Numbers Input Sheet – Centralized data entry system.
-
Target Sheet – Stores monthly and yearly targets.
-
Previous Year Numbers Sheet – Benchmarking with historical data.
-
KPI Definition Sheet – A master library for KPI details.
🛠 How to Use the Dashboard
-
Set Up KPI Definitions – Define KPIs, formulas, and units in the KPI Definition sheet.
-
Input Actuals – Enter monthly performance values in the Actual Numbers Input sheet.
-
Set Targets – Add MTD and YTD benchmarks in the Target sheet.
-
Compare Performance – Use the Dashboard Sheet to review Actual vs Target and YOY comparisons.
-
Analyze Trends – Select specific KPIs in the KPI Trend sheet for detailed insights.
-
Review Regularly – Update actuals monthly and monitor progress consistently.
👥 Who Can Benefit from This Dashboard
The Architecture and Design KPI Dashboard in Excel is built for:
-
🏗 Architecture Firms – Monitor project timelines, budgets, and client satisfaction.
-
🎨 Design Studios – Evaluate design quality and team efficiency.
-
📋 Project Managers – Track KPIs in real time and identify delays early.
-
💼 Business Owners – Gain visibility into profitability and operational effectiveness.
-
📊 Consultants & Analysts – Provide structured performance insights to clients.
🌟 Advantages
-
✅ Centralized Monitoring – Track all KPIs in one place.
-
✅ Visual Insights – Charts, conditional formatting, and arrows make analysis simple.
-
✅ Cost-Effective – Avoids expensive software by leveraging Excel.
-
✅ Customizable – Add or adjust KPIs as per firm needs.
-
✅ Time-Saving – Automated updates reduce manual effort.
-
✅ Scalable – Suitable for small studios and large firms alike.
🚀 Opportunities for Improvement
-
🔄 Automation with Macros – Reduce manual data entry further.
-
🔗 Integration with Project Tools – Connect with MS Project, AutoCAD, or BIM data.
-
📲 Cloud Collaboration – Enable real-time teamwork via Microsoft 365 or SharePoint.
-
📊 Enhanced Visuals – Combine with Power Query or Power BI for advanced analytics.
📌 Click here to read the Detailed blog post
Visit our YouTube channel to learn step-by-step video tutorials


Reviews
There are no reviews yet.