Managing aerospace and defence operations is never simple. Programs are complex, budgets are massive, timelines are strict, and even small mistakes can cause major risks. Yet, many organizations still rely on scattered Excel files, static reports, and manual tracking. As a result, decision-making slows down and visibility remains limited.
That is exactly where the Aerospace and Defence Dashboard in Excel becomes a game-changer. This ready-to-use, professionally designed dashboard converts raw operational and financial data into clear, visual, and actionable insights. Moreover, it empowers leaders to monitor performance, costs, risks, and trends from one centralized Excel file—without relying on expensive BI tools.
Whether you manage defence contracts, aerospace programs, or operational readiness, this dashboard gives you control, clarity, and confidence in every decision.
🔑 Key Features of the Aerospace and Defence Dashboard in Excel
📊 Executive-Level Overview – Instantly view revenue, budget, actual cost, profit, and inventory value through dynamic KPI cards.
🌍 Multi-Dimensional Analysis – Analyze performance by region, facility, risk level, workstream, and program.
📈 Interactive Visuals – Built with pivot-based charts that update automatically as data changes.
⚙️ Operational Readiness Tracking – Monitor MTBF, test pass rates, schedule variance, and readiness percentages.
💰 Budget & Cost Control – Identify cost overruns, budget gaps, and financial risks early.
🧩 Customizable Structure – Easily adapt KPIs, charts, and layouts to match your organization’s needs.
🖥️ 100% Excel-Based – No Power BI, no add-ins, no coding—just Excel.
📦 What’s Inside the Aerospace and Defence Dashboard in Excel
This dashboard contains multiple analytical sheet tabs, each designed to answer a specific business question:
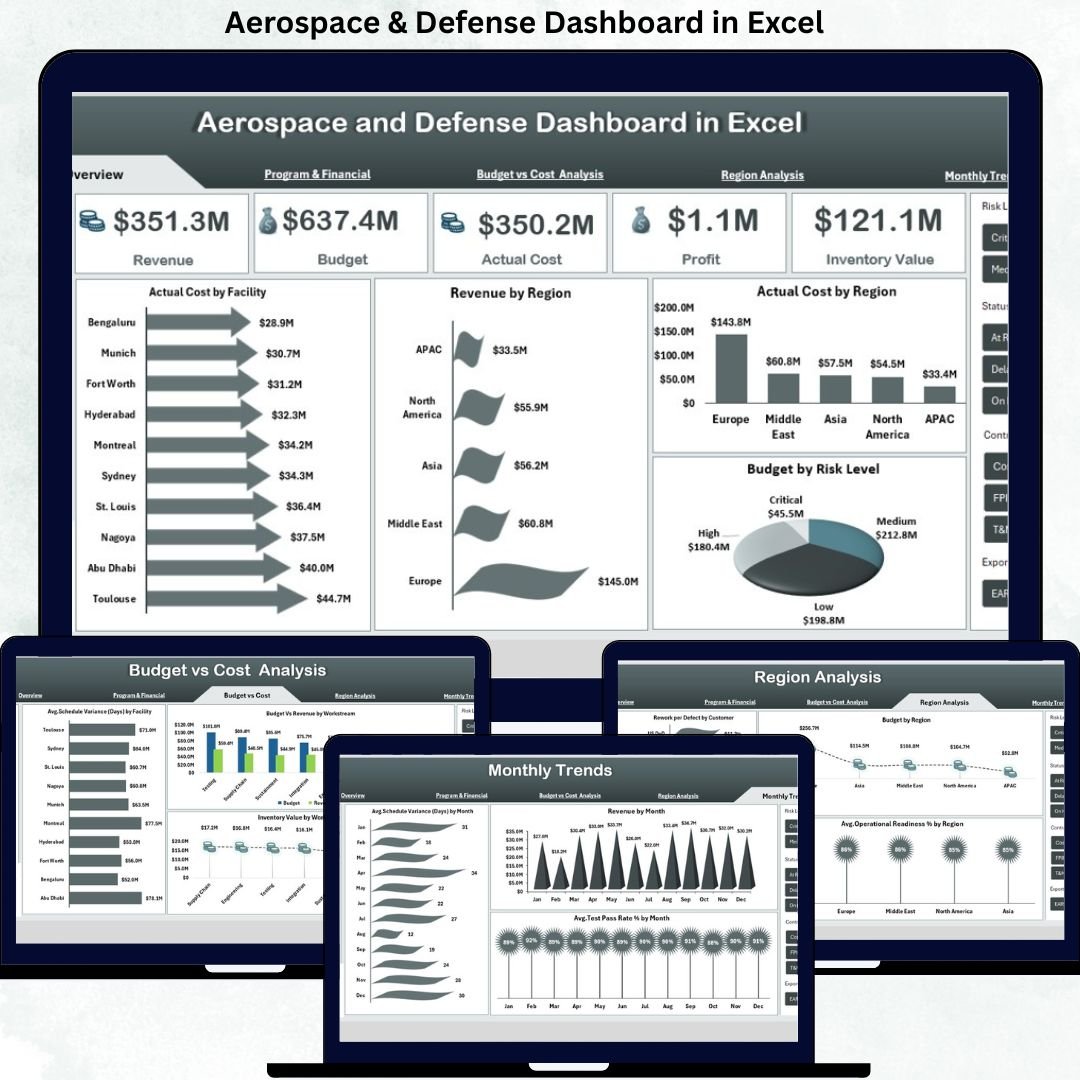
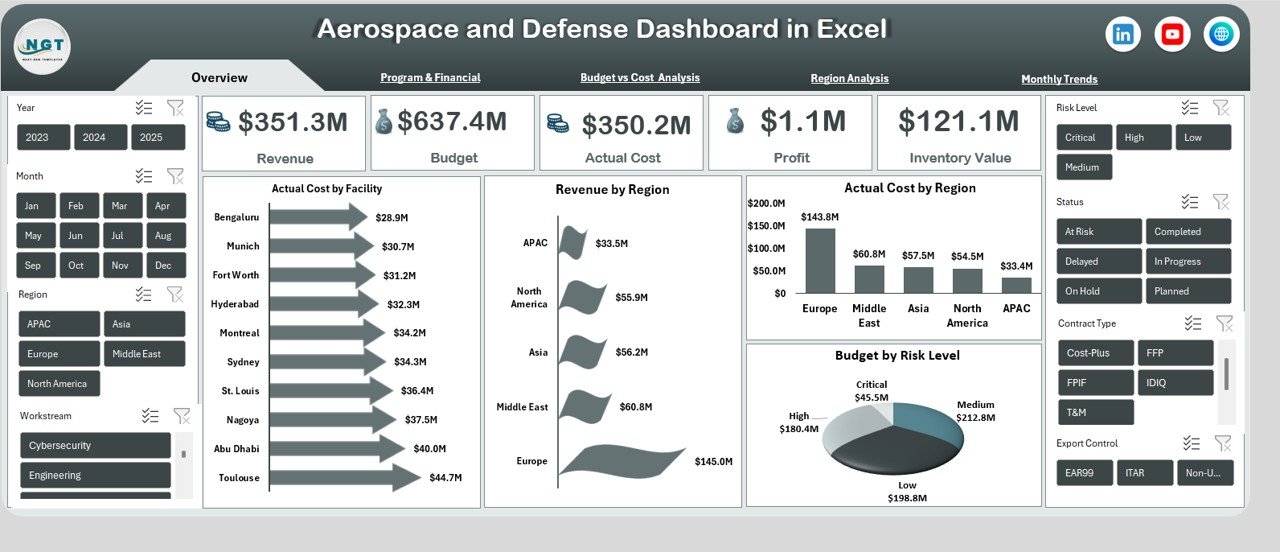
📌 Overview Sheet
Provides a high-level snapshot with KPI cards for Revenue, Budget, Actual Cost, Profit, and Inventory Value. Visuals include Actual Cost by Facility, Revenue by Region, Actual Cost by Region, and Budget by Risk Level.
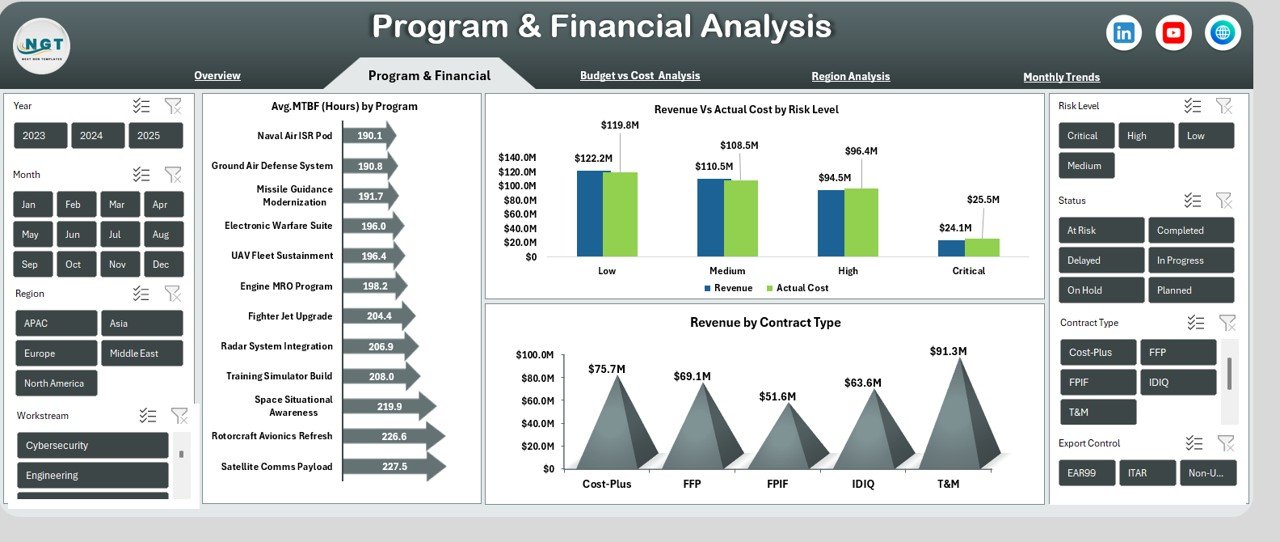
📌 Program & Financial Analysis
Tracks Avg. MTBF (Hours) by Program, Revenue vs Actual Cost by Risk Level, and Revenue by Contract Type to evaluate reliability and profitability.
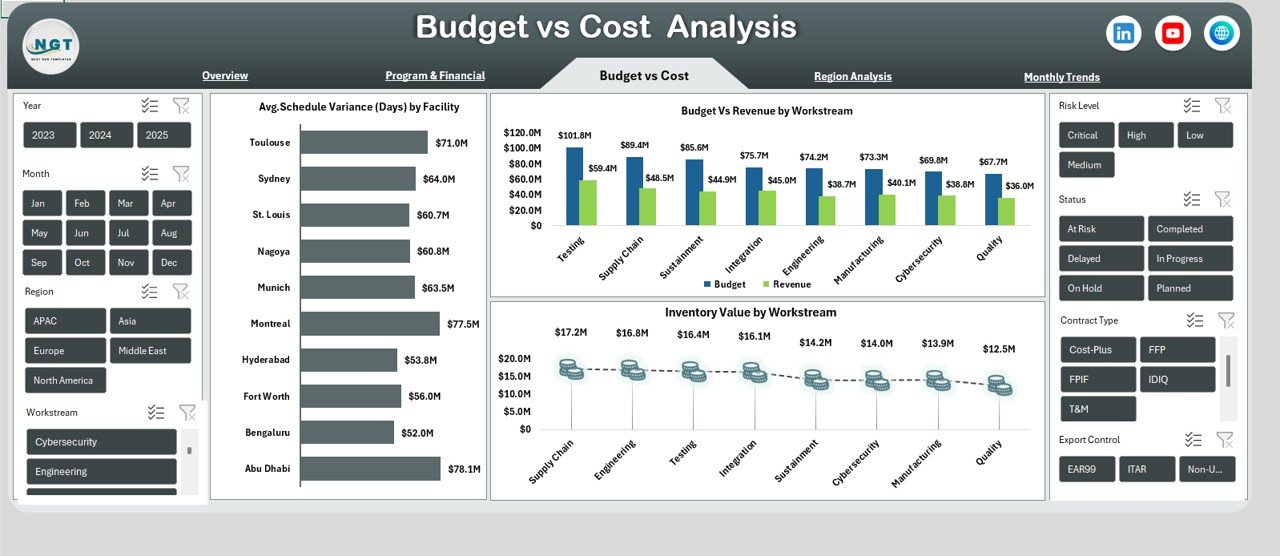
📌 Budget vs Cost Analysis
Highlights Avg. Schedule Variance (Days) by Facility, Budget vs Revenue by Workstream, and Inventory Value by Workstream to control spending.
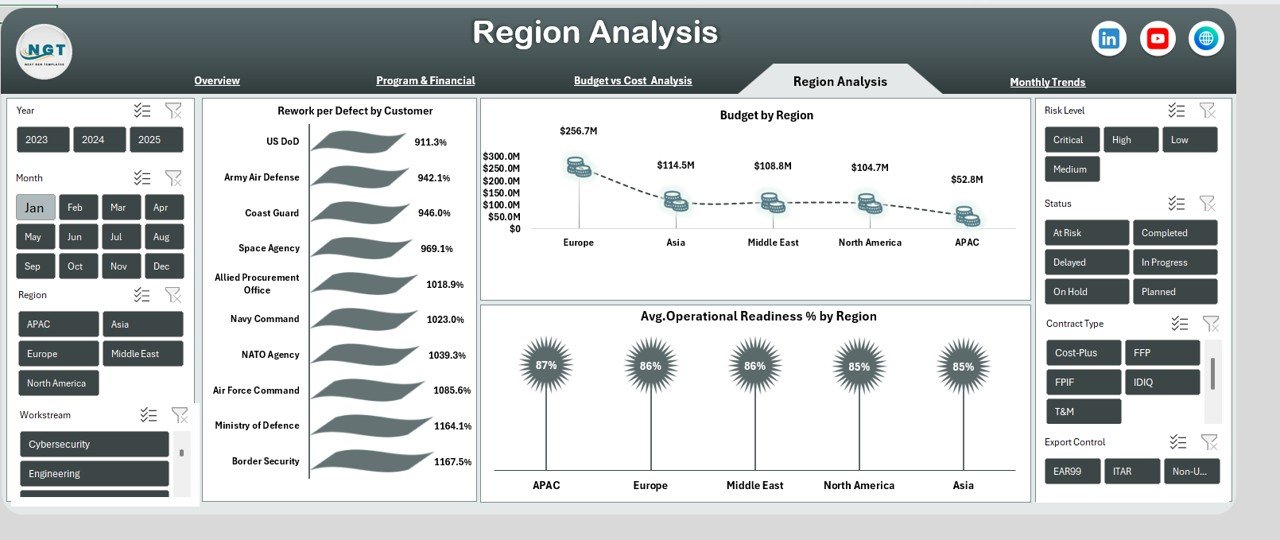
📌 Region Analysis
Compares Rework per Defect by Customer, Budget by Region, and Avg. Operational Readiness % by Region for global performance visibility.
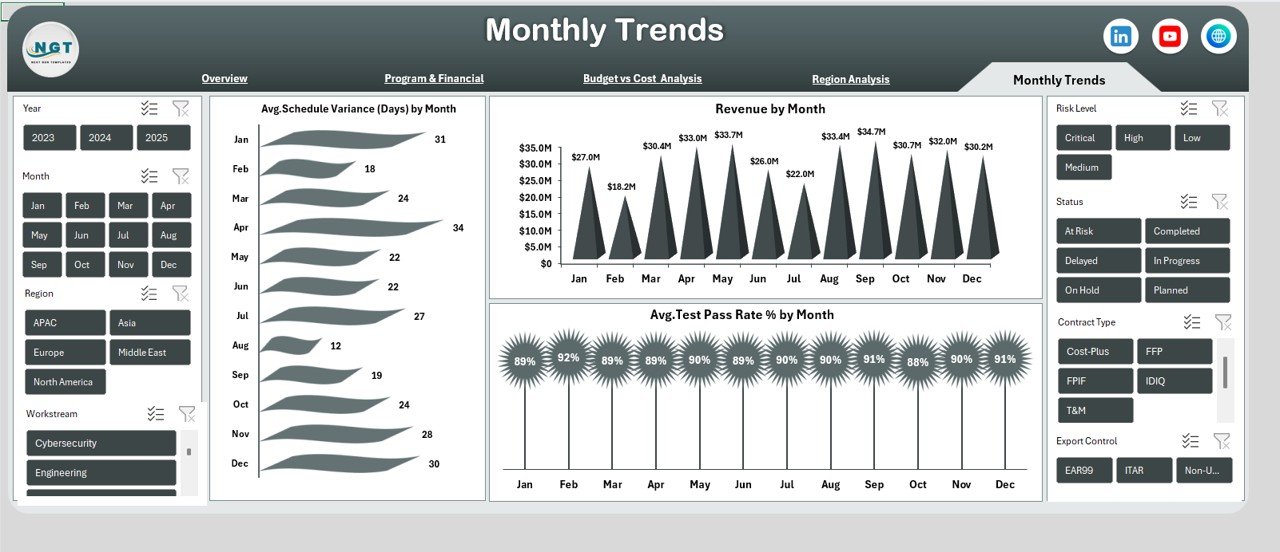
📌 Monthly Trends
Analyzes Avg. Schedule Variance, Revenue, and Avg. Test Pass Rate % by Month to identify patterns and performance improvements.
🛠️ How to Use the Aerospace and Defence Dashboard in Excel
✅ Enter or connect your structured source data
✅ Refresh pivot tables with one click
✅ Use slicers to filter by region, program, facility, or month
✅ Review KPIs and charts during monthly or quarterly meetings
✅ Customize metrics to align with strategic goals
Even users with basic Excel knowledge can use this dashboard effectively.
👥 Who Can Benefit from This Aerospace and Defence Dashboard in Excel
🎯 Aerospace Program Managers
🎯 Defence Financial Analysts
🎯 Operations & Maintenance Teams
🎯 Risk & Compliance Officers
🎯 Senior Executives & Decision-Makers
In short, anyone responsible for performance, cost control, or operational readiness will benefit immediately.
Click here to read the Detailed blog post
Watch the step-by-step video tutorial:
Visit our YouTube channel to learn step-by-step video tutorials:
YouTube.com/@PKAnExcelExpert


Reviews
There are no reviews yet.