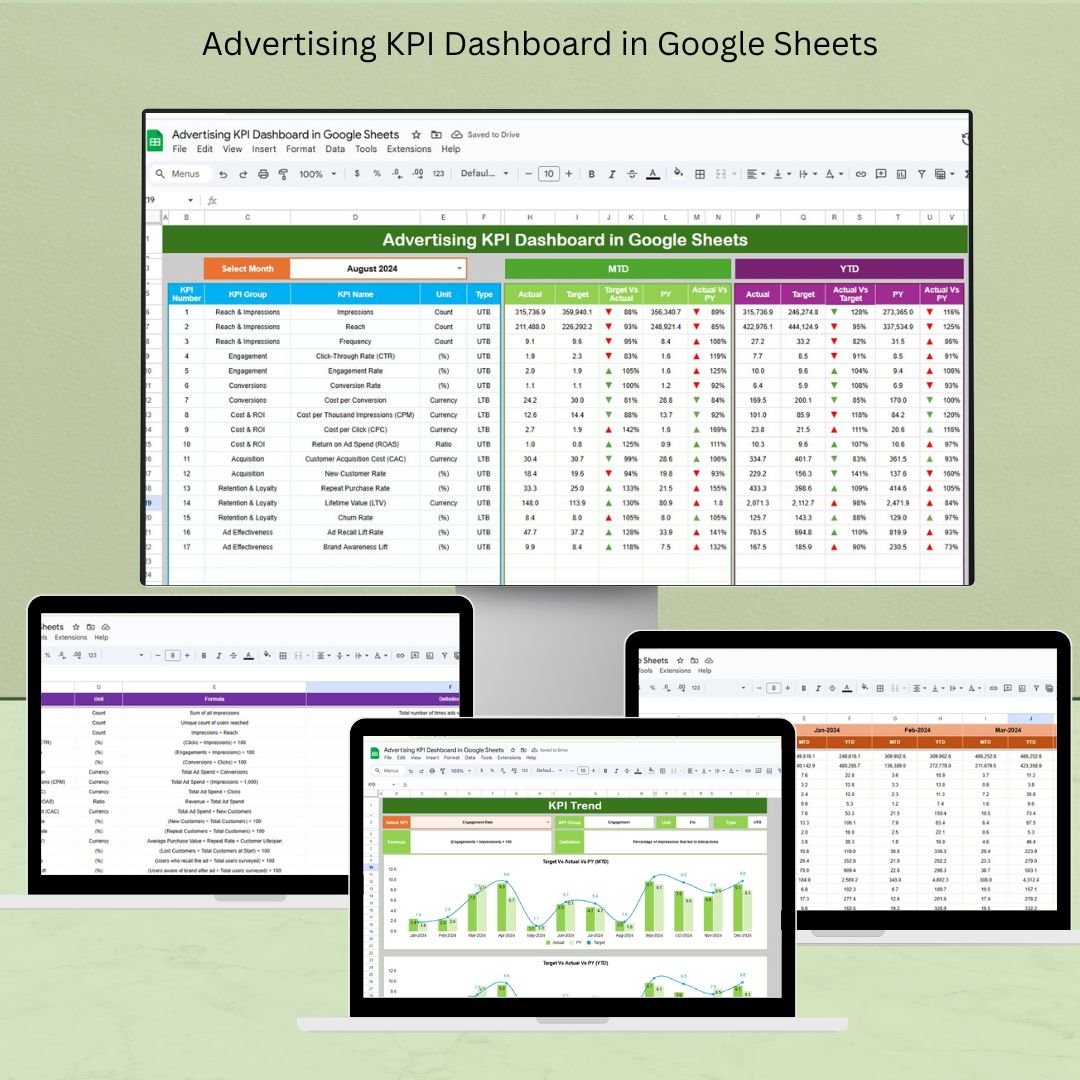
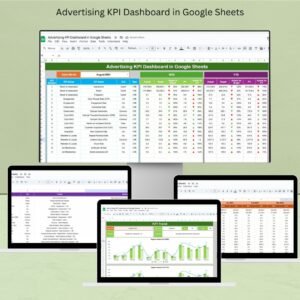
The Advertising KPI Dashboard in Google Sheets is an essential tool for marketing professionals to track, analyze, and visualize key performance indicators (KPIs) across various advertising campaigns. Whether you’re running ads on platforms like Google Ads, Facebook, Instagram, or any other advertising channel, this dashboard provides a structured, easy-to-use format to monitor and optimize your advertising efforts.

Key Features of the Advertising KPI Dashboard in Google Sheets
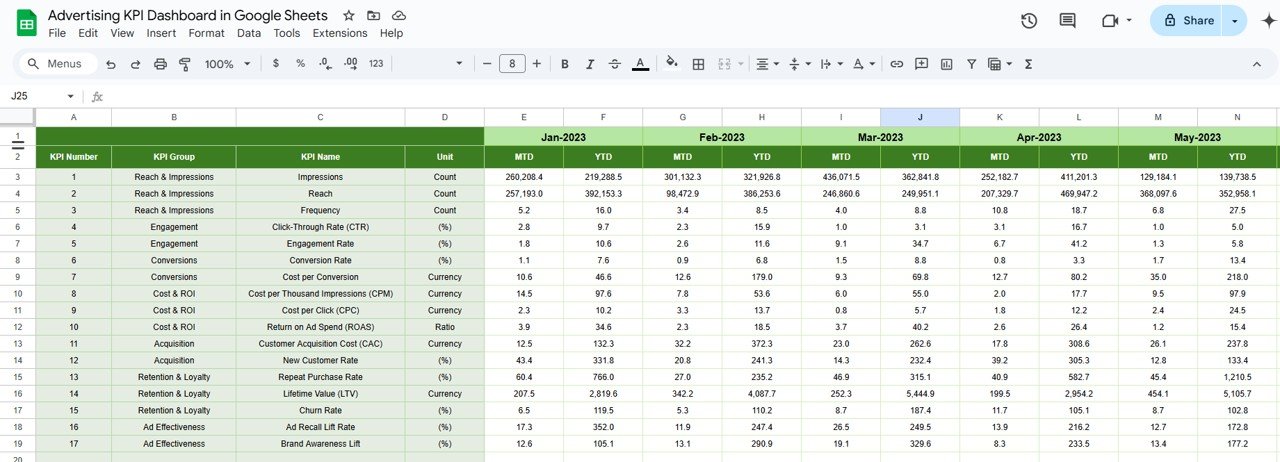
📊 Multi-Channel Performance Tracking
-
All-In-One Dashboard: Track data from various advertising platforms in one place for a comprehensive view of your campaigns.
-
Metrics to Track: Monitor key KPIs such as impressions, clicks, conversions, click-through rates (CTR), cost per click (CPC), and return on ad spend (ROAS).
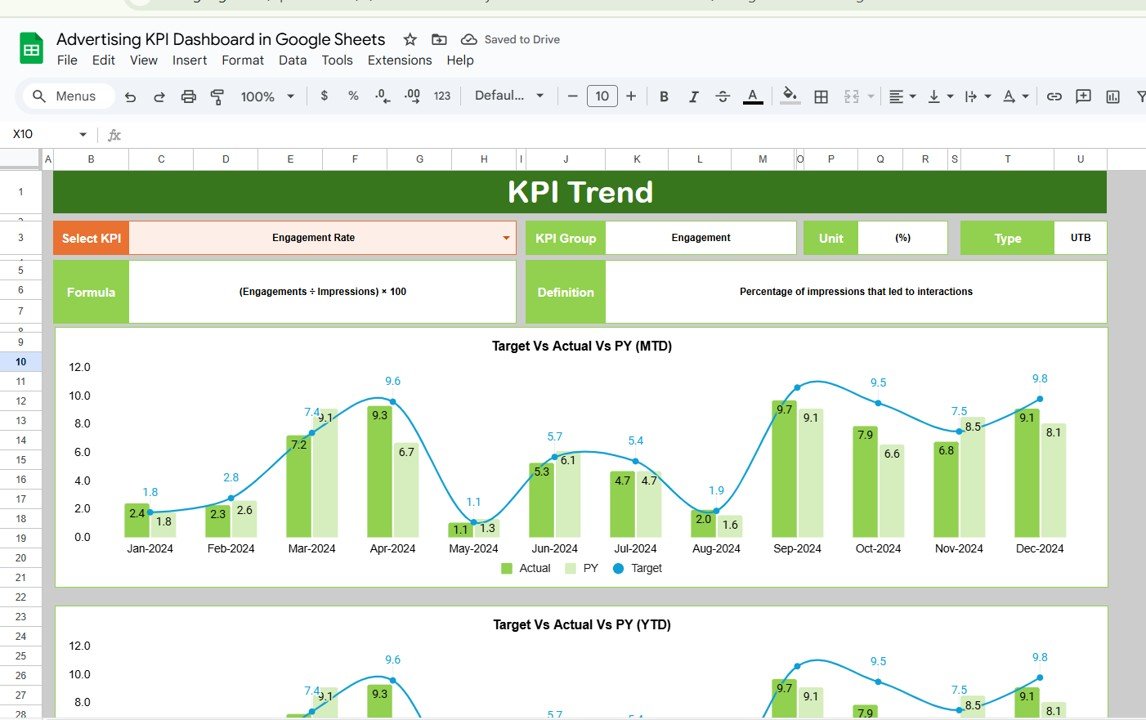
📈 Trend Analysis
-
Performance Visualization: Use built-in charts and graphs to visualize trends, helping identify patterns and areas for campaign optimization.
-
Time Period Comparison: Compare performance across different time periods to assess campaign effectiveness and make adjustments as needed.
💰 Budget Tracking
-
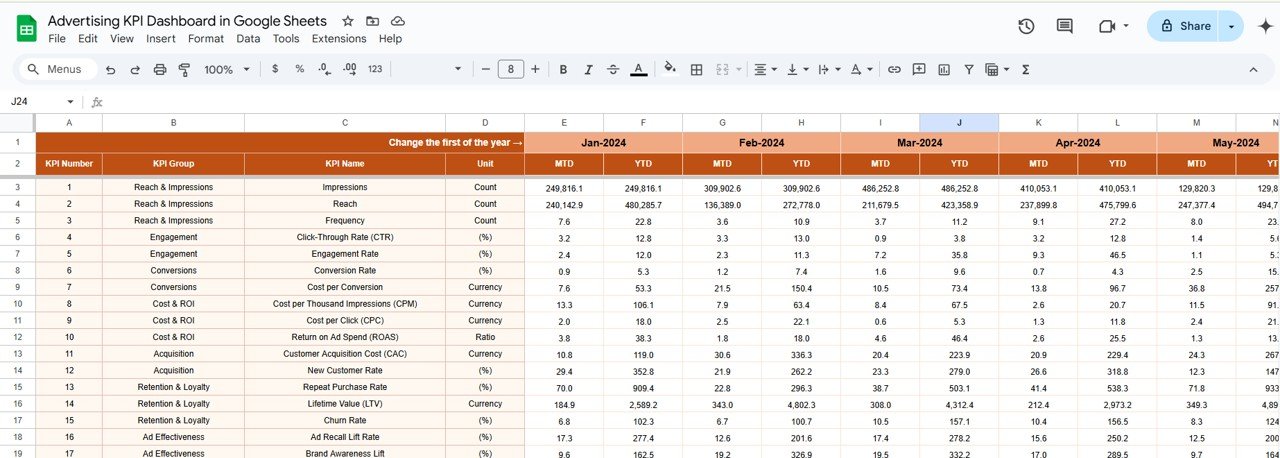
Monitor Ad Spend: Track your ad spend against the allocated budget to ensure cost-effectiveness and avoid overspending.
-
Cost Control: Make adjustments in real-time to optimize spend based on campaign performance and budget allocation.
🔧 Customizable Template
-
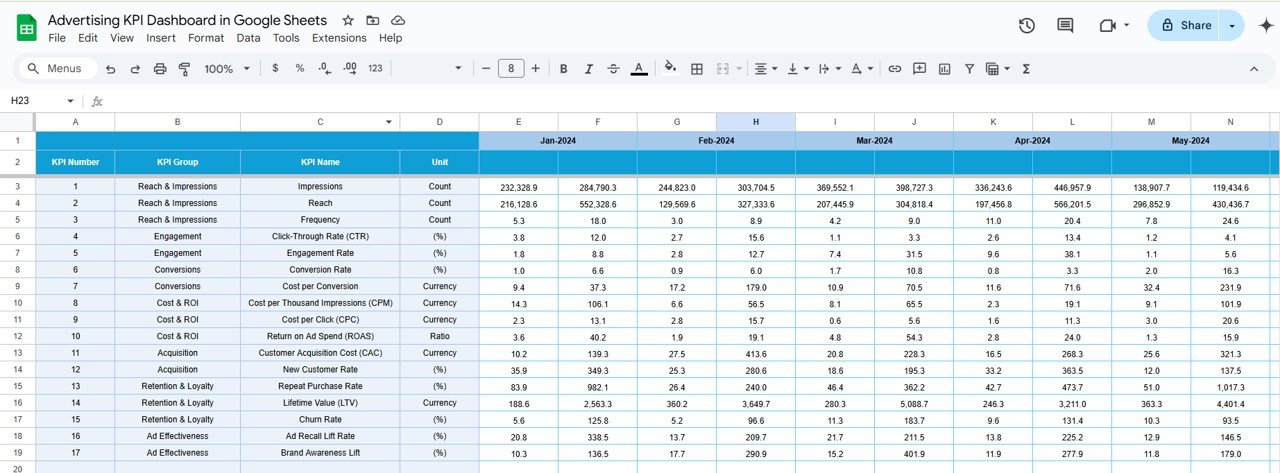
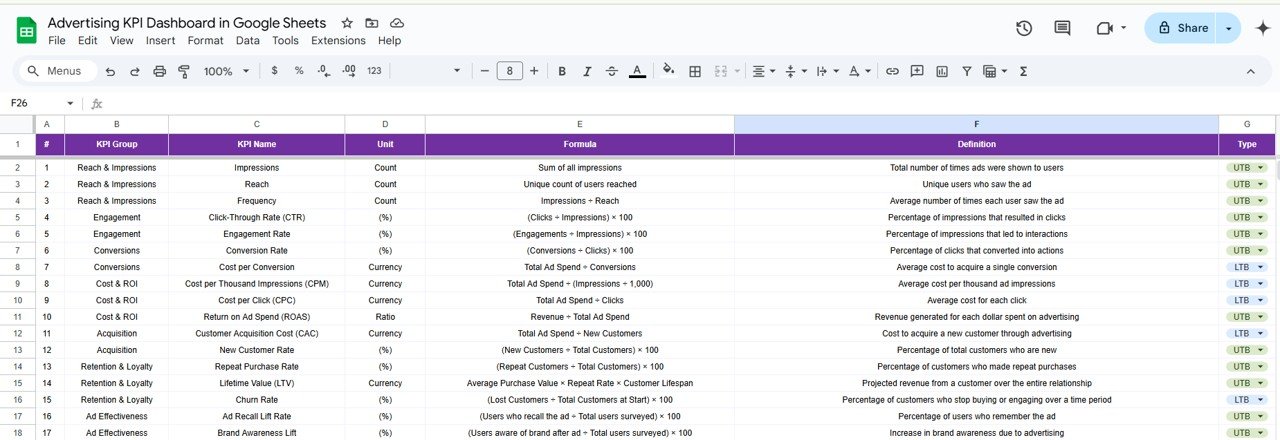
Personalized KPIs: Customize the dashboard to track the KPIs most important to your advertising strategy.
-
Flexibility: Add or remove metrics to meet the specific needs of your campaigns, giving you full control over your data.
Benefits of Using the Advertising KPI Dashboard
✅ Data-Driven Decision Making
Get real-time insights into your campaigns, enabling smarter decisions and more effective advertising strategies.
✅ Maximized ROI
Identify the highest-performing campaigns and allocate resources effectively to maximize your return on investment (ROI).
✅ Improved Efficiency
Automate reporting and data collection processes, saving you time and reducing the chances of errors in manual data entry.
✅ Better Team Collaboration
Easily share your dashboard with team members and stakeholders for transparent and collaborative decision-making.
How to Use the Advertising KPI Dashboard in Google Sheets
-
Download the Template: Download the Advertising KPI Dashboard template and save it to your Google Drive.
-
Input Your Data: Enter your ad campaign metrics from platforms like Google Ads, Facebook, etc., into the appropriate fields.
-
Customize KPIs: Adjust the KPIs according to your goals and requirements, ensuring the dashboard aligns with your advertising strategy.
-
Monitor Trends: Use charts and graphs to track trends and analyze campaign performance over time.
-
Generate Reports: Create easy-to-understand reports for stakeholders to share insights and guide advertising decisions.
By using the Advertising KPI Dashboard in Google Sheets, you can streamline your advertising efforts, track essential metrics, and optimize your campaigns for better results.
Click here to read the Detailed blog post
Advertising KPI Dashboard in Google Sheets
Visit our YouTube channel to learn step-by-step video tutorials
YouTube.com/@NeotechNavigators


Reviews
There are no reviews yet.