Adventure tourism is booming worldwide 🌍. Travelers now seek thrilling experiences like trekking, rafting, scuba diving, desert safaris, ziplining, and mountain biking. Adventure Tourism KPI Dashboard in Excel However, running an adventure tourism business requires more than just organizing tours. Operators must track bookings, revenue, safety metrics, equipment usage, staff performance, and customer satisfaction consistently.
Unfortunately, many adventure tour operators still depend on scattered Excel files and manual tracking. As a result, they miss revenue trends, overlook safety risks, and struggle to identify performance gaps.
Adventure Tourism KPI Dashboard in Excel That is exactly where the Adventure Tourism KPI Dashboard in Excel becomes a game-changing solution.
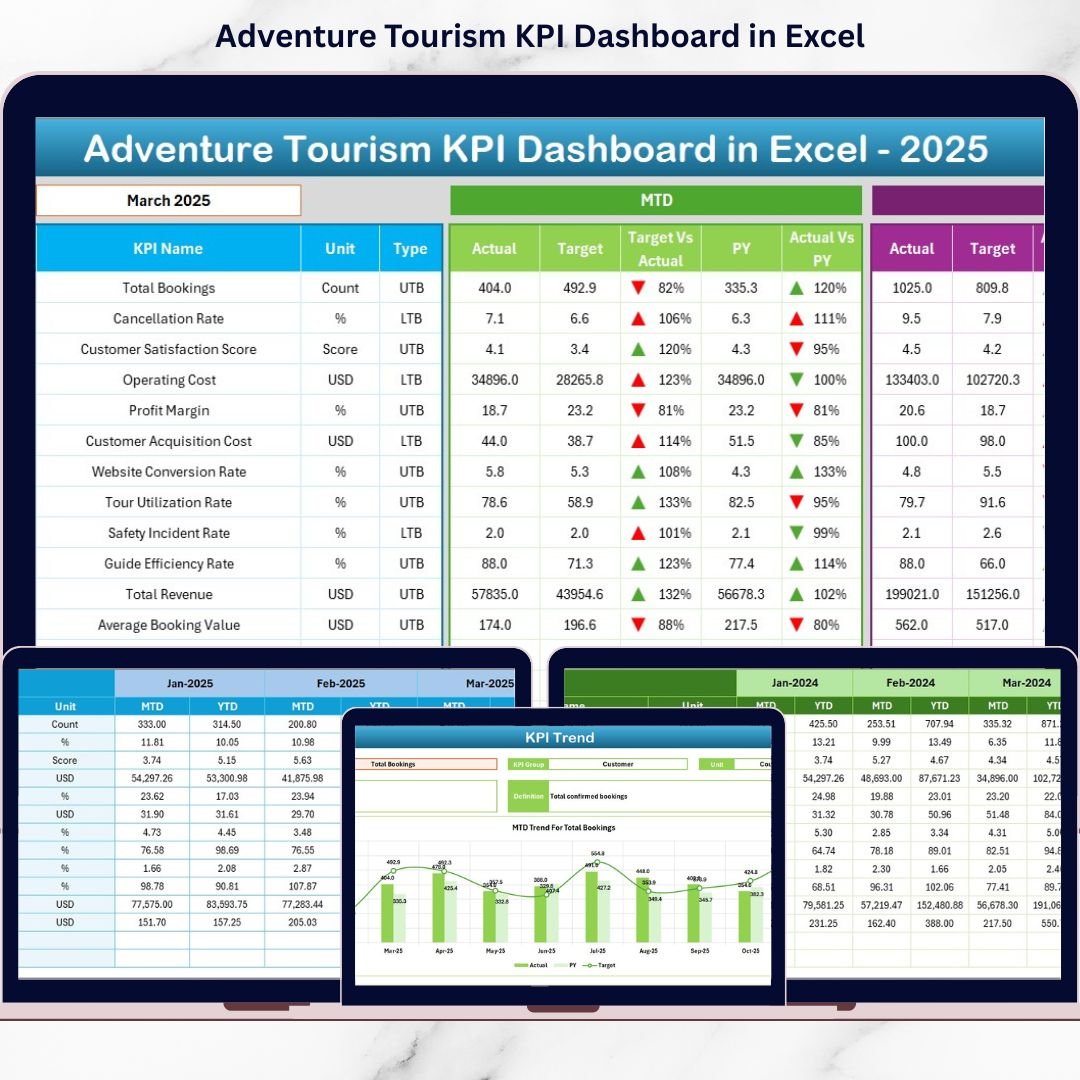
The Adventure Tourism KPI Dashboard in Excel is a ready-to-use, structured performance monitoring system designed specifically for adventure travel businesses. It enables managers to track Month-to-Date (MTD) and Year-to-Date (YTD) performance, compare Target vs Actual, and analyze Previous Year trends — all in one centralized dashboard 📊.
Because it is built entirely in Excel using drop-down menus, conditional formatting, and automated calculations, the dashboard updates instantly when you select a month. As a result, decision-makers gain immediate visibility into business performance.
✅ Key Feature of Adventure Tourism KPI Dashboard in Excel
This dashboard provides powerful performance visibility using structured worksheets and dynamic analysis tools.
🚀 Dynamic Month Selection – Select any month from the drop-down (Cell D3) and the entire dashboard updates automatically.
📊 MTD & YTD Analysis – Track short-term and long-term performance side by side.
🎯 Target vs Actual Comparison – Instantly identify performance gaps.
📈 Previous Year Comparison – Monitor year-over-year growth.
🔺🔻 Conditional Formatting Arrows – Quickly spot improvement or decline.
📉 KPI Trend Analysis – Analyze performance patterns over time.
📘 Structured KPI Definitions – Maintain clarity and consistency across teams.
Because everything connects dynamically, managers save time and focus on insights rather than manual reporting.
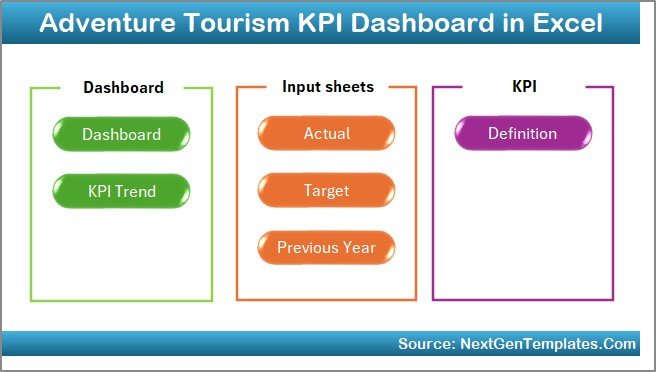
📦 What’s Inside the Adventure Tourism KPI Dashboard in Excel
This ready-to-use template includes 7 structured worksheets; each designed for specific functionality:
🏠 1️⃣ Home Sheet – Navigation Center
-
6 quick navigation buttons
-
Clean index layout
-
Easy sheet switching
This improves usability, even for non-technical users.
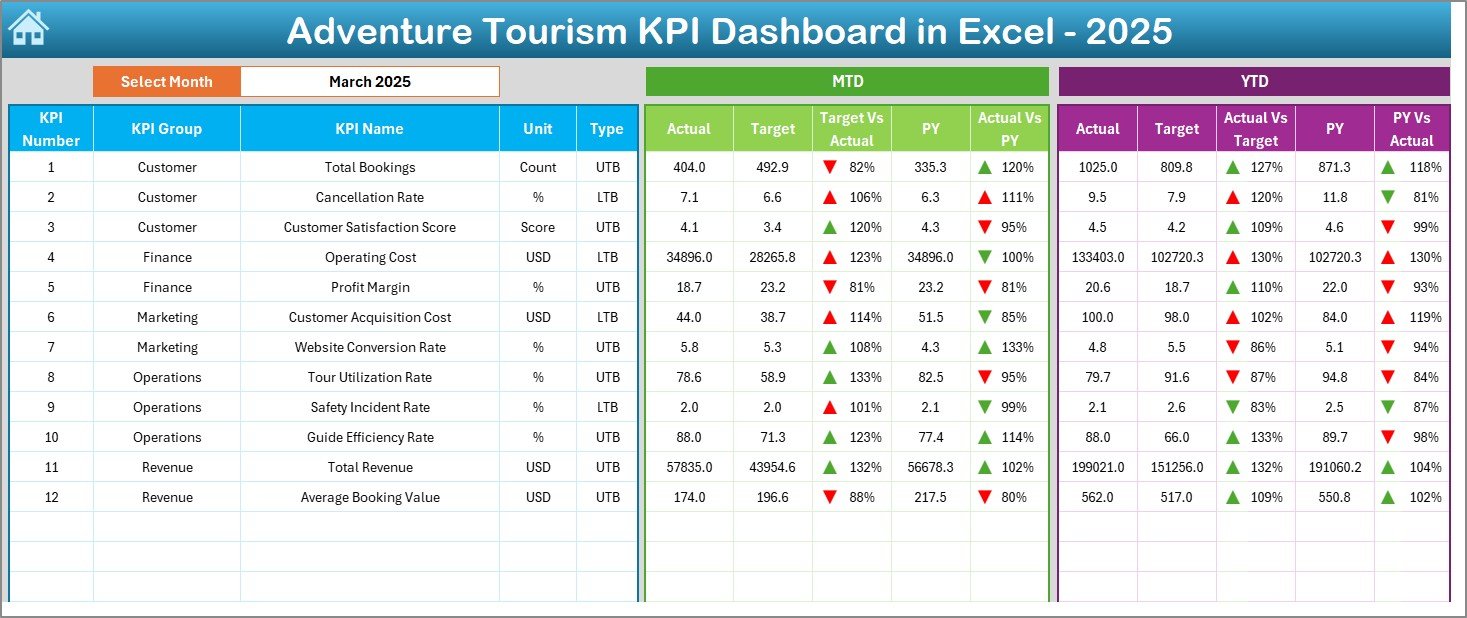
📊 2️⃣ Dashboard Sheet – Main Performance Overview
This sheet displays:
MTD Section
-
MTD Actual
-
MTD Target
-
Previous Year MTD
-
Target vs Actual variance
-
PY vs Actual variance
YTD Section
-
YTD Actual
-
YTD Target
-
YTD Previous Year
Up and down arrows highlight growth or decline instantly.
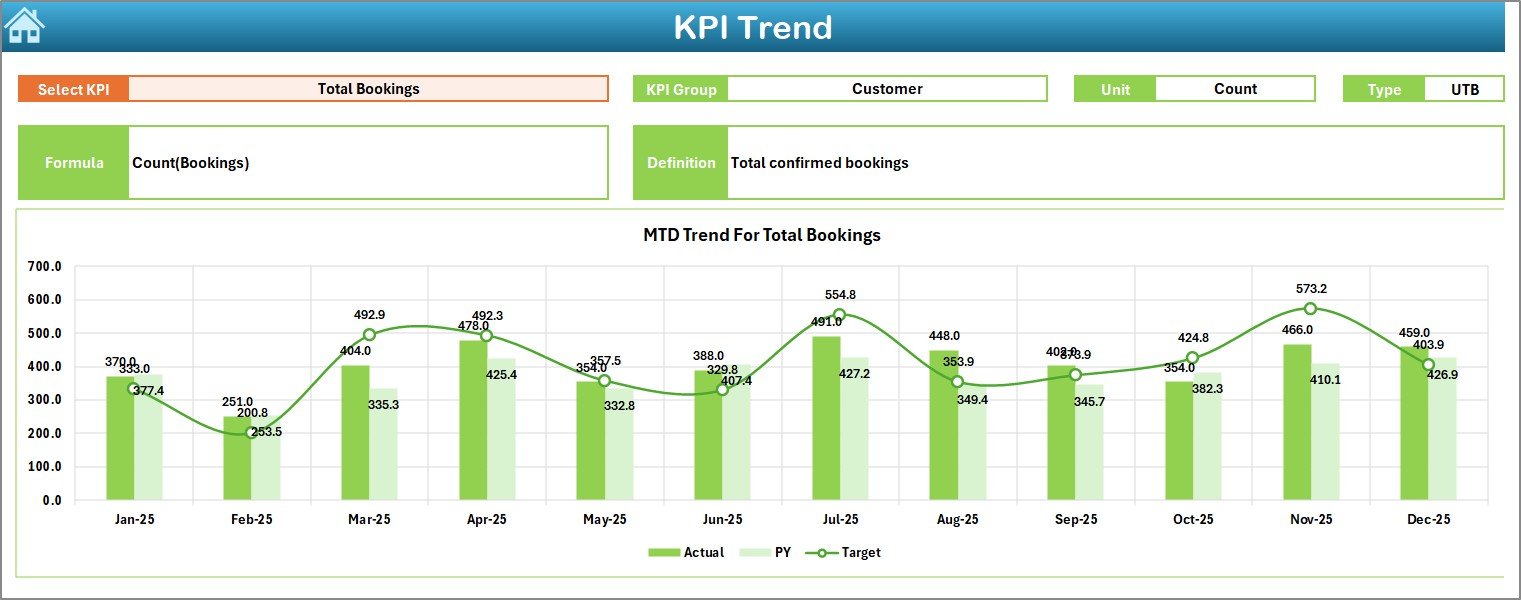
📈 3️⃣ KPI Trend Sheet – Detailed KPI Analysis
-
KPI selection dropdown (Cell C3)
-
Displays KPI Group, Unit, Type (LTB/UTB)
-
Shows KPI Formula & Definition
-
MTD Trend Chart
-
YTD Trend Chart
This sheet helps managers study trends rather than single-month data.
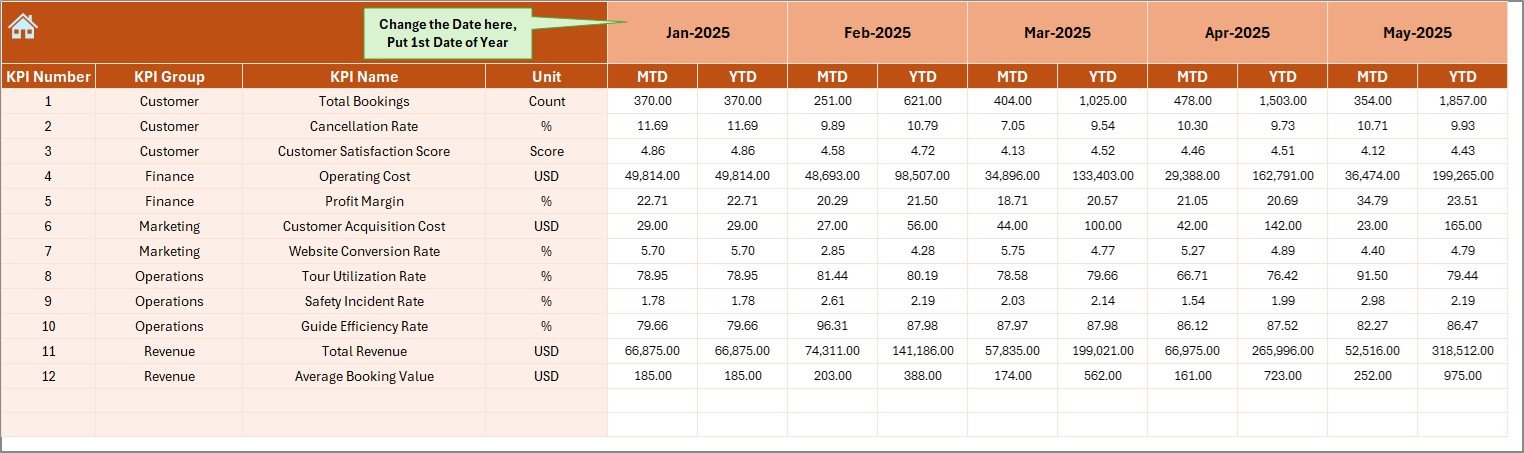
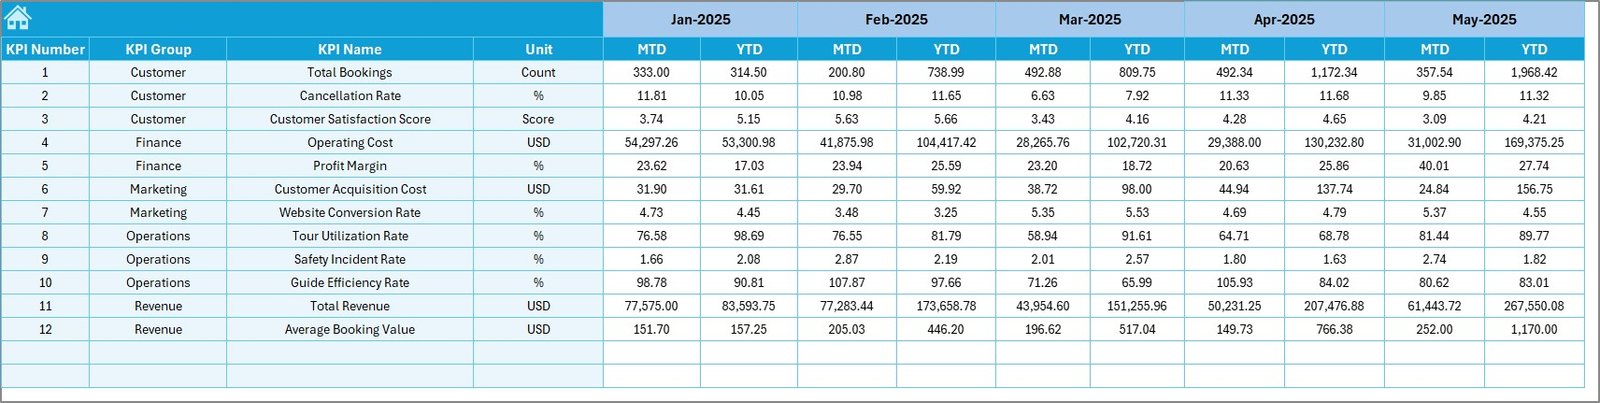
🧾 4️⃣ Actual Numbers Input Sheet
-
Enter first month of the year (Cell E1)
-
Input MTD & YTD actual values
-
Centralized data entry
🎯 5️⃣ Target Sheet
-
Enter monthly MTD targets
-
Enter YTD targets
-
Drive variance calculations automatically
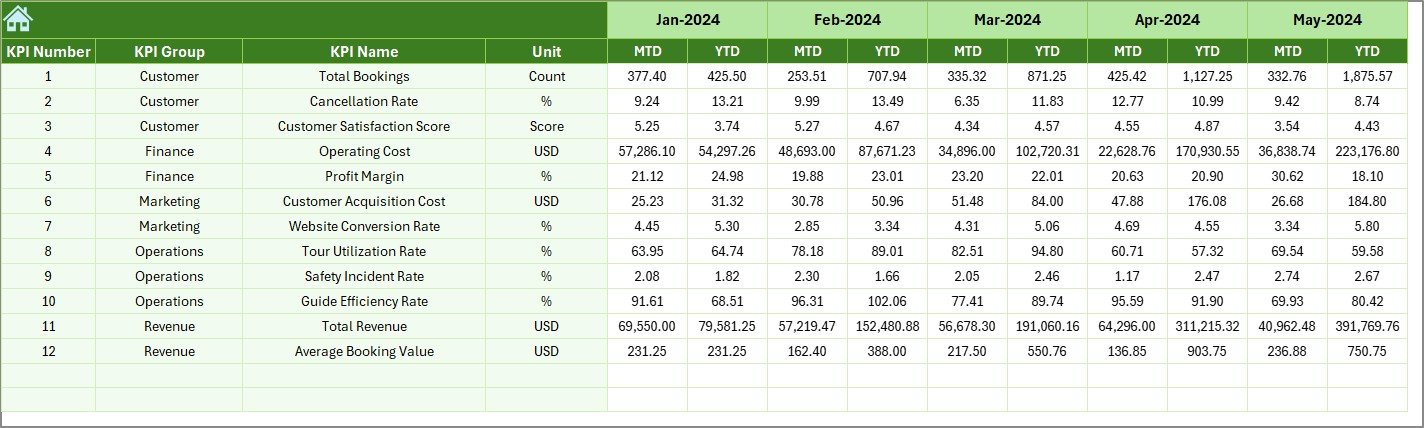
📅 6️⃣ Previous Year Numbers Sheet
-
Store last year’s data
-
Enable year-over-year analysis
-
Identify seasonal trends
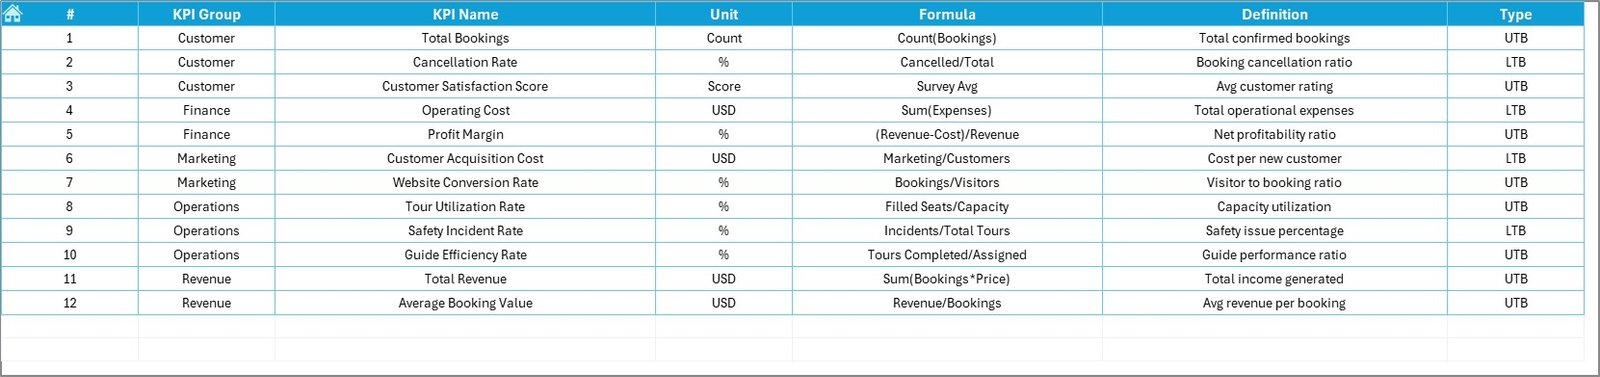
📘 7️⃣ KPI Definition Sheet
-
KPI Name
-
KPI Group
-
Unit
-
Formula
-
Definition
Ensures everyone understands each KPI clearly.
🛠️ How to Use the Adventure Tourism KPI Dashboard in Excel
Using the dashboard is simple:
-
Define KPIs in the KPI Definition Sheet.
-
Enter previous year data.
-
Set monthly targets.
-
Input MTD & YTD actual numbers.
-
Select the month in the Dashboard sheet.
-
Review performance indicators and trends.
Because calculations update automatically, the dashboard delivers real-time insights without manual effort.
👥 Who Can Benefit from This Adventure Tourism KPI Dashboard
This dashboard is ideal for:
🏕️ Adventure Tour Operators
🧗 Activity Managers
🧑💼 Operations Managers
💰 Finance Teams
🛟 Safety Compliance Officers
📊 Business Analysts
It suits both small adventure startups and large tour operators.
🔗 Click here to read the Detailed blog post
🎥 Visit our YouTube channel to learn step-by-step video tutorials
👉 https://www.youtube.com/@PKAnExcelExpert


