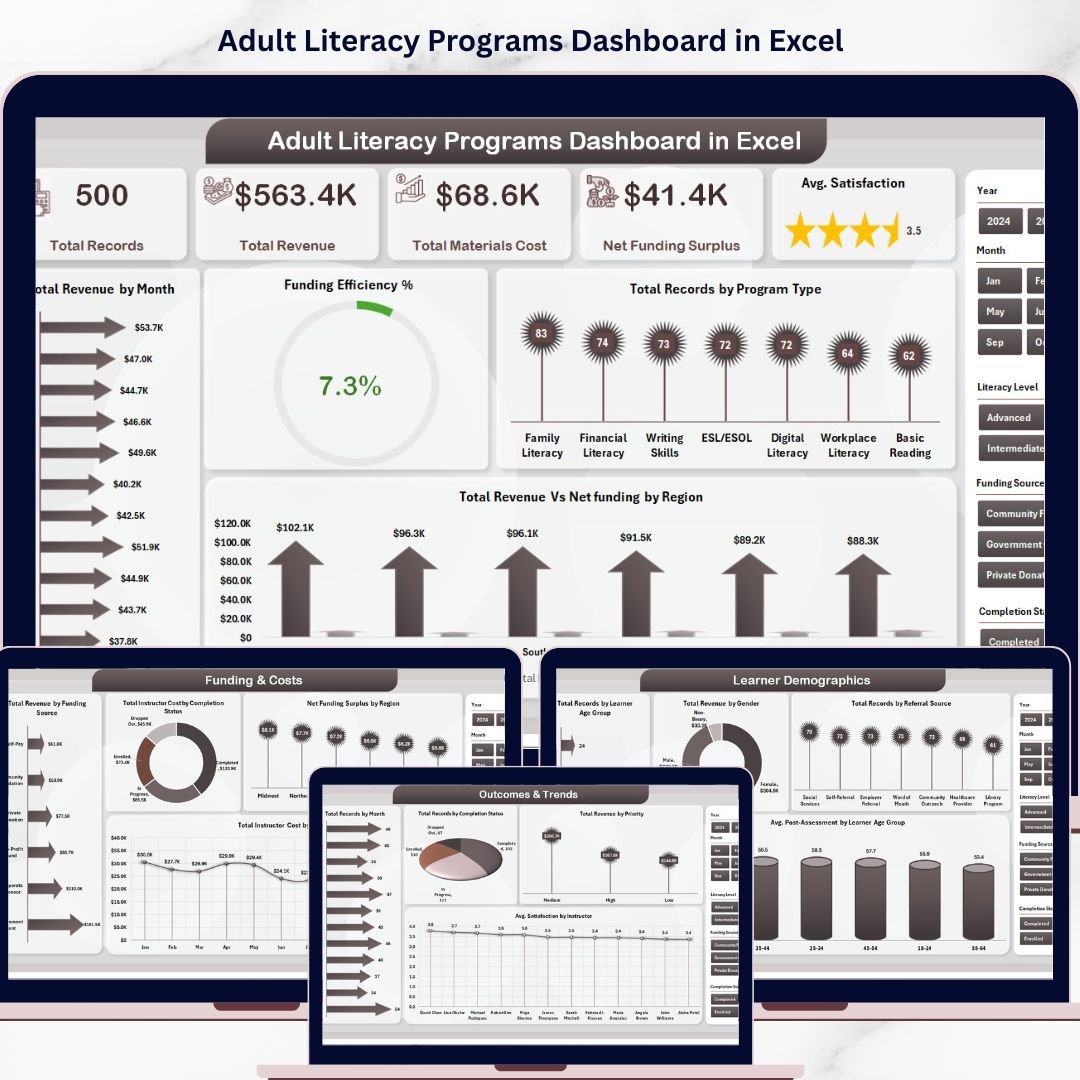


Adult Literacy Programs Dashboard in Excel is a powerful, ready-to-use analytics template designed to help literacy organizations, education departments, NGOs, and community development agencies transform their program data into interactive visual insights. This Excel dashboard tracks key metrics such as total revenue, materials cost, net funding surplus, and average learner satisfaction across multiple program types, literacy levels, regions, and demographics — all from one centralized workbook.
Whether you manage adult basic education, ESL programs, workplace literacy initiatives, or community reading circles, this Excel Dashboard Template gives you complete visibility into program performance, learner demographics, funding efficiency, and outcome trends without requiring advanced technical skills.
🔑 Key Features of Adult Literacy Programs Dashboard in Excel
📊 5 Interactive Dashboard Pages — Overview, Program Analysis, Learner Demographics, Funding & Costs, and Outcomes & Trends provide complete 360-degree visibility into your literacy programs.
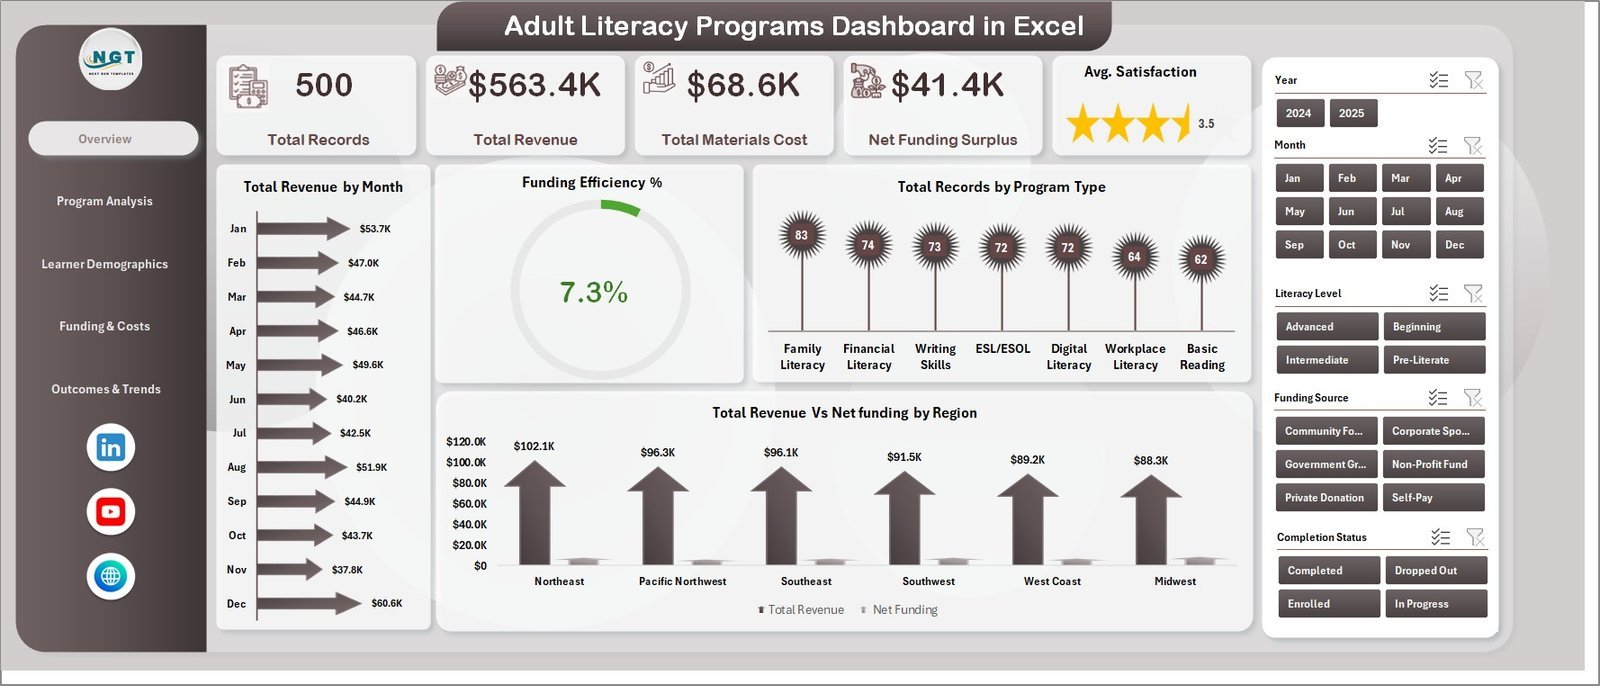
📈 Dynamic KPI Cards — Instantly view Total Records, Total Revenue, Total Materials Cost, Net Funding Surplus, and Avg. Satisfaction at the top of the Overview page.
🔍 Smart Slicers & Filters — Filter your entire dashboard by program type, region, literacy level, gender, referral source, and more with one click.
📅 Monthly Trend Analysis — Track Total Revenue by Month and identify seasonal patterns in enrollment and funding.
🎯 Funding Efficiency Tracking — Evaluate how effectively your programs convert funding into outcomes with the dedicated Funding Efficiency % chart.
🌍 Regional Performance Comparison — Compare Total Revenue vs Net Funding across regions to identify high-performing and underperforming areas.
👥 Learner Demographics Insights — Analyze enrollment by age group, gender, and referral source to optimize outreach strategies.
⚡ Pivot-Powered Architecture — All charts and cards are driven by pivot tables. Just update the data sheet and click Refresh All to update everything.
💰 Cost-Effective Excel Solution — No expensive BI software required. Works in Microsoft Excel 2016 and newer versions.
📦 What’s Inside the Adult Literacy Programs Dashboard in Excel
This professionally designed template includes 7 structured worksheets covering every aspect of adult literacy program analytics:
 Adult Literacy Programs Dashboard in Excel
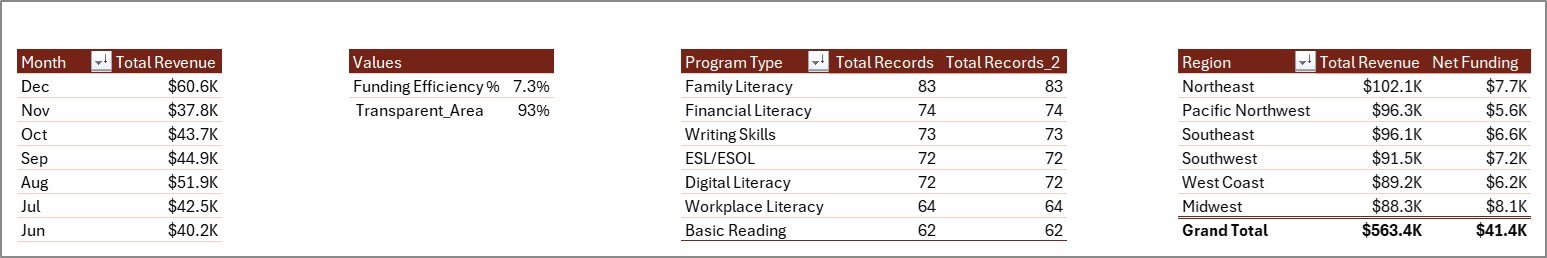
📊 Overview Page — Displays high-level KPI cards including Total Records, Total Revenue, Total Materials Cost, Net Funding Surplus, and Avg. Satisfaction. Charts include Total Revenue by Month showing monthly revenue trends for budget planning, Funding Efficiency % measuring how well funds are being utilized, Total Records by Program Type comparing enrollment across literacy program categories, and Total Revenue vs Net Funding by Region identifying which regions generate the most revenue and retain the highest funding surplus.
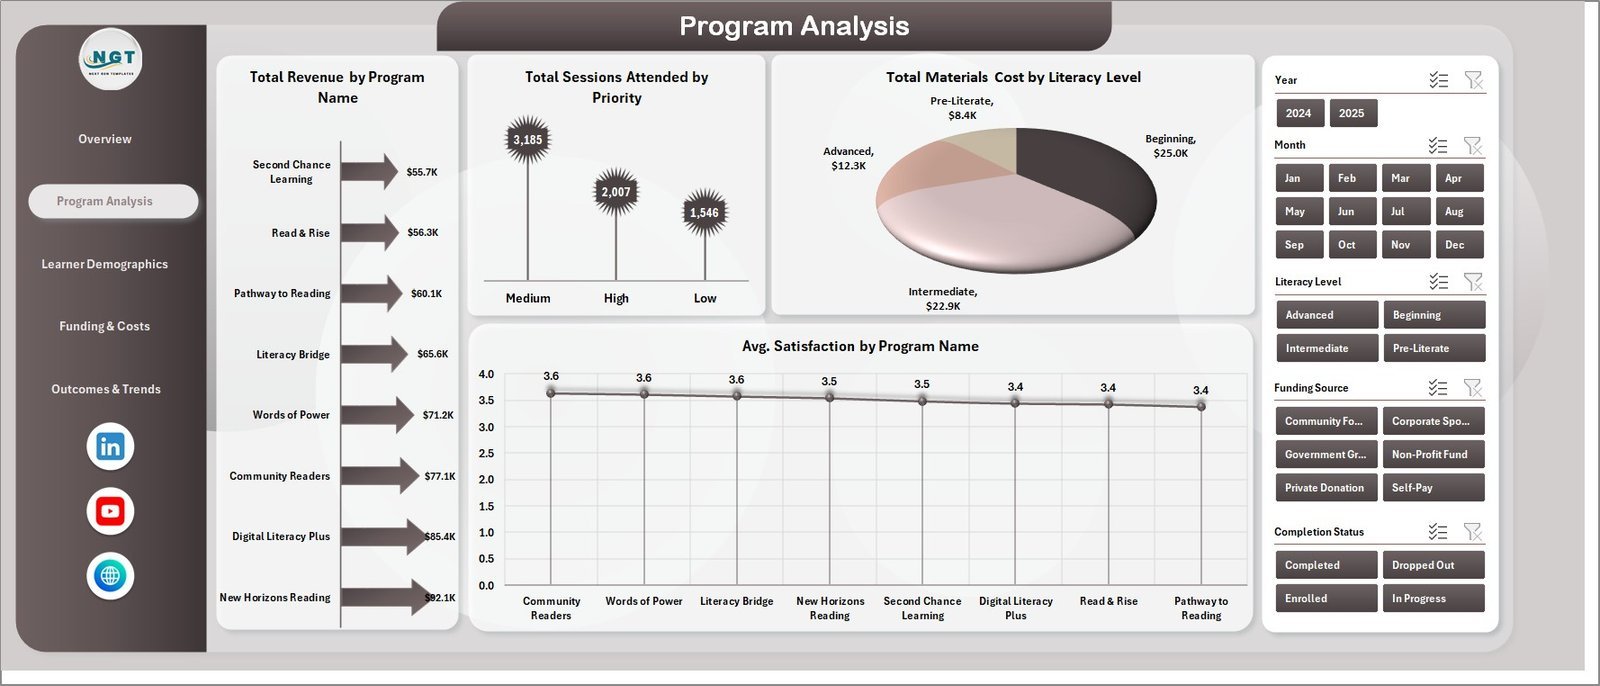
 Program Analysis Page
📈 Program Analysis Page — Deep dive into program-level metrics with Total Revenue by Program Name ranking revenue across individual programs, Total Sessions Attended by Priority highlighting which priority levels drive the most attendance, Total Materials Cost by Literacy Level revealing spending patterns across beginner intermediate and advanced levels, and Avg. Satisfaction by Program Name identifying which programs deliver the highest learner satisfaction.
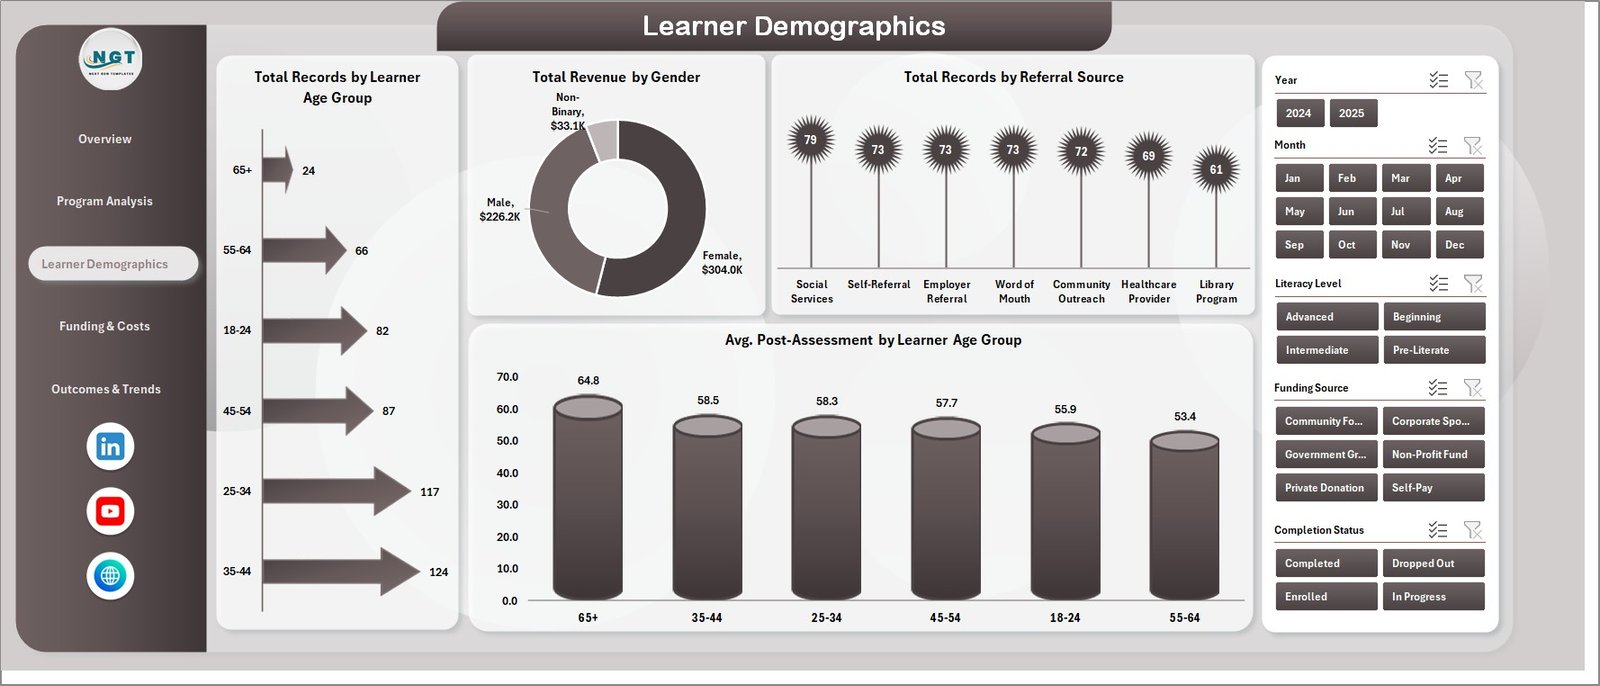 Learner Demographics Page
👥 Learner Demographics Page — Understand your learner population with Total Records by Learner Age Group showing enrollment distribution across age brackets, Total Revenue by Gender analyzing revenue contribution by gender, Total Records by Referral Source tracking where learners come from, and Avg. Post-Assessment by Learner Age Group measuring learning outcomes across demographics.
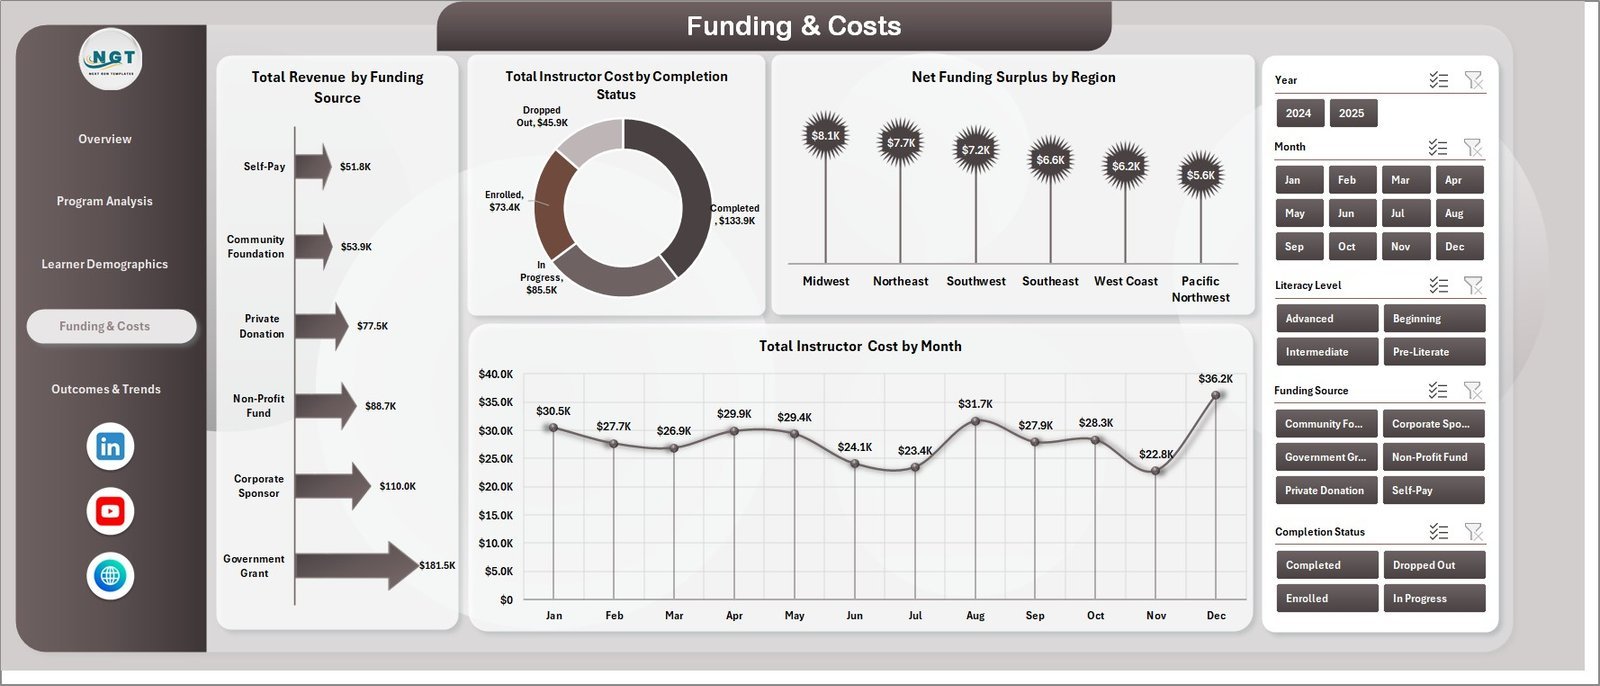
 Funding and Costs Page
💰 Funding & Costs Page — Monitor financial health with Total Revenue by Funding Source showing which funding channels contribute most, Total Instructor Cost by Completion Status comparing costs across completed and ongoing programs, Net Funding Surplus by Region highlighting financially efficient regions, and Total Instructor Cost by Month tracking cost trends over time.
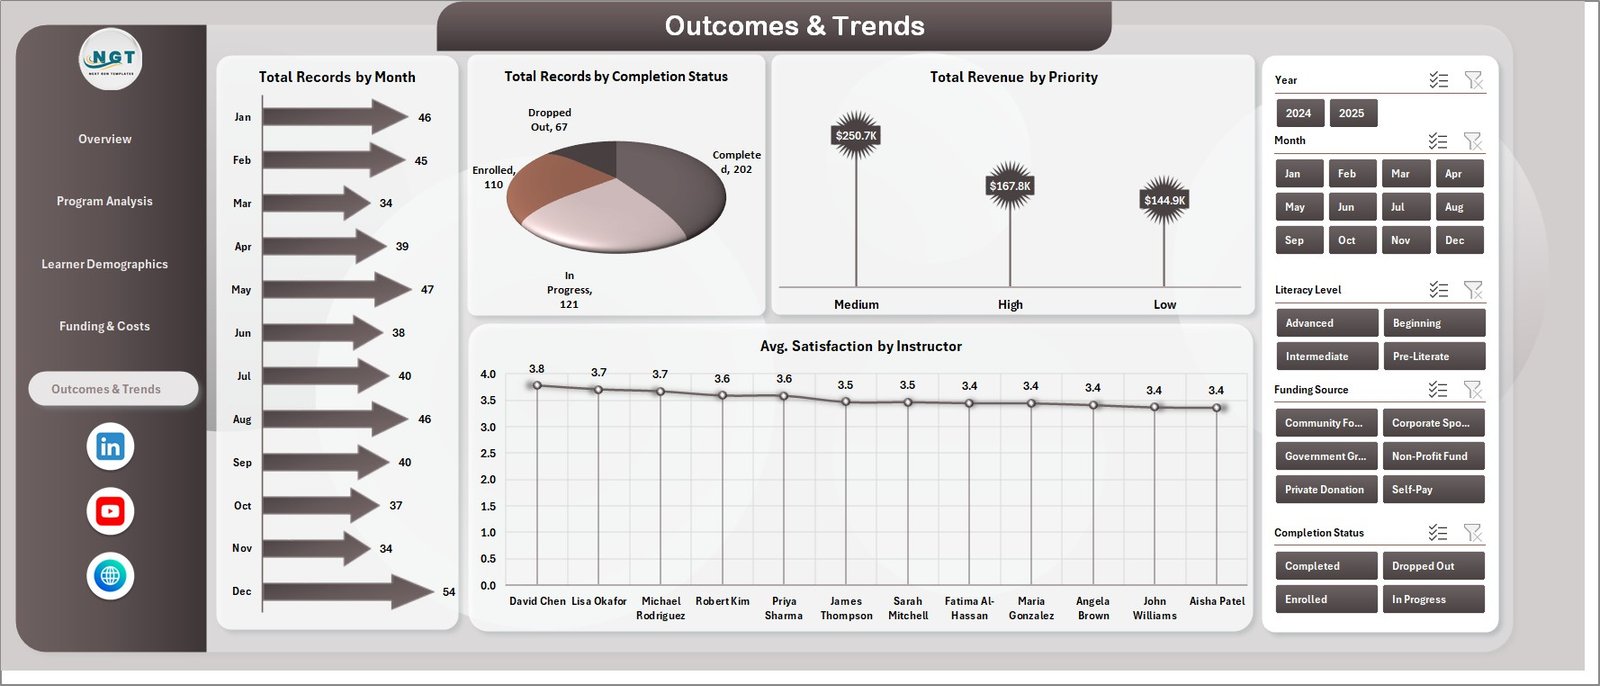 Outcomes and Trends Page
📅 Outcomes & Trends Page — Evaluate program success with Total Records by Month tracking enrollment trends over time, Total Records by Completion Status measuring completion versus dropout rates, Total Revenue by Priority understanding revenue distribution by priority level, and Avg. Satisfaction by Instructor identifying top-performing instructors.
 Data Sheet Tab
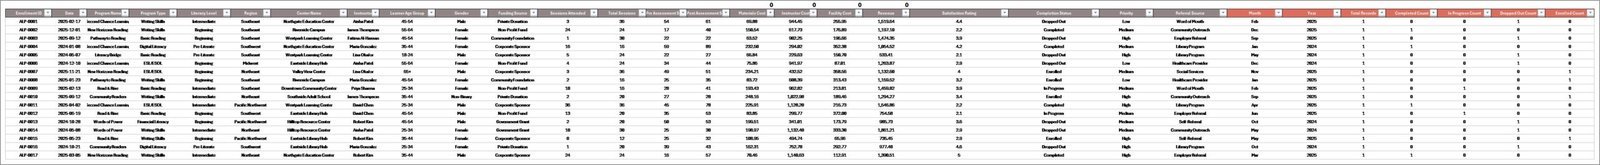
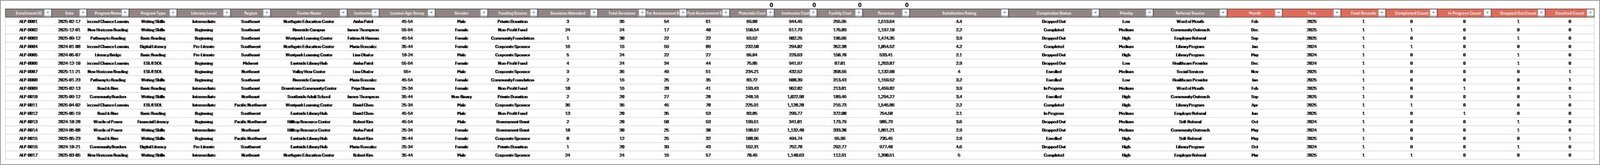
📝 Data Sheet — This is where you enter your program data in the structured format. Replace the sample data with your own records and keep the same column headers.
 Support Sheet Tab
⚙️ Support Sheet — Contains multiple pivot tables that power the entire dashboard dynamically. After updating your data, go to the Data tab in the Excel Ribbon and click Refresh All to update all pivots and charts. You can keep this sheet hidden.
⚙️ How to Use the Adult Literacy Programs Dashboard in Excel
1️⃣ Open the Excel file in Microsoft Excel 2016 or newer.
2️⃣ Navigate to the Data Sheet and replace sample data with your own literacy program records.
3️⃣ Go to the Data tab in the Excel Ribbon and click Refresh All.
4️⃣ All 5 dashboard pages update automatically with your data.
5️⃣ Use slicers on each page to filter by program type, region, literacy level, and more.
6️⃣ Review KPI cards and charts to evaluate performance and identify improvement areas.
👥 Who Can Benefit from This Adult Literacy Programs Dashboard in Excel
📚 Adult Education Centers and Literacy Councils
🏛️ Government Education Departments and Agencies
🌍 International NGOs and Development Organizations
🎓 Community Colleges and Continuing Education Programs
📊 Program Managers and Education Analysts
💰 Grant Managers and Funding Coordinators
👩🏫 Instructors and Training Coordinators
❓ Frequently Asked Questions
What metrics does the Adult Literacy Programs Dashboard track?
The Adult Literacy Programs Dashboard in Excel tracks 5 key metrics including Total Records, Total Revenue, Total Materials Cost, Net Funding Surplus, and Average Satisfaction across 5 interactive dashboard pages covering overview analytics, program analysis, learner demographics, funding and costs, and outcomes and trends.
Do I need advanced Excel skills to use this template?
No. Simply replace the sample data in the Data Sheet with your own records and click Refresh All from the Data tab. All 5 dashboard pages with charts, KPI cards, and slicers update automatically. No VBA or macros are required.
Can I customize the dashboard for my specific literacy programs?
Yes. The dashboard is fully customizable. You can modify program types, regions, literacy levels, and other categories in the Data Sheet. The pivot tables in the Support Sheet will automatically reflect your changes after refreshing.
What Excel versions are compatible with this dashboard?
This template works best with Microsoft Excel 2016 and newer versions including Excel for Microsoft 365. It uses pivot tables, pivot charts, slicers, and conditional formatting — all native Excel features with no VBA dependencies.
How many records can this dashboard handle?
The dashboard is designed to handle hundreds or even thousands of records. As long as your data follows the structured format in the Data Sheet, the pivot tables will aggregate and visualize the data efficiently.
🔗 Explore Related Templates
📊 Educational Nonprofits Dashboard in Power BI — Track nonprofit education program performance with interactive Power BI analytics.
📈 Women Empowerment NGOs KPI Dashboard in Excel — Monitor empowerment program KPIs with MTD, YTD, and target comparison in Excel.
🌍 Rural Development KPI Dashboard in Excel — Track infrastructure, agriculture, and social development KPIs in one interactive Excel workbook.
📖 Click here to read the Detailed Blog Post
🎥 Visit our YouTube channel to learn step-by-step video tutorials
👉 YouTube.com/@NextGenTemplates
Watch the step-by-step video tutorial:
YouTube


Reviews
There are no reviews yet.