4D printing pushes manufacturing beyond traditional boundaries by combining smart materials, advanced design, and time-based transformation. However, innovation alone does not guarantee success. Without clear visibility into performance, cost, quality, and efficiency, even the most advanced 4D printing initiatives lose direction.
That is why the 4D Printing KPI Dashboard in Excel becomes a must-have performance management tool for innovation-driven organizations.
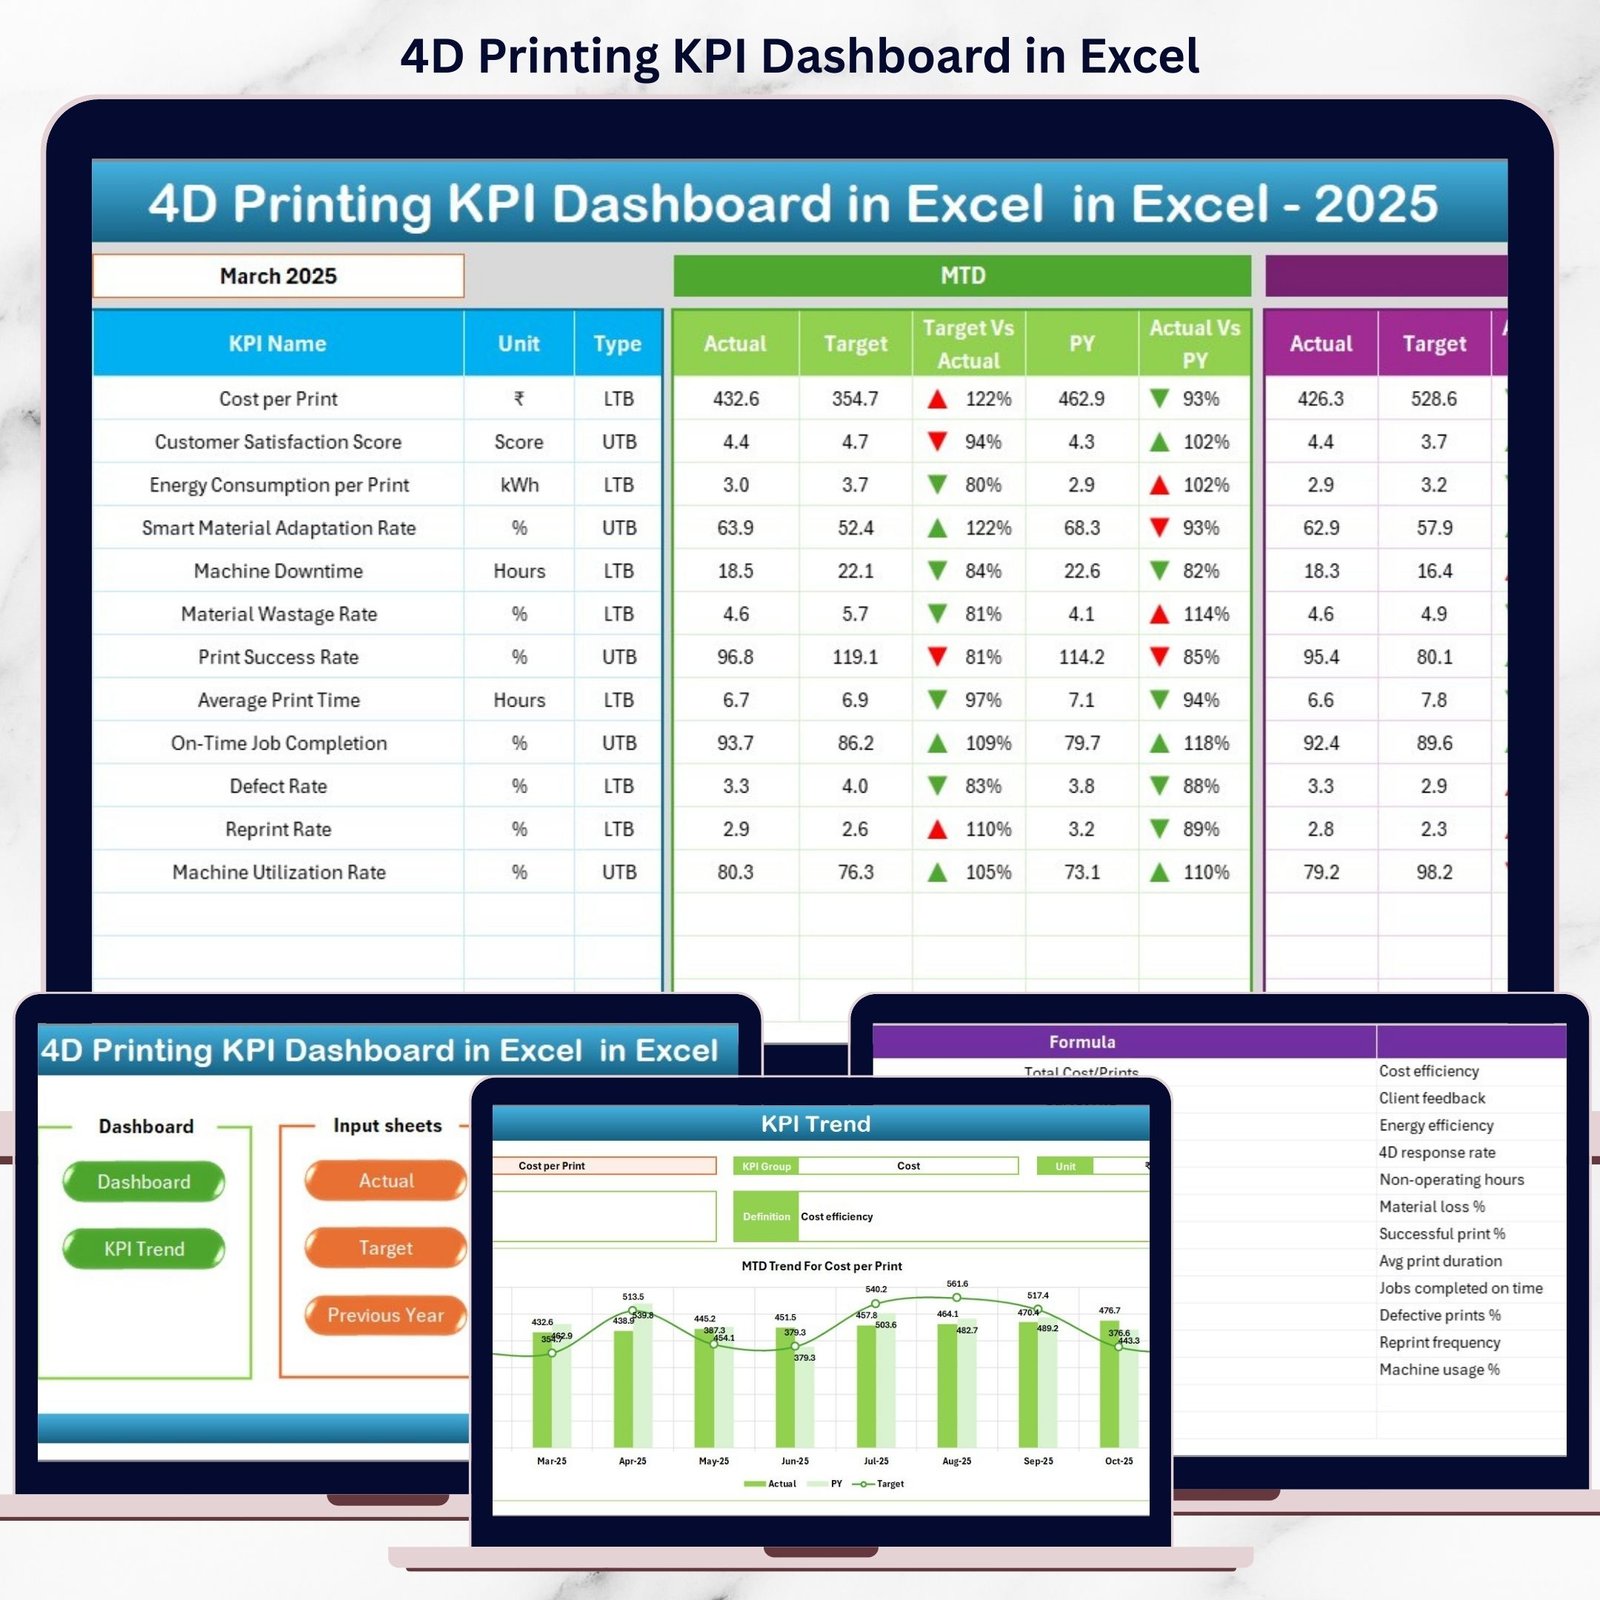
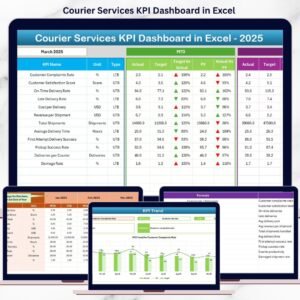
This ready-to-use Excel dashboard converts complex 4D printing data into clear, visual, and actionable insights. Instead of working with scattered spreadsheets and manual reports, you get one centralized dashboard that shows exactly how your 4D printing operations perform—month after month.
🔑 Key Features of the 4D Printing KPI Dashboard in Excel
⚙️ This dashboard is designed for clarity, speed, and control.
-
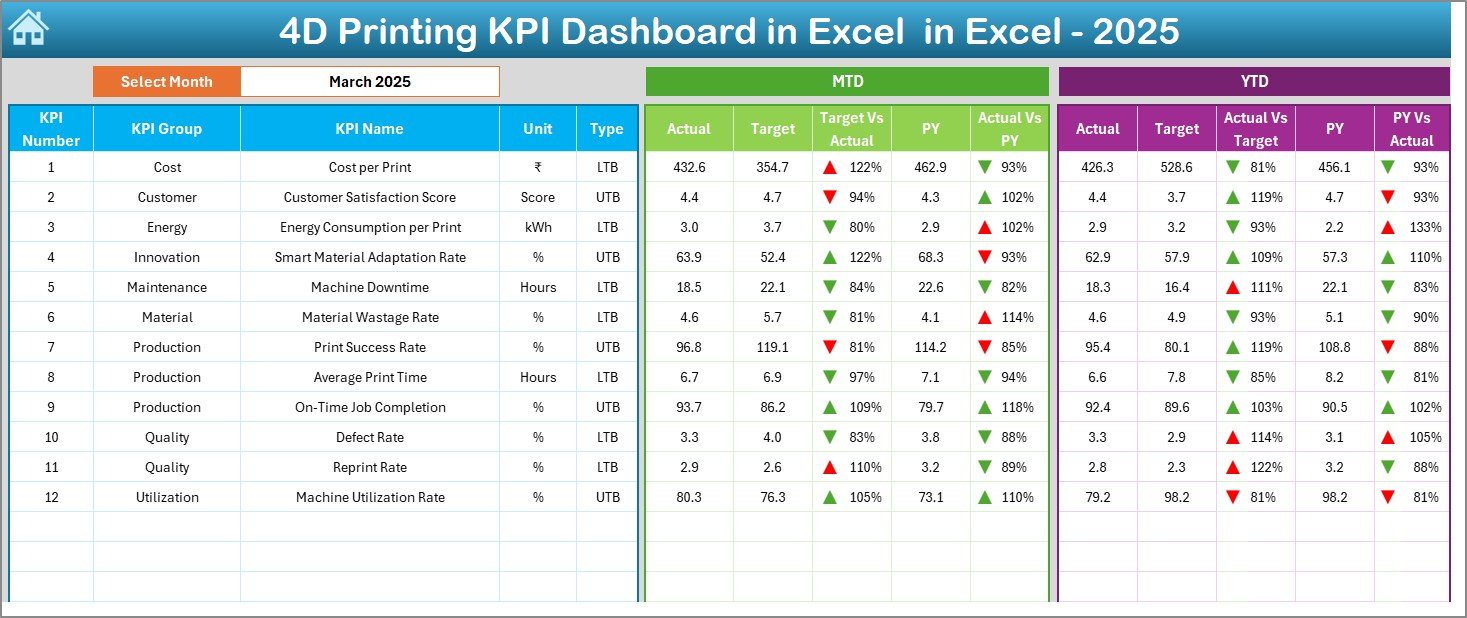
📅 Interactive Month Selector to analyze performance instantly
-
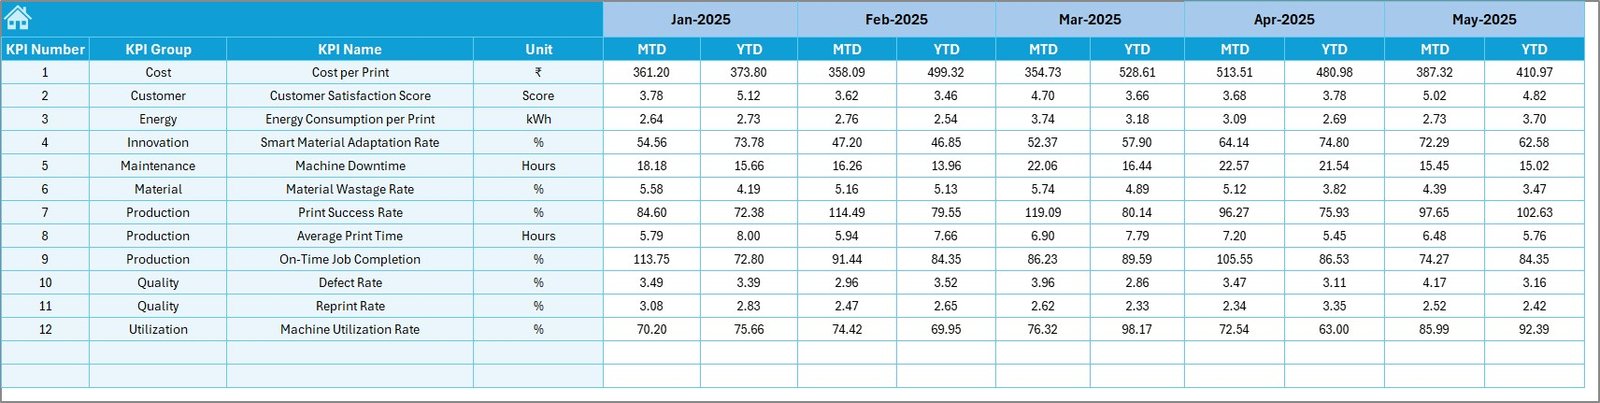
📊 MTD & YTD automatic calculations with no manual effort
-
🎯 Actual vs Target vs Previous Year comparison
-
🔼🔽 Conditional formatting with up/down arrows for quick insights
-
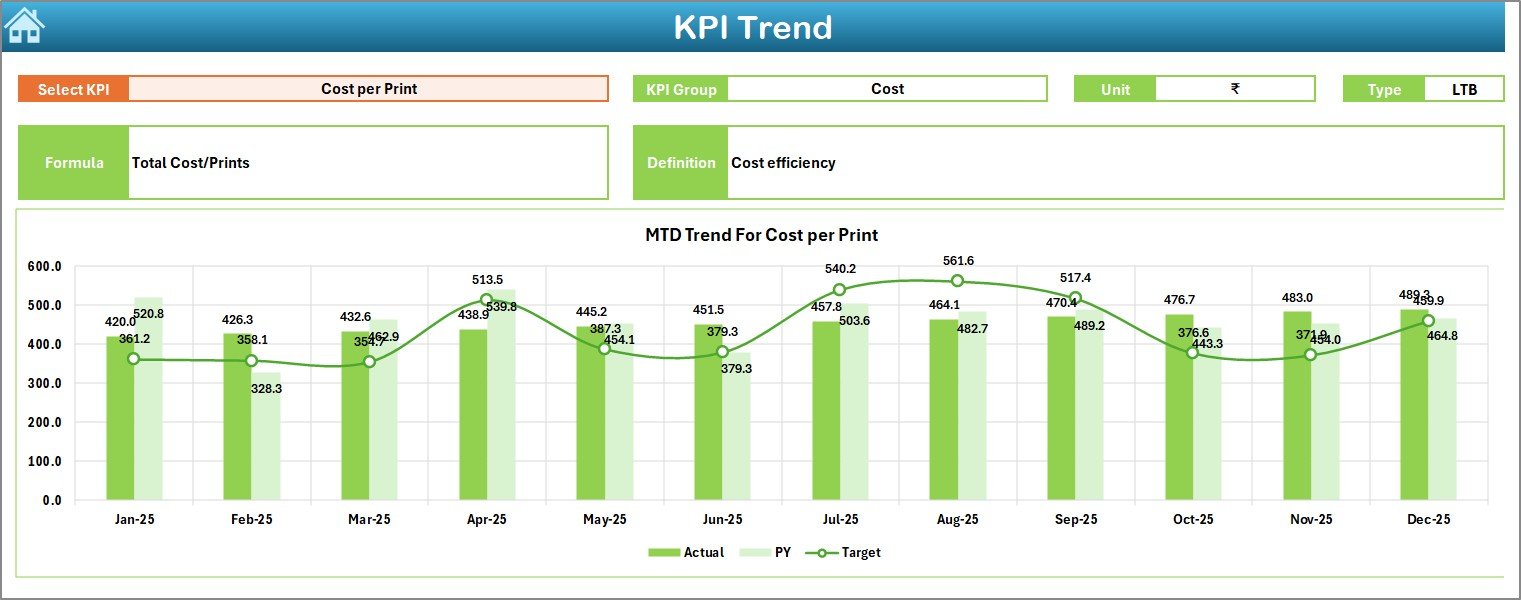
📈 KPI trend analysis for historical performance tracking
-
🧭 Button-based navigation for smooth sheet movement
-
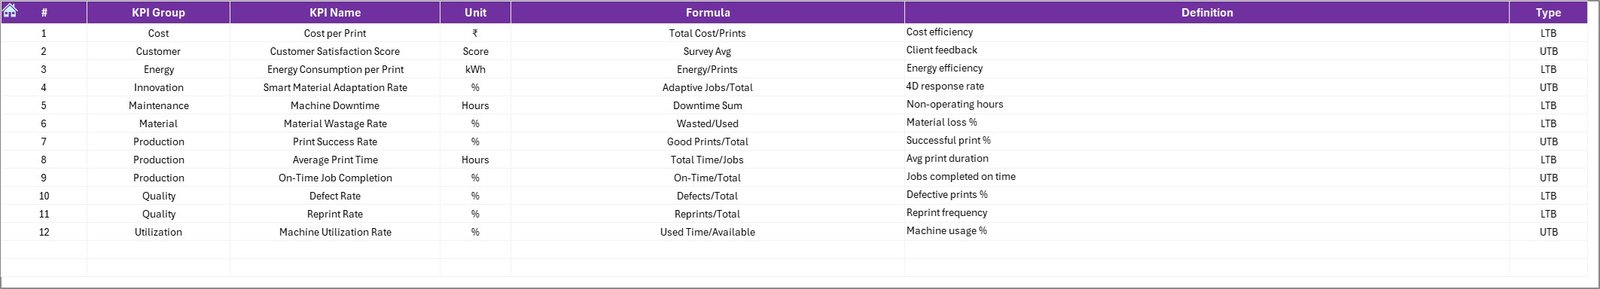
📘 Standardized KPI definition framework for consistency
Each feature works together to simplify decision-making while improving transparency.
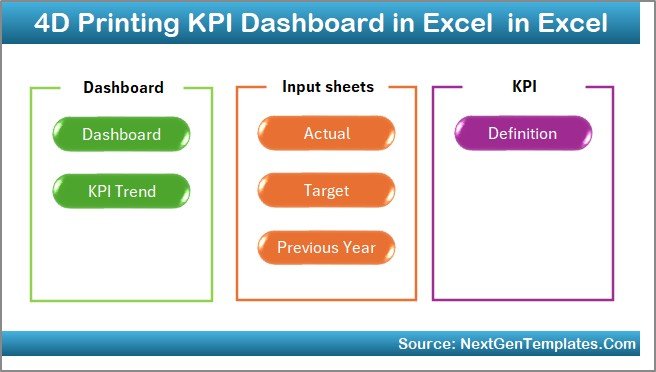
📦 What’s Inside the 4D Printing KPI Dashboard in Excel
This product includes 7 professionally designed Excel worksheets, each serving a specific analytical purpose:
📌 Summary Page – Acts as the dashboard index with navigation buttons
📌 Main Dashboard Sheet – Displays all KPIs with MTD & YTD comparisons
📌 Trend Analysis Sheet – Tracks KPI performance over time with charts
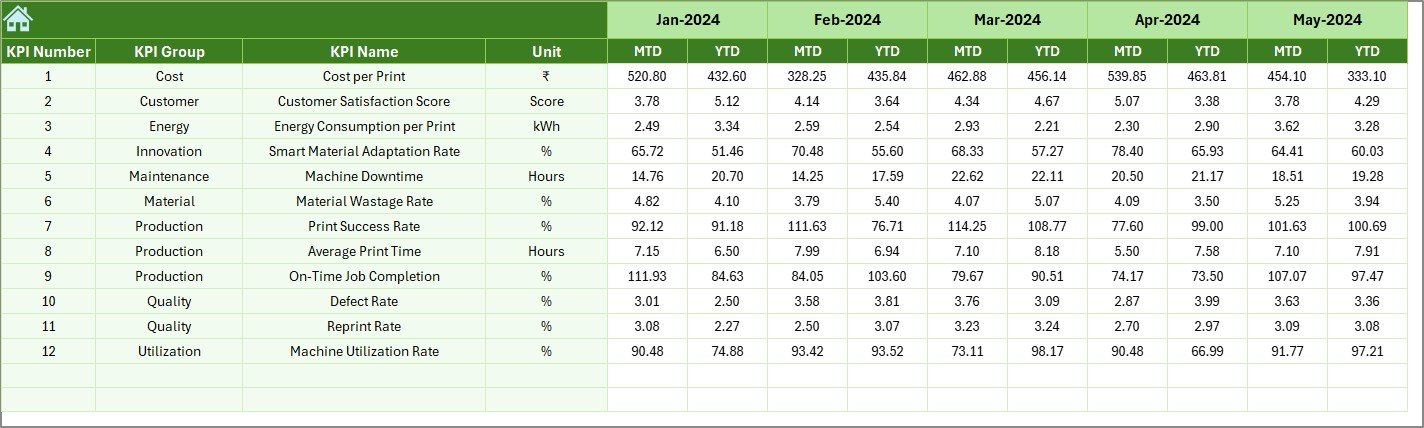
📌 Actual Numbers Input Sheet – Enter real operational data easily
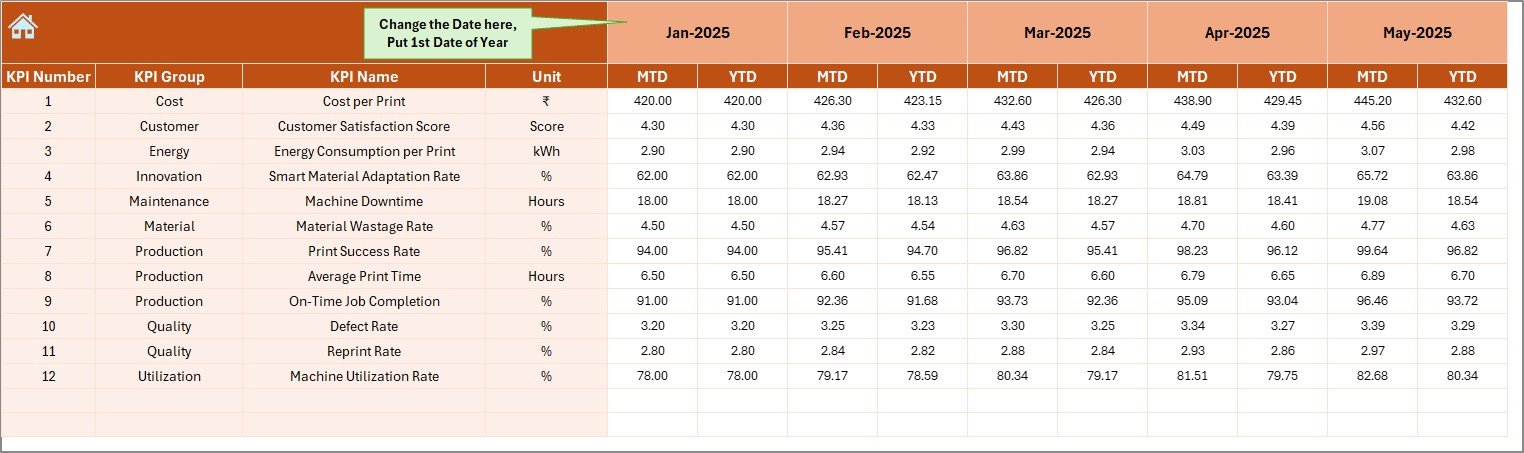
📌 Target Sheet – Define monthly and yearly performance benchmarks
📌 Previous Year Data Sheet – Enable year-over-year comparison
📌 KPI Definition Sheet – Maintain KPI clarity with formula and definition
This structure ensures clean data flow and smooth analysis.
🛠 How to Use the 4D Printing KPI Dashboard in Excel
Using this dashboard is simple and intuitive:
1️⃣ Enter actual performance data in the input sheet
2️⃣ Define targets and previous-year values
3️⃣ Select the month from the dropdown
4️⃣ Watch the entire dashboard update automatically
5️⃣ Analyze performance using tables, indicators, and trend charts
No macros. No complex setup. Just update data and analyze instantly.
🎯 Who Can Benefit from This 4D Printing KPI Dashboard in Excel
This dashboard is ideal for:
🏭 Advanced manufacturing companies
🧪 R&D and innovation teams
📊 Production and operations managers
🧩 Quality and process improvement teams
📈 Engineering leadership
🚀 Organizations investing in smart materials and 4D printing
If performance matters as much as innovation, this dashboard fits perfectly.
🔥 Why This Dashboard Is a Smart Investment
✅ Improves decision-making speed
✅ Centralizes all KPI data
✅ Tracks innovation efficiency clearly
✅ Reduces manual reporting effort
✅ Enhances cost and quality control
✅ Aligns teams with strategic goals
Instead of reacting late, your team starts acting early.
Click here to read the Detailed blog post
Watch the step-by-step video tutorial:
Visit our YouTube channel to learn step-by-step video tutorials:
👉 YouTube.com/@PKAnExcelExpert


Reviews
There are no reviews yet.