

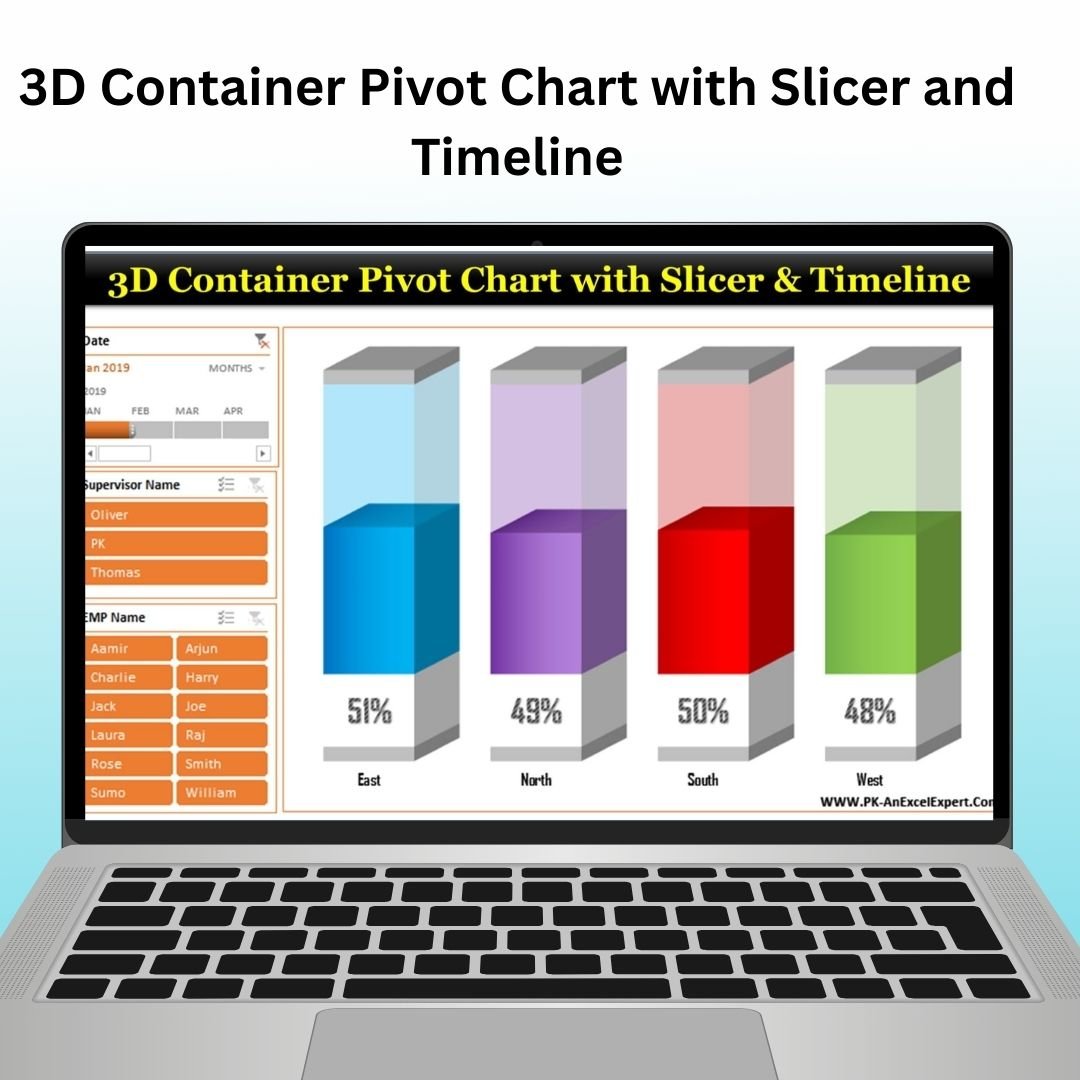

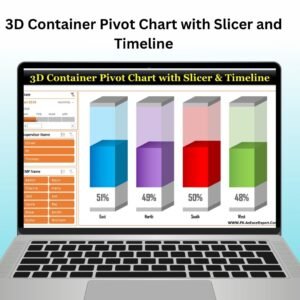
The 3D Container Pivot Chart with Slicer and Timeline in Excel is a visually stunning and interactive tool designed to present complex data in an easy-to-understand and engaging format. This chart combines the power of pivot tables with the visual appeal of 3D container charts, slicers, and timelines to provide a comprehensive, dynamic view of your data. Perfect for business analysts, project managers, and data professionals, this tool allows you to analyze and display your data in a way that’s both insightful and visually appealing.
With the 3D container chart, you can quickly visualize and compare different categories of data, such as sales figures, project progress, or financial data. The addition of slicers allows for easy filtering of data based on various dimensions, while the timeline enables you to track performance over time, providing a more granular understanding of trends and insights. Whether you’re presenting data in a report, dashboard, or meeting, the 3D Container Pivot Chart offers an interactive and informative way to communicate key insights.
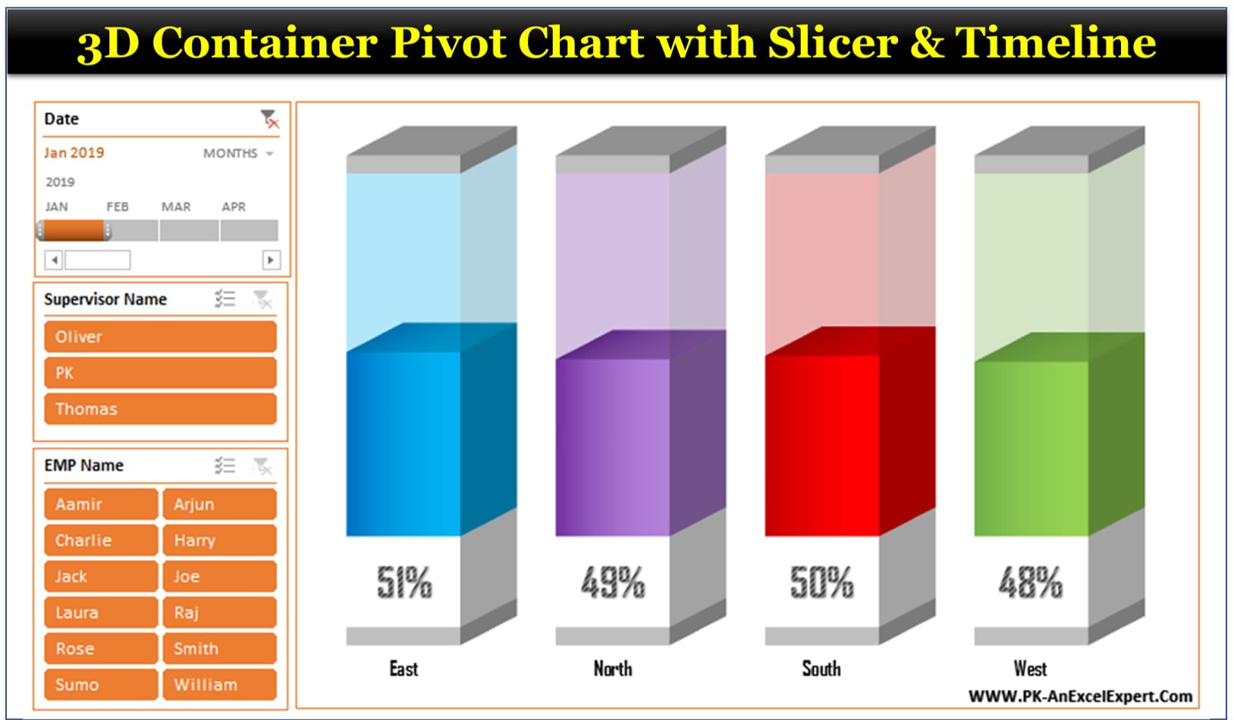
Key Features of the 3D Container Pivot Chart with Slicer and Timeline:
📊 Interactive 3D Container Chart
Visually represent your data with a 3D container chart that makes comparisons and data trends clear and easy to understand.
🔄 Dynamic Slicer Integration
Use slicers to filter and refine your data by specific categories or variables, giving you the flexibility to display exactly what you need.
📅 Timeline for Time-Based Analysis
Track data over time with the integrated timeline feature, allowing you to observe trends and make time-based comparisons.
📈 Pivot Table Power
Leverage the full power of pivot tables to dynamically summarize and analyze your data in a way that suits your needs.
🎨 Customizable Design
Tailor the chart’s appearance to fit your presentation or reporting style, adjusting colors, formats, and chart dimensions.
Why You’ll Love the 3D Container Pivot Chart with Slicer and Timeline:
✅ Interactive Data Analysis – Easily filter your data with slicers and track trends over time using the timeline for an interactive analysis experience. ✅ 3D Visualization – The 3D container chart adds a modern and visually appealing way to compare data points, making your presentations stand out. ✅ Customizable for Your Needs – Tailor the chart’s design, data points, and formatting to fit your specific analysis and reporting needs. ✅ Time-Based Insights – Use the timeline to track performance across different time periods, helping you understand seasonal trends or time-based changes. ✅ Easy to Use – With simple drag-and-drop functionality and pivot table integration, this tool makes complex data analysis accessible to users of all skill levels.
What’s Inside the 3D Container Pivot Chart with Slicer and Timeline:
- Interactive 3D Container Chart – A visually appealing chart that makes data comparison clear and easy to interpret.
- Slicer for Data Filtering – Filter your data based on specific categories to focus on the most relevant information.
- Timeline for Time-Based Tracking – Track your data over time, observing trends and performance fluctuations.
- Pivot Table Functionality – Summarize, analyze, and manipulate your data with the power of pivot tables.
- Customizable Appearance – Adjust the chart design to match your branding or presentation style.
How to Use the 3D Container Pivot Chart with Slicer and Timeline:
1️⃣ Download the Template – Get immediate access to the Excel file after purchase. 2️⃣ Input Your Data – Add your dataset to the Excel sheet, ensuring your data is structured appropriately for the pivot table. 3️⃣ Customize the Chart – Tailor the design, slicers, and timeline to your specific needs, adjusting categories and time frames. 4️⃣ Analyze Your Data – Use the slicers and timeline to explore different dimensions of your data and observe performance trends. 5️⃣ Present the Insights – Use the interactive chart to present your data in a clear, engaging, and visually appealing format.
Who Can Benefit from the 3D Container Pivot Chart with Slicer and Timeline:
- Business Analysts
- Data Analysts
- Project Managers
- Sales Teams
- Financial Analysts
- Anyone looking to enhance data visualization and reporting in Excel
The 3D Container Pivot Chart with Slicer and Timeline is the perfect solution for anyone who wants to present their data in a more dynamic, engaging, and insightful way. With its interactive features and customizable design, it is an excellent tool for both data analysis and professional presentations.
Click here to read the Detailed blog post
https://www.pk-anexcelexpert.com/3d-container-pivot-chart-with-slicer-and-timeline/
Visit our YouTube channel to learn step-by-step video tutorials
Watch the step-by-step video tutorial:
Compatibility and Requirements
- Works in Microsoft Excel desktop (Excel 2016 or later, or Microsoft 365).
- The chart runs on a PivotTable with a slicer and a timeline. Microsoft’s guide to using slicers to filter data explains how slicers work.
Frequently Asked Questions
What is in the 3D Container Pivot Chart template?
A 3D container chart built on a pivot table, a slicer for filtering by category and a timeline for filtering by date.
How do the slicer and timeline work?
Click a slicer button to show one category, or drag the timeline to a period. The pivot table and the 3D container chart update to match.
Can I use my own data?
Yes. Add your dataset to the data sheet in a pivot-friendly layout, then refresh the pivot table to see your numbers in the chart.
Can I change the look of the chart?
Yes. Colors, formats and chart size can all be changed to fit your report or presentation.
Related Chart Templates
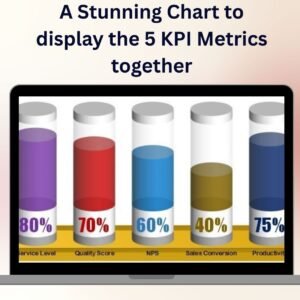
- Quick 3D Container chart in Excel: the 3D container chart without the pivot setup.
- Stylish Pivot Chart with Slicer in Excel: a pivot chart filtered by slicers.
- Excel Magic: Connect Charts & Slicers in Seconds: link one slicer to several charts.
- Dynamic Variance Arrows Chart with Slicers: variance arrows you filter with slicers.
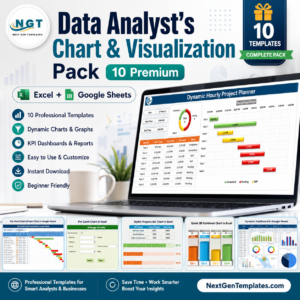
- Data Analyst’s Chart & Visualization Pack: 10 chart templates for Excel and Google Sheets in one bundle.
Browse all Excel chart and visualization templates or the Excel dashboards.







Reviews
There are no reviews yet.