The Market Research KPI Dashboard in Excel is a powerful tool designed for businesses, market researchers, and analysts who need to track and visualize key market data and performance metrics. This Excel-based dashboard consolidates important KPIs that help you assess market trends, consumer behavior, competitor performance, and overall market positioning.
With real-time data insights and customizable features, this dashboard makes it easier to monitor the effectiveness of market research campaigns, track sales performance, and understand customer preferences. Whether you’re managing product launches, brand awareness campaigns, or customer satisfaction surveys, this dashboard ensures that you’re equipped with the insights needed to drive data-driven decisions and strategic growth.
Key Features of the Market Research KPI Dashboard in Excel
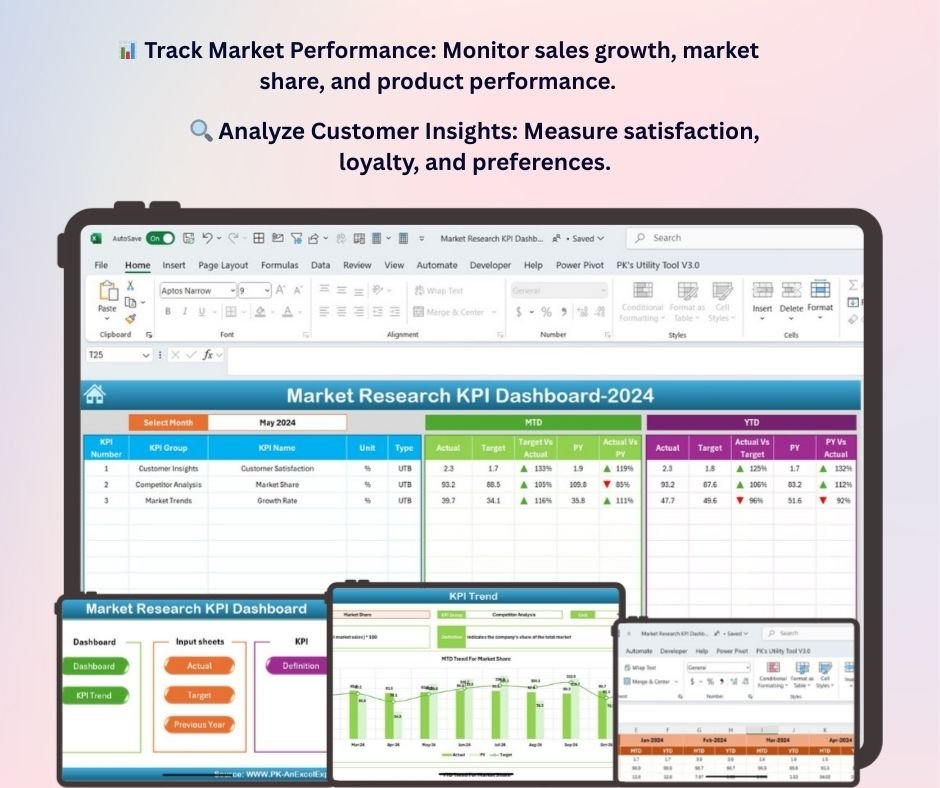
📊 Track Market Performance
Monitor key performance indicators (KPIs) such as sales growth, market share, and customer acquisition. Assess how your brand is performing in the market relative to competitors and track trends over time.
🔍 Customer Insights & Segmentation
Analyze customer behavior, preferences, and demographics. Use KPIs like customer satisfaction, loyalty scores, and NPS (Net Promoter Score) to measure customer engagement and identify potential areas for improvement.
📈 Competitive Analysis
Compare your brand’s performance with competitors by tracking industry-specific KPIs like market share, product offerings, and pricing. Get a clearer view of your competitive landscape and identify opportunities for growth.
💡 Trend Analysis & Forecasting
Visualize trends in customer preferences, sales data, and market conditions. Track changes in customer behavior and forecast future market performance to stay ahead of emerging trends.
📅 Customizable KPIs & Metrics
Tailor the dashboard to suit your specific market research objectives. Add or remove KPIs, adjust data inputs, and customize reports to reflect your unique research needs.
📊 Data Visualization & Reporting
Generate detailed visual reports and charts to present your market research findings. Share easy-to-understand insights with stakeholders, clients, or management teams to inform strategic decisions.
Why You’ll Love the Market Research KPI Dashboard in Excel
✅ Track Market Trends & Performance
Stay on top of how your business is performing in the market and adjust your strategies based on real-time data. Use the dashboard to assess trends, market share, and growth opportunities.
✅ Make Data-Driven Decisions
With easily accessible insights and data visualizations, you can make informed, strategic decisions based on hard data, rather than guesswork or assumptions.
✅ Enhance Customer Understanding
By tracking key customer metrics, you’ll gain a deeper understanding of customer preferences and satisfaction. This can help improve your products, services, and marketing efforts.
✅ Stay Ahead of Competitors
By constantly monitoring competitor performance, you’ll identify gaps in the market, uncover new opportunities, and adjust your business strategies accordingly.
✅ Customizable & Scalable
Whether you’re conducting small-scale research or handling large-scale studies, the dashboard can be customized to fit your specific needs, growing with your business as your research and data evolve.
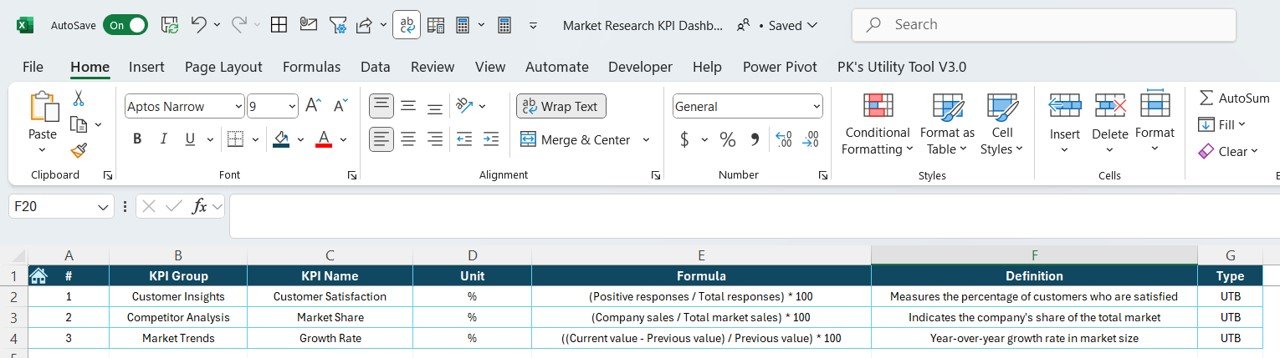
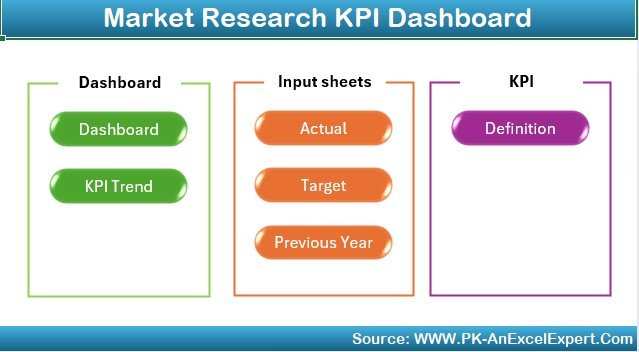
What’s Inside the Market Research KPI Dashboard Template in Excel?
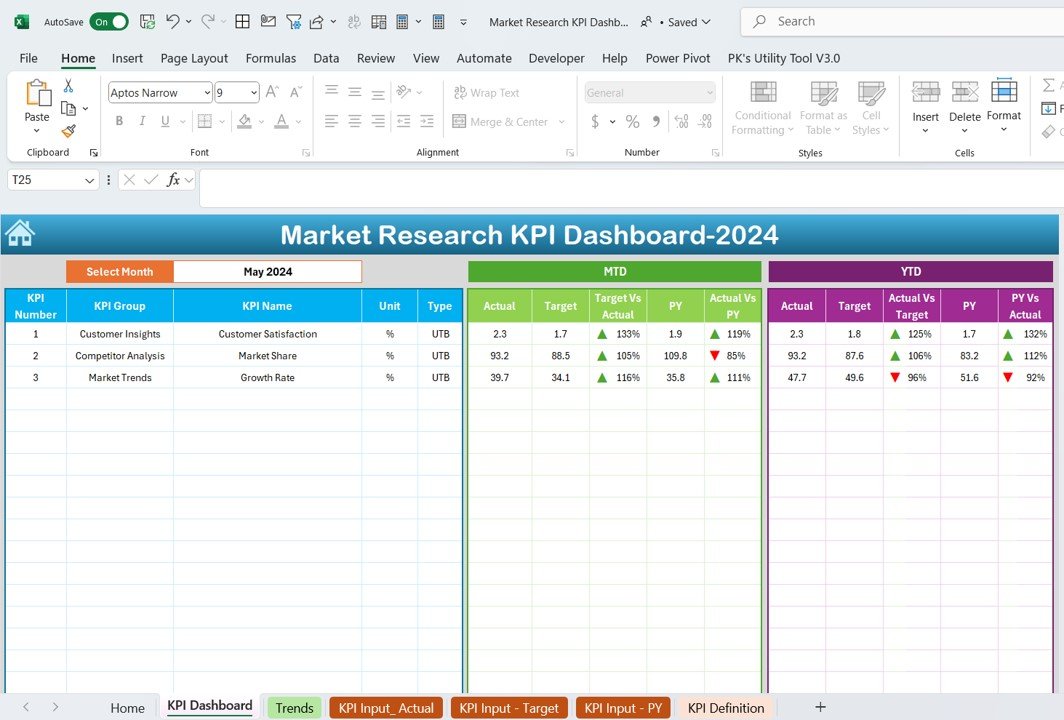
- Market Performance Tracking: Monitor KPIs like sales growth, market share, and product performance.
- Customer Insights: Track customer behavior, satisfaction, loyalty, and demographic data.
- Competitive Analysis: Compare your performance to that of competitors.
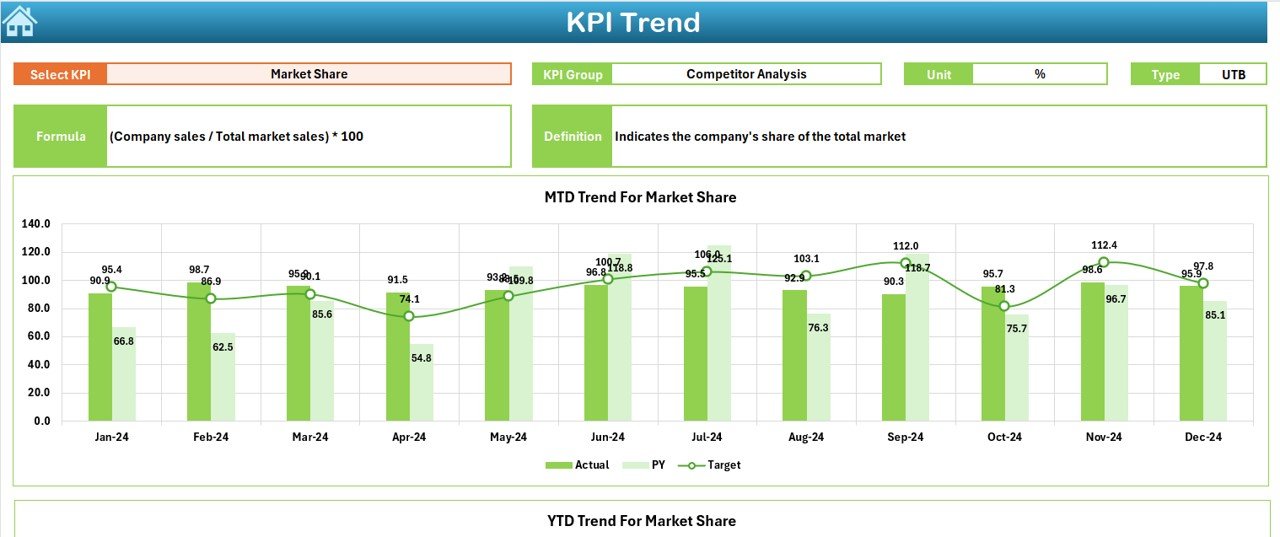
- Trend Analysis & Forecasting: Visualize trends in consumer behavior and forecast future market shifts.
- Customizable Reports: Adjust KPIs and reports to reflect your unique market research objectives.
- Data Visualizations: Use charts and graphs to present your findings clearly and effectively.
How to Use the Market Research KPI Dashboard in Excel
1️⃣ Download the Template: Get immediate access to the Market Research KPI Dashboard in Excel.
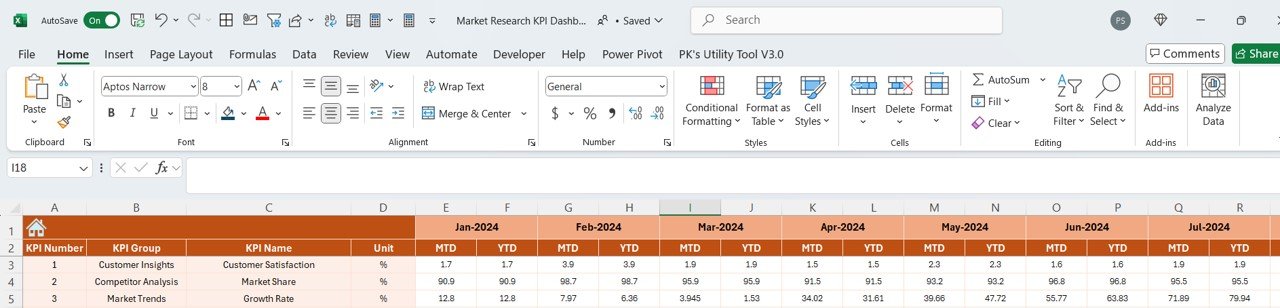
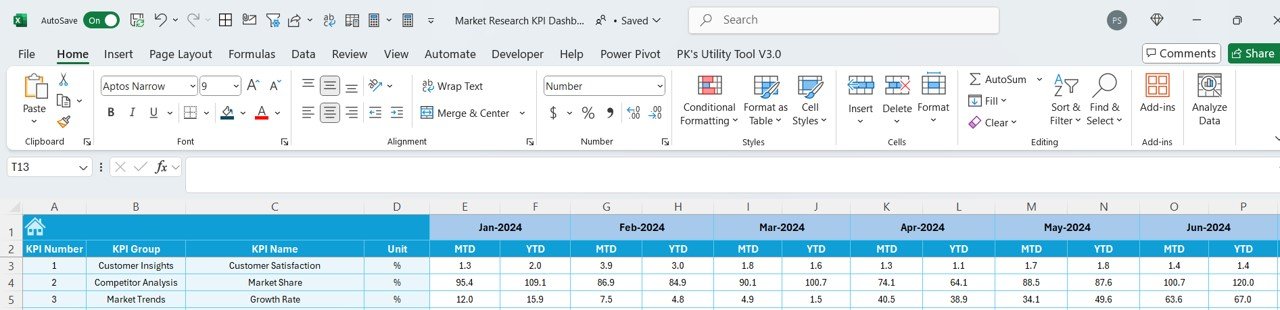
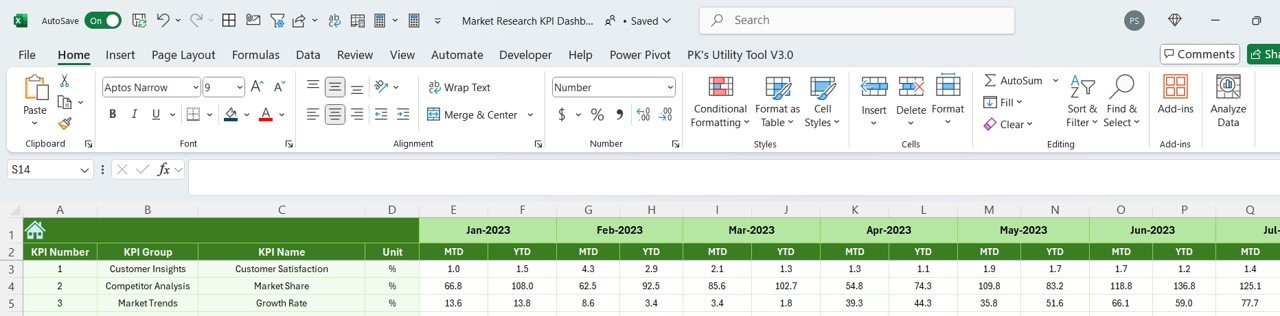
2️⃣ Input Your Market Data: Enter key data points related to market performance, customer behavior, and competitor information.
3️⃣ Track & Monitor KPIs: Use the dashboard to track sales, customer satisfaction, market share, and other key performance indicators.
4️⃣ Generate Reports & Insights: Create customized reports and visualizations to share your findings.
5️⃣ Adjust & Optimize Strategies: Use the insights from the dashboard to inform your marketing and product strategies, ensuring data-driven decisions.
Who Can Benefit from the Market Research KPI Dashboard in Excel?
🔹 Market Researchers & Analysts
🔹 Product Managers & Brand Strategists
🔹 Marketing Teams & Campaign Managers
🔹 Business Owners & Entrepreneurs
🔹 Sales Teams & Customer Experience Managers
🔹 Consultants & Data Analysts
Gain valuable insights into market trends, customer behavior, and competitive performance with the Market Research KPI Dashboard in Excel. Track and visualize data, measure KPIs, and optimize your strategies for greater market success.
Click here to read the Detailed blog post
Visit our YouTube channel to learn step-by-step video tutorials
Youtube.com/@PKAnExcelExpert


Reviews
There are no reviews yet.