
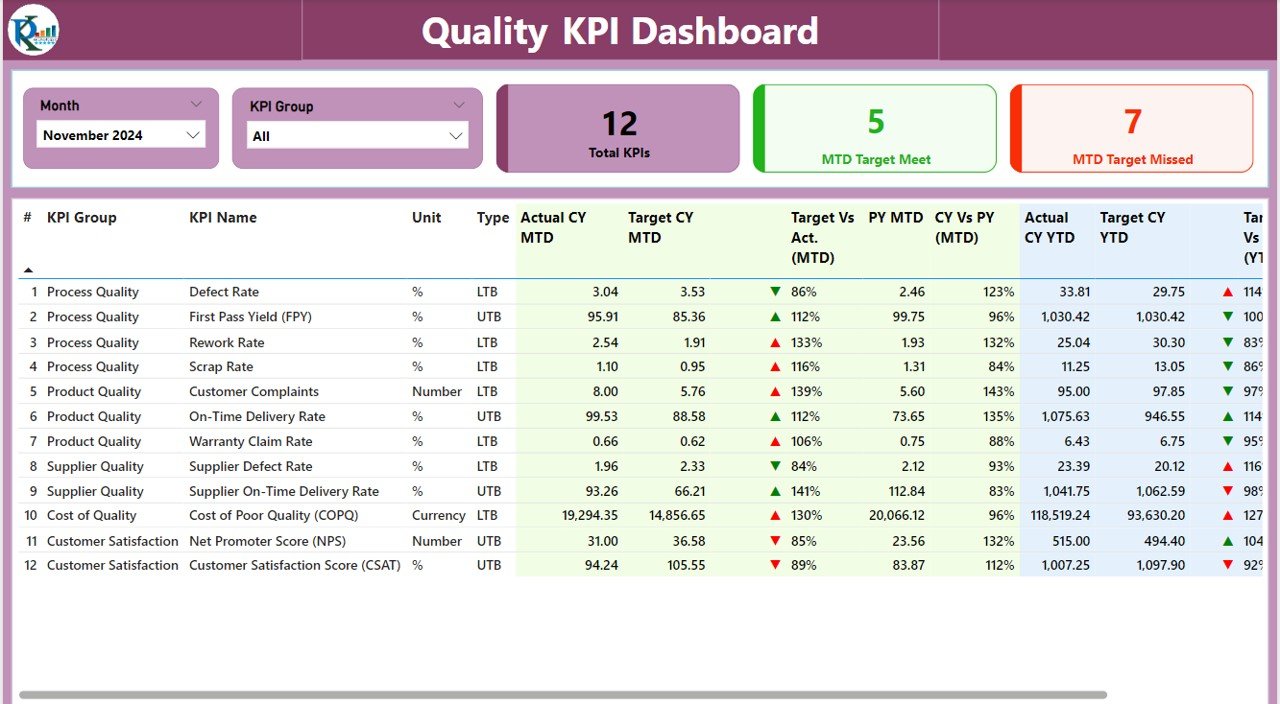
The Quality KPI Dashboard in Power BI is a powerful tool designed for organizations looking to monitor, analyze, and improve their quality management processes. Whether you are in manufacturing, service delivery, or any other industry, this interactive dashboard allows you to track key performance indicators (KPIs) related to quality standards, process efficiency, defect rates, and customer satisfaction in real-time.
With detailed visualizations and real-time data tracking, this Power BI dashboard enables you to monitor quality control across multiple departments, ensuring that your products and services meet the highest standards. The dashboard is fully customizable, allowing you to tailor the KPIs, data points, and visualizations to fit your business needs.
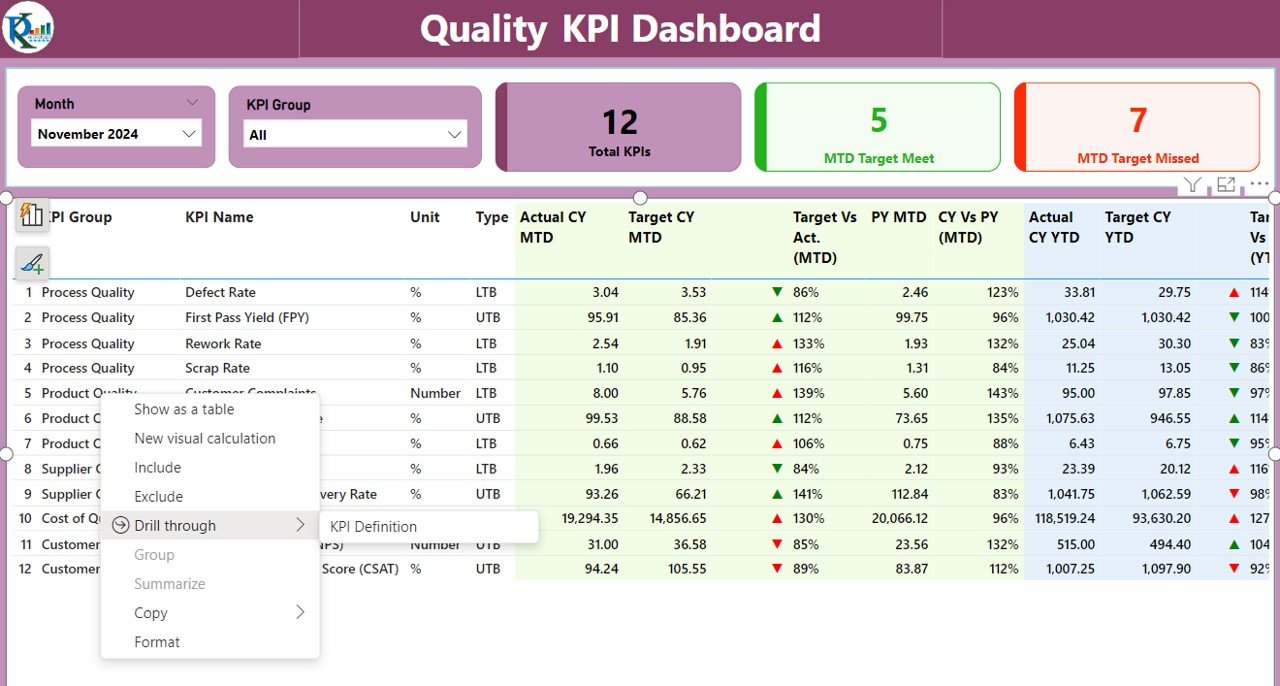
Key Features of the Quality KPI Dashboard in Power BI
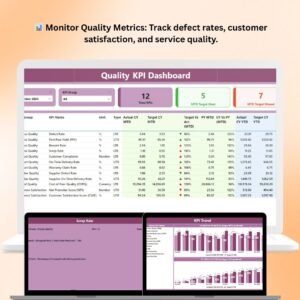
📊 Track Quality Metrics Across Departments
Monitor KPIs related to product quality, service quality, defect rates, and customer satisfaction across various departments such as production, customer service, and supply chain.
📈 Real-Time Data Insights
Stay up to date with real-time data tracking. This dashboard automatically updates with the latest data, ensuring that you are always on top of performance metrics and quality levels.
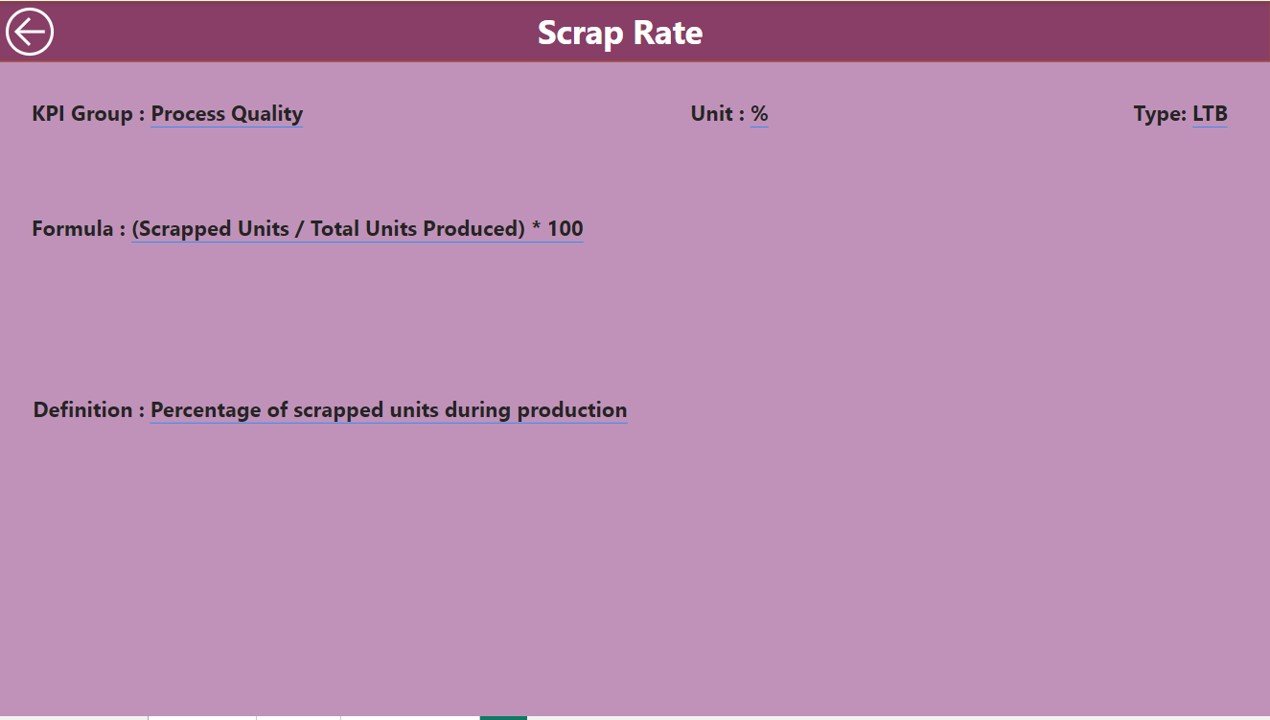
⚙️ Defect & Failure Rate Analysis
Track defect rates, failure rates, and product recalls. Identify patterns in the data and take corrective actions to minimize defects and improve product quality.
📅 Process Efficiency Monitoring
Monitor the efficiency of your quality management processes, such as cycle time, rework time, and throughput. Use this data to optimize workflows and reduce operational inefficiencies.
💼 Customer Satisfaction & Feedback Tracking
Monitor customer feedback, complaints, and satisfaction scores. Use these insights to improve product offerings, enhance customer experience, and meet customer expectations.
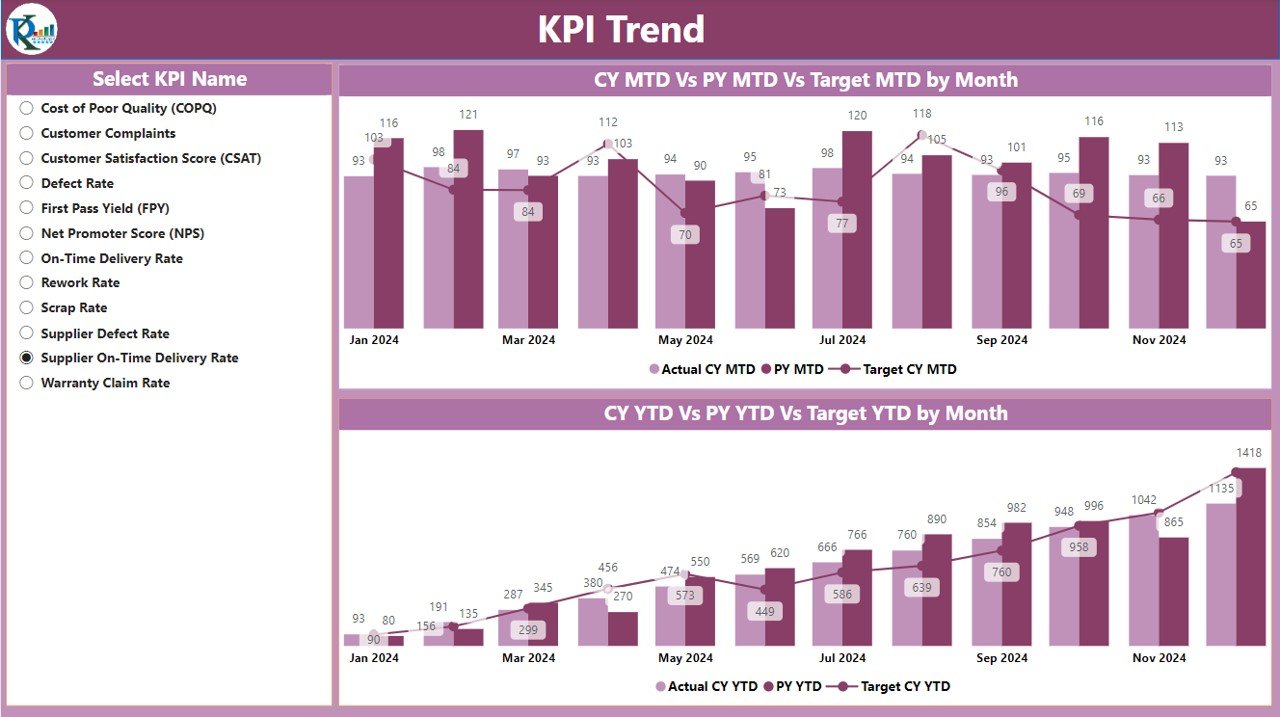
🖥️ Customizable & Interactive Visualizations
The dashboard is fully customizable to suit your business requirements. Filter data by department, product, or time period, and use interactive charts and graphs to drill down into performance details.
Why You’ll Love the Quality KPI Dashboard in Power BI
✅ Monitor Quality Performance Across All Areas
Track product and service quality, customer satisfaction, defect rates, and process efficiency all in one place. This comprehensive view helps ensure that all aspects of your operations are delivering high-quality results.
✅ Identify & Address Issues in Real-Time
With real-time data insights, you can quickly identify quality issues, defects, or inefficiencies and take immediate corrective actions.
✅ Improve Customer Satisfaction
Track customer feedback and satisfaction metrics to ensure that your products and services meet customer expectations. Use this data to improve the customer experience and increase customer loyalty.
✅ Optimize Processes & Reduce Defects
Analyze failure rates, rework times, and defect patterns to optimize your quality control processes, reduce errors, and minimize waste.
✅ Fully Customizable for Your Business Needs
Tailor the dashboard to your company’s unique quality standards and KPIs. Customize filters, charts, and reports to match your specific quality management needs.
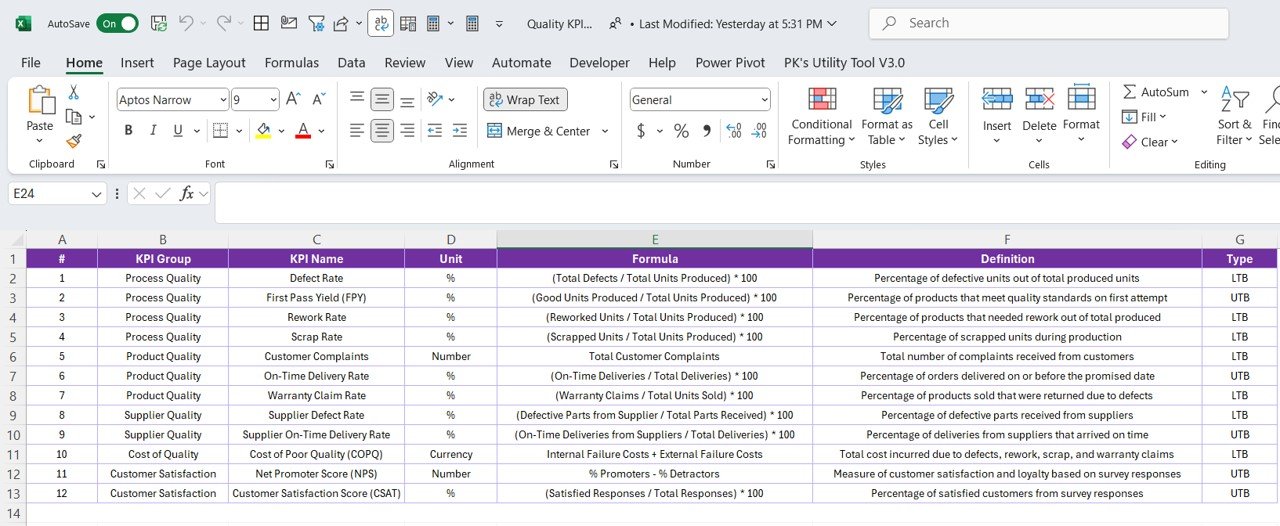
What’s Inside the Quality KPI Dashboard Template in Power BI?
- Quality Metrics Tracking: Track key quality metrics such as defect rates, cycle time, and service quality.
- Real-Time Data Insights: Get up-to-date information on performance and quality levels.
- Defect & Failure Rate Monitoring: Track and analyze defects, failures, and product recalls.
- Customer Satisfaction Insights: Monitor customer feedback, complaints, and satisfaction levels.
- Process Efficiency Monitoring: Track efficiency metrics like cycle time and throughput.
- Customizable Dashboards: Filter data by department, product, or time period for tailored insights.
How to Use the Quality KPI Dashboard in Power BI
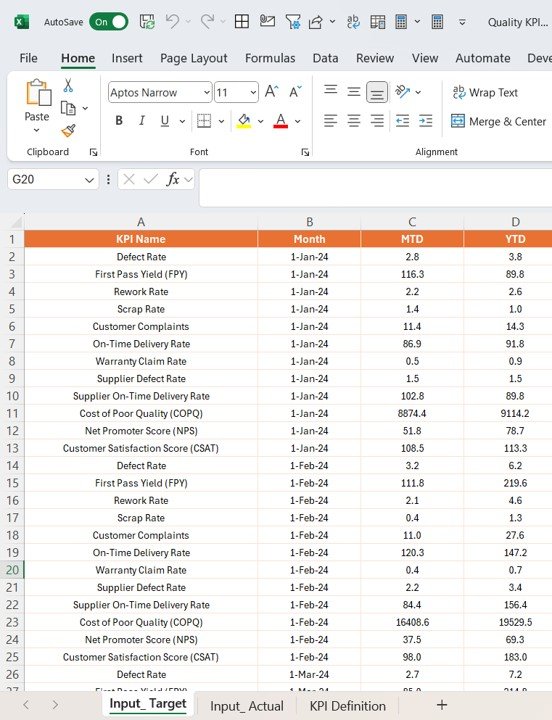
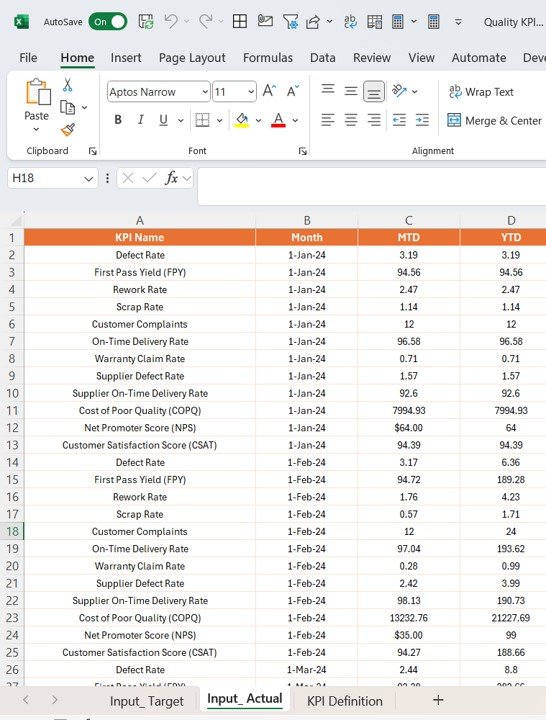
1️⃣ Download the Template: Get immediate access to the Quality KPI Dashboard in Power BI.
2️⃣ Input Your Data: Enter your quality data, including defect rates, customer satisfaction scores, and process efficiency metrics.
3️⃣ Track & Monitor KPIs: Use the dashboard to track quality metrics and performance across departments.
4️⃣ Analyze & Optimize Performance: Use data insights to identify quality issues, improve processes, and optimize customer satisfaction.
5️⃣ Generate Reports & Insights: Create customized reports to share with stakeholders and leadership.
Who Can Benefit from the Quality KPI Dashboard in Power BI?
🔹 Quality Managers & Supervisors
🔹 Operations & Manufacturing Teams
🔹 Customer Service Teams
🔹 Business Analysts & Data Analysts
🔹 Product Development & Design Teams
🔹 Senior Executives & Decision-Makers
Ensure that your business consistently delivers high-quality products and services with the Quality KPI Dashboard in Power BI. Track KPIs, monitor defects, and optimize processes to enhance operational efficiency and customer satisfaction.
Click here to read the Detailed blog post
Visit our YouTube channel to learn step-by-step video tutorials
Youtube.com/@PKAnExcelExpert


Reviews
There are no reviews yet.