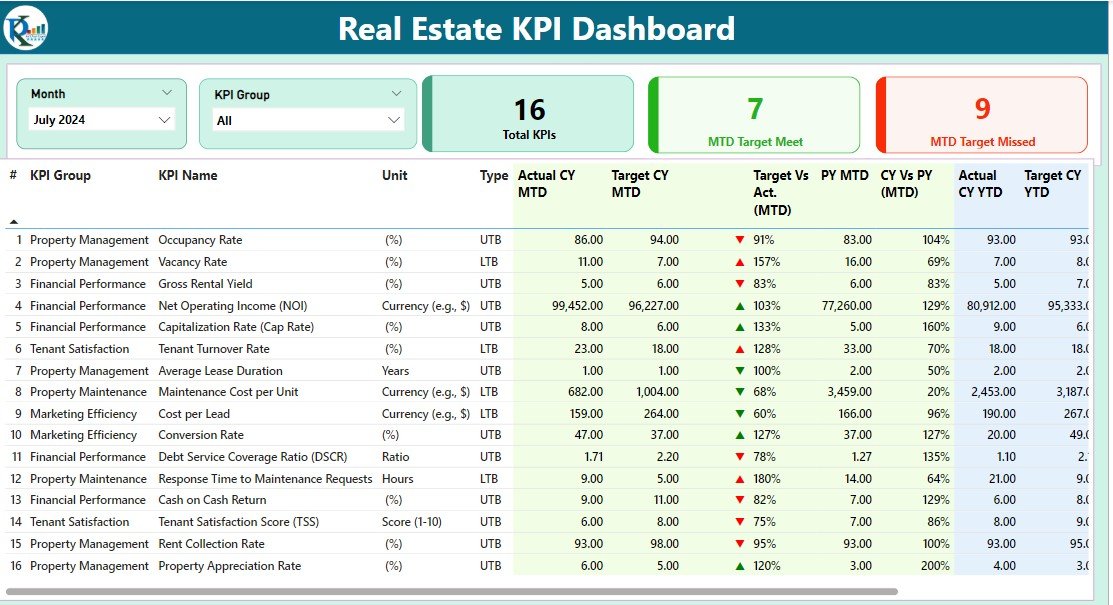
The Real Estate KPI Dashboard in Power BI is an advanced analytics tool designed to help real estate professionals, property managers, and investors track, analyze, and optimize their real estate performance. Whether you’re managing residential, commercial, or mixed-use properties, this interactive dashboard enables you to monitor key performance indicators (KPIs) related to property sales, rental income, occupancy rates, and market trends in real-time.
With powerful visualizations and real-time data insights, this dashboard helps you make informed decisions, maximize profits, and ensure efficient property management. Whether you’re tracking monthly sales, market trends, or tenant performance, this customizable Power BI dashboard brings all your data into one central location for easy access and analysis.
Key Features of the Real Estate KPI Dashboard in Power BI
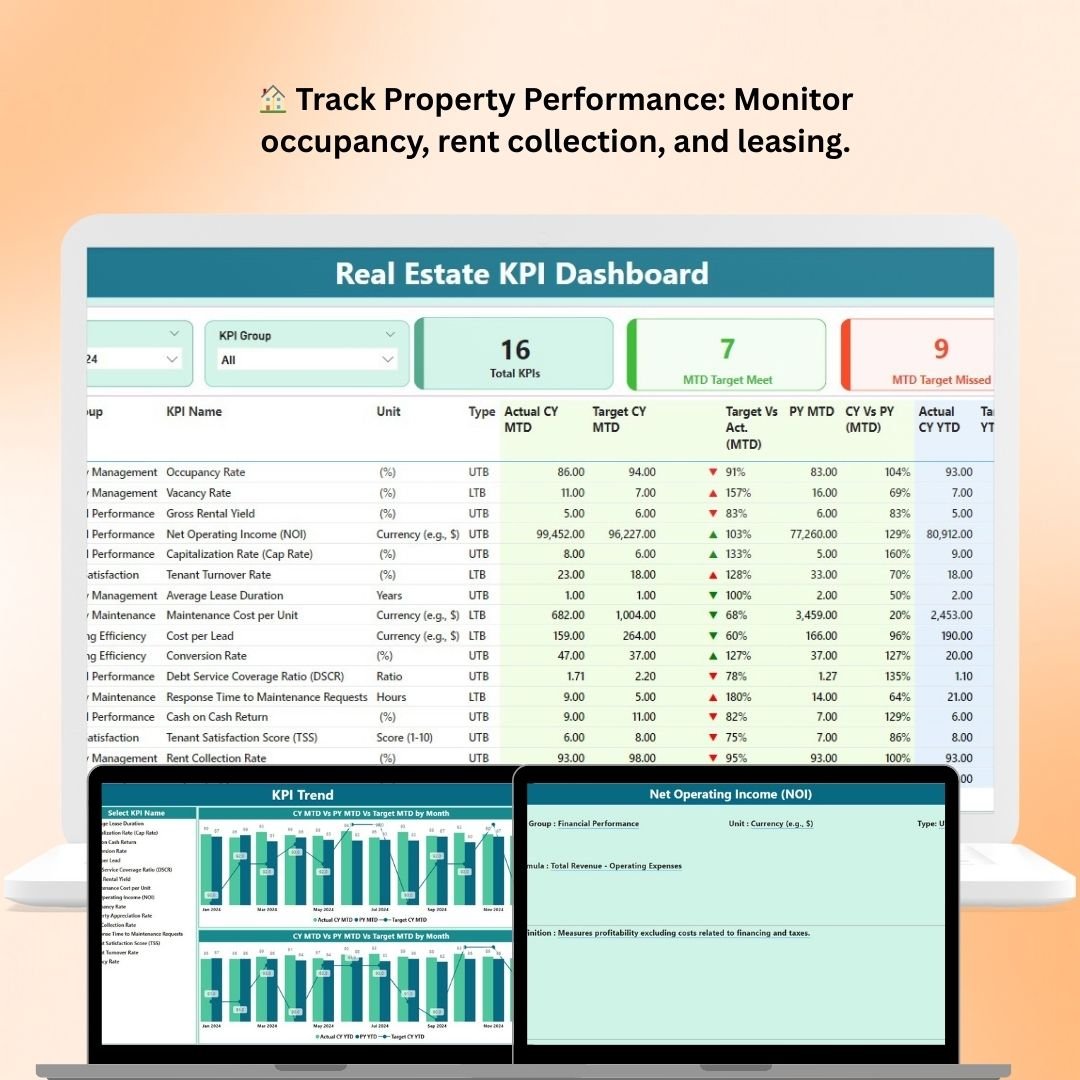
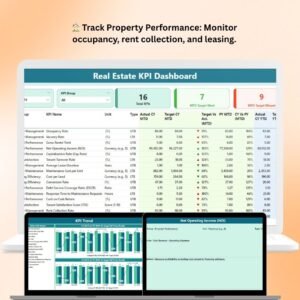
🏠 Track Property Performance
Monitor key metrics such as occupancy rates, rent collection, tenant turnover, and lease renewals. Evaluate property performance and identify opportunities for improvement.
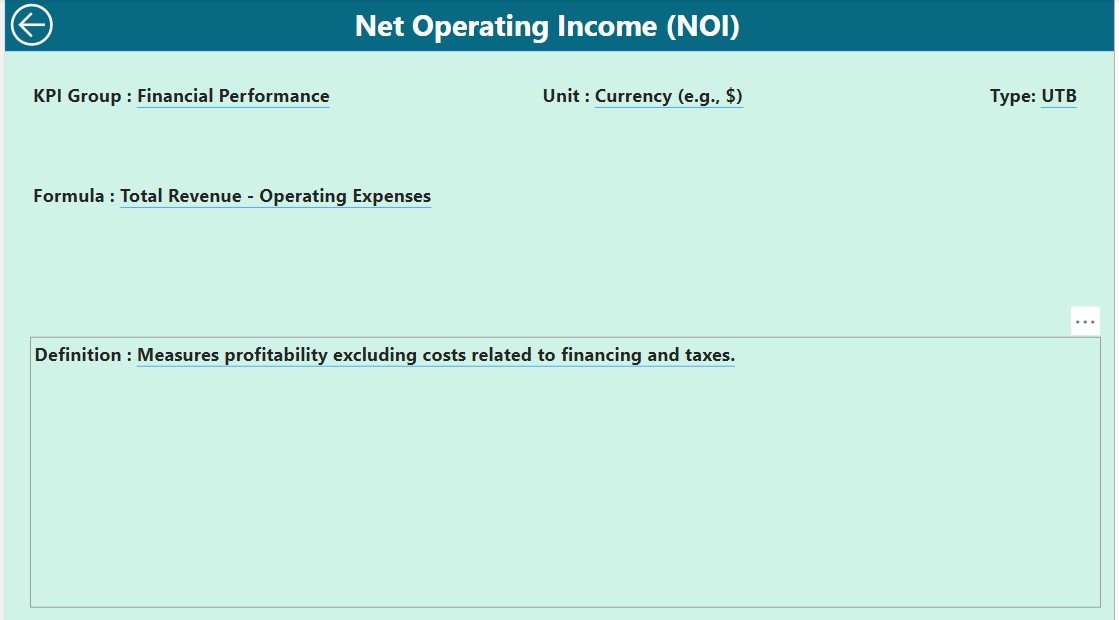
💰 Rental Income & Cash Flow Analysis
Track monthly rental income, expenses, and profit margins to ensure the financial health of your real estate portfolio. Analyze cash flow trends to help with budget planning.
📊 Sales & Market Trends Tracking
Track property sales, market price trends, and comparable in your region. Visualize sales performance and gain insights into current market conditions to make data-driven investment decisions.
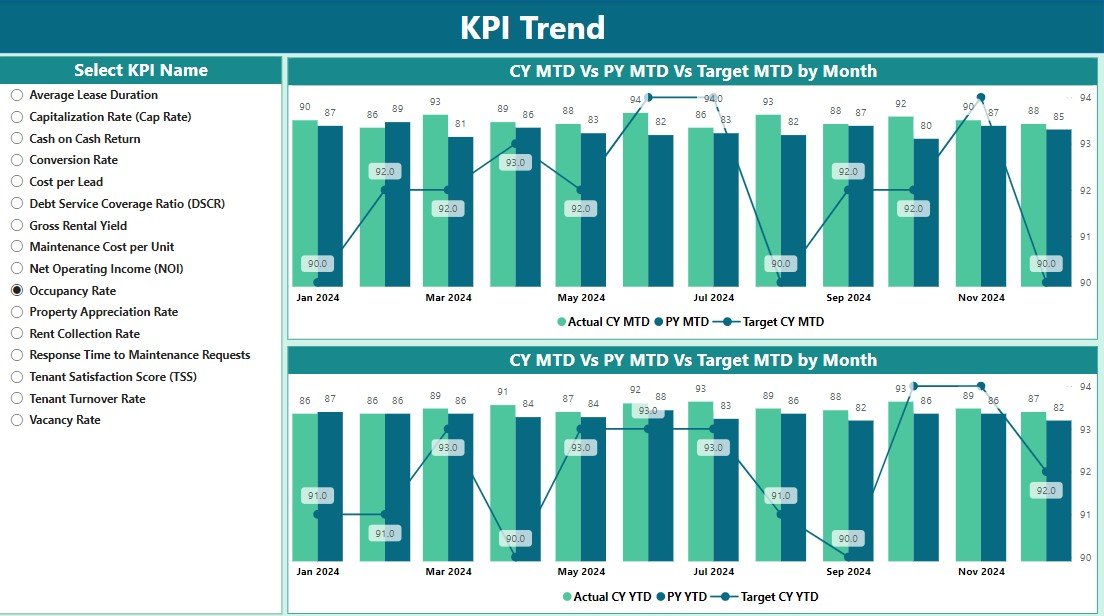
📈 Tenant Performance Metrics
Monitor tenant satisfaction, payment history, and lease renewals. Use these metrics to ensure tenant retention and optimize property leasing strategies.
📅 Customizable Reporting & Filters
Use the customizable features to filter data by property type, location, or time period. Create custom reports for different stakeholders, such as investors, property managers, or tenants.
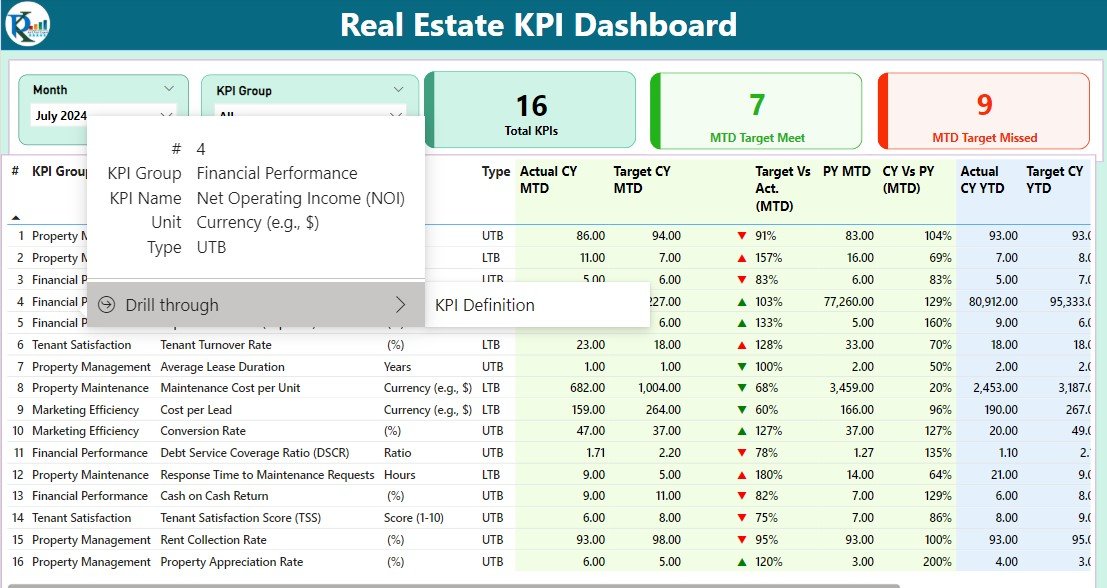
🖥️ Interactive Dashboard
The dashboard allows you to interact with data through filters, slicers, and dynamic charts. Drill down into detailed reports for specific properties, tenants, or financials.
Why You’ll Love the Real Estate KPI Dashboard in Power BI
✅ Comprehensive Property & Investment Management
Monitor and track all the essential metrics you need to manage your real estate portfolio effectively. From sales performance to tenant satisfaction, this dashboard offers a holistic view of your real estate operations.
✅ Maximize Rental Income & Cash Flow
Keep track of your rental income and expenses to ensure your investments are profitable. Use insights from the dashboard to make better decisions about rent pricing, leasing, and budgeting.
✅ Make Data-Driven Investment Decisions
Analyze market trends, sales, and property values to make informed decisions about buying, selling, or developing properties. Stay ahead of market shifts and optimize your investment strategies.
✅ Enhance Tenant Retention
Monitor tenant satisfaction and lease renewal rates to ensure long-term, profitable relationships. Use this data to improve tenant communication and retention strategies.
✅ Fully Customizable & Scalable
Whether you’re managing a single property or a large portfolio, this dashboard scales to meet your specific needs. Customize filters, charts, and reports to suit your real estate goals.
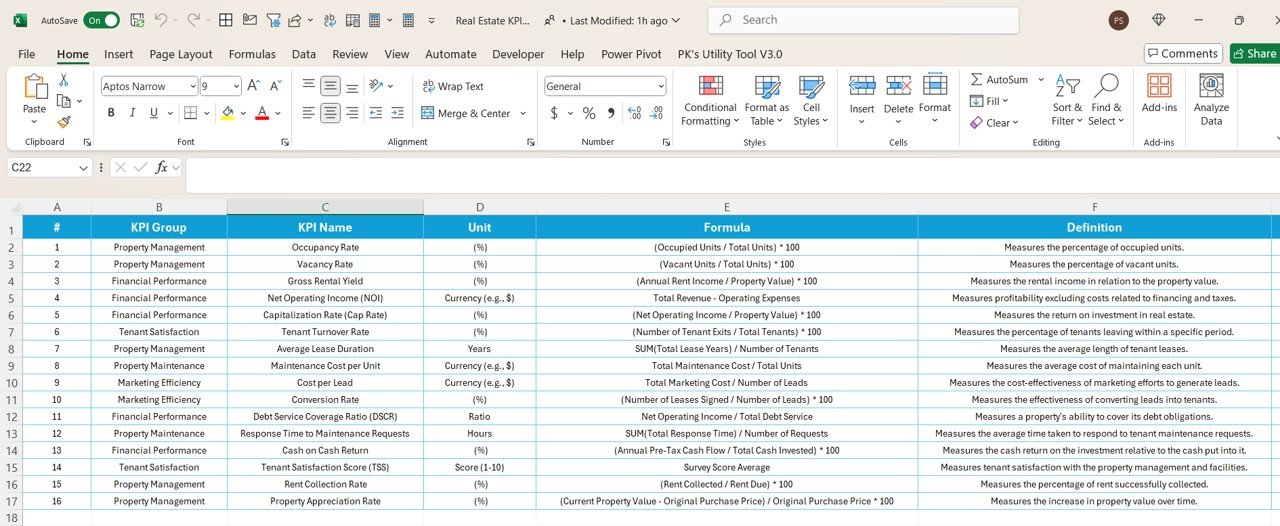
What’s Inside the Real Estate KPI Dashboard Template in Power BI?
- Property Performance Monitoring: Track occupancy rates, rent collection, and lease renewals.
- Financial Analysis: Monitor rental income, expenses, cash flow, and profitability.
- Sales & Market Insights: Track sales performance, market trends, and comparable.
- Tenant Performance Metrics: Evaluate tenant satisfaction and payment history.
- Customizable Filters & Reports: Filter data by property, location, or time period for tailored insights.
- Interactive Features: Use slicers, charts, and filters to drill down into detailed performance data.
How to Use the Real Estate KPI Dashboard in Power BI
1️⃣ Download the Template: Get instant access to the Real Estate KPI Dashboard in Power BI.
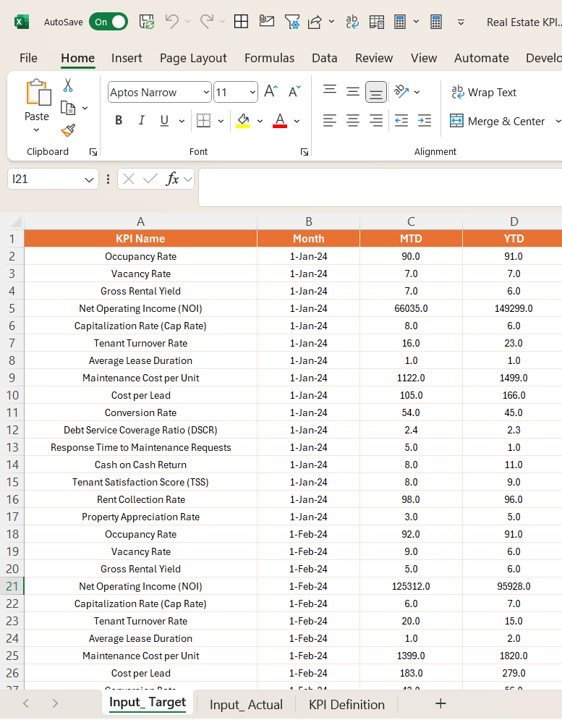
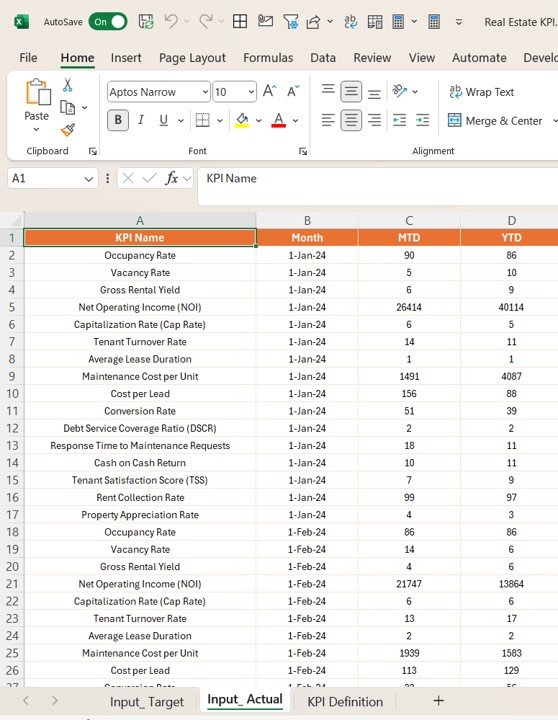
2️⃣ Input Your Property Data: Enter key data on properties, tenants, sales, and finances into the dashboard.
3️⃣ Track & Monitor KPIs: Use the dashboard to track performance metrics and monitor financials.
4️⃣ Analyze Market & Tenant Trends: Gain insights into market conditions and tenant behavior.
5️⃣ Generate Custom Reports: Create tailored reports to share with investors, property managers, or other stakeholders.
Who Can Benefit from the Real Estate KPI Dashboard in Power BI?
🔹 Real Estate Investors & Property Managers
🔹 Real Estate Agents & Brokers
🔹 Financial Analysts & Advisors
🔹 Property Developers & Builders
🔹 Commercial & Residential Property Owners
🔹 Business Owners Managing Real Estate Portfolios
Maximize your real estate investment and property management efficiency with the Real Estate KPI Dashboard in Power BI. Track performance, monitor market trends, and optimize rental income for better returns.
Click here to read the Detailed blog post
Visit our YouTube channel to learn step-by-step video tutorials
Youtube.com/@PKAnExcelExpert


Reviews
There are no reviews yet.