The Procurement KPI Dashboard in Power BI is a powerful tool designed for procurement managers to track key procurement metrics, monitor targets, and make informed, data-driven decisions. By consolidating data from multiple sources, the dashboard provides a comprehensive view of procurement performance, helping teams improve decision-making, reduce costs, and optimize procurement processes.
With interactive features and customizable filters, this dashboard allows users to track KPIs such as procurement costs, vendor performance, purchase order cycle time, and supplier lead times. It offers real-time insights into procurement activities, helping businesses streamline their supply chain and improve operational efficiency.
Key Features of the Procurement KPI Dashboard in Power BI
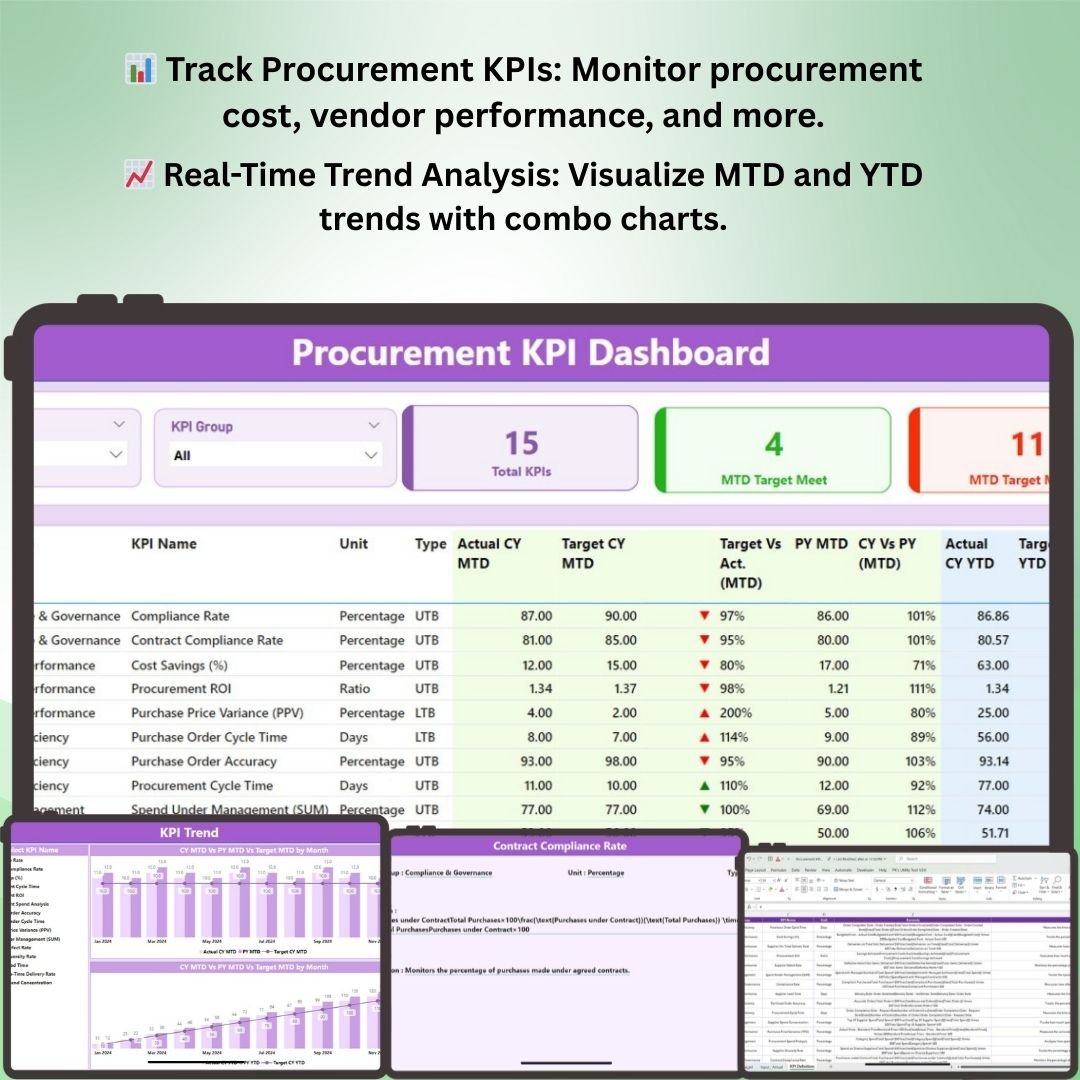
📊 Track Key Procurement Metrics
Monitor critical procurement KPIs such as procurement cost, vendor performance, purchase order cycle time, and supplier lead times.
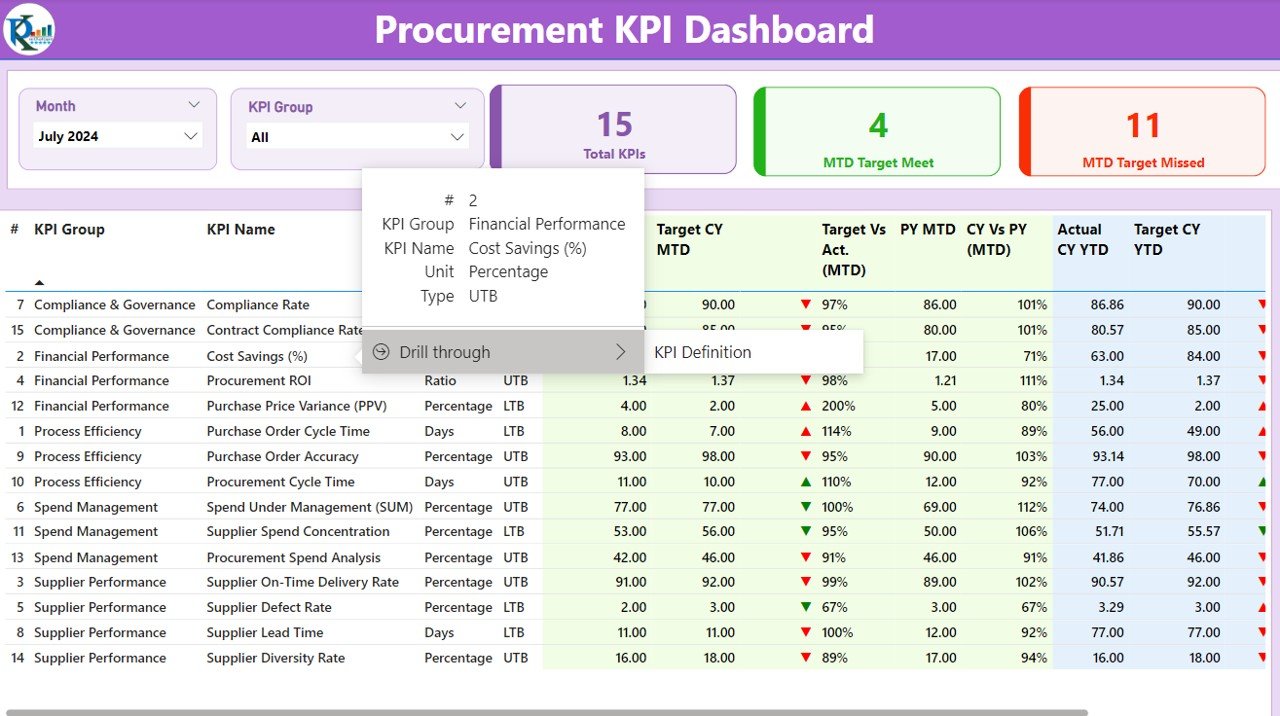
📅 Monthly & Yearly Comparisons
View Month-to-Date (MTD) and Year-to-Date (YTD) performance comparisons, tracking how current data measures against targets and previous periods.
🔄 Interactive KPI Filters
Use slicers to select specific KPIs, time periods, and vendor details, allowing for detailed trend analysis and more informed decision-making.
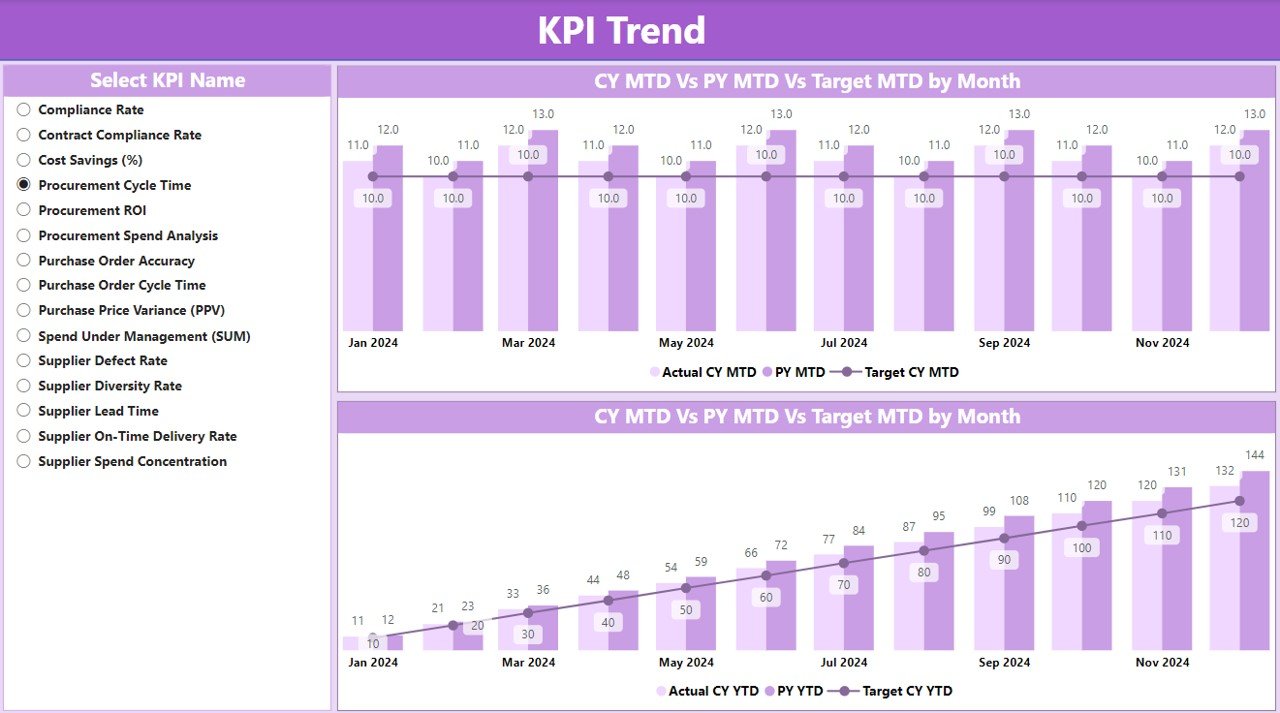
📉 KPI Trend Analysis
Visualize procurement trends over time with combo charts, highlighting both current and previous year’s data alongside targets for MTD and YTD.
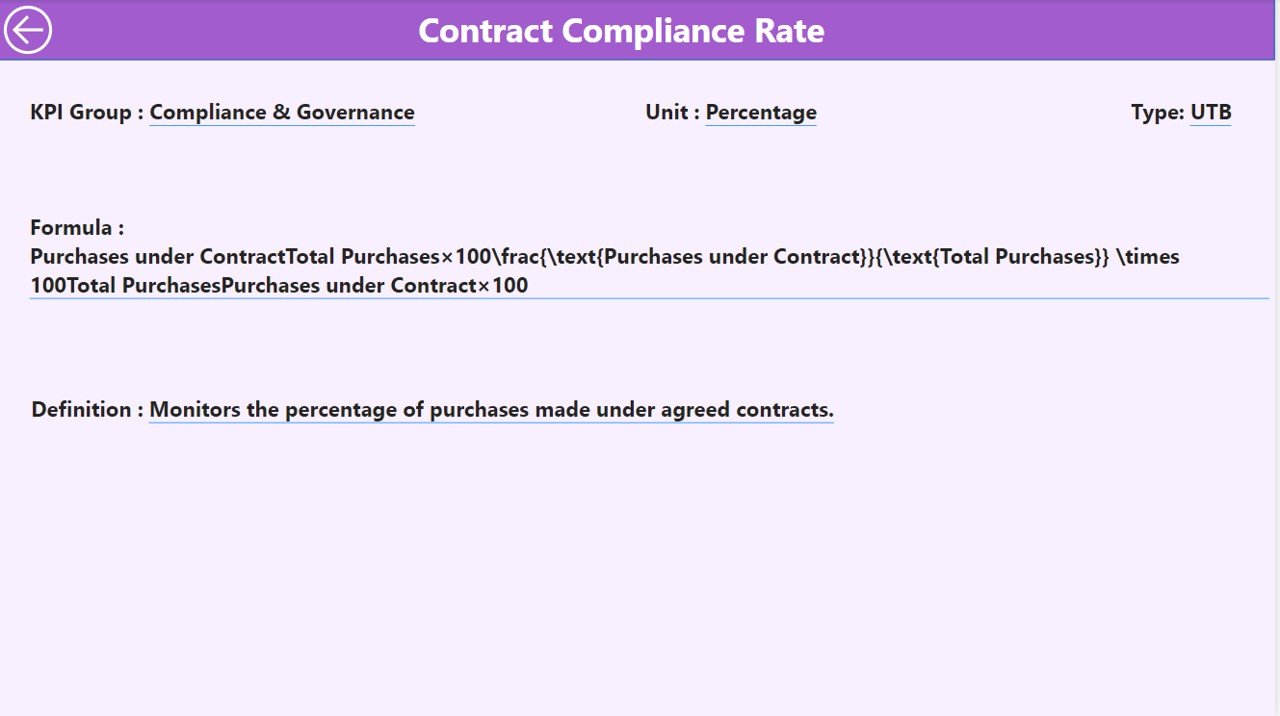
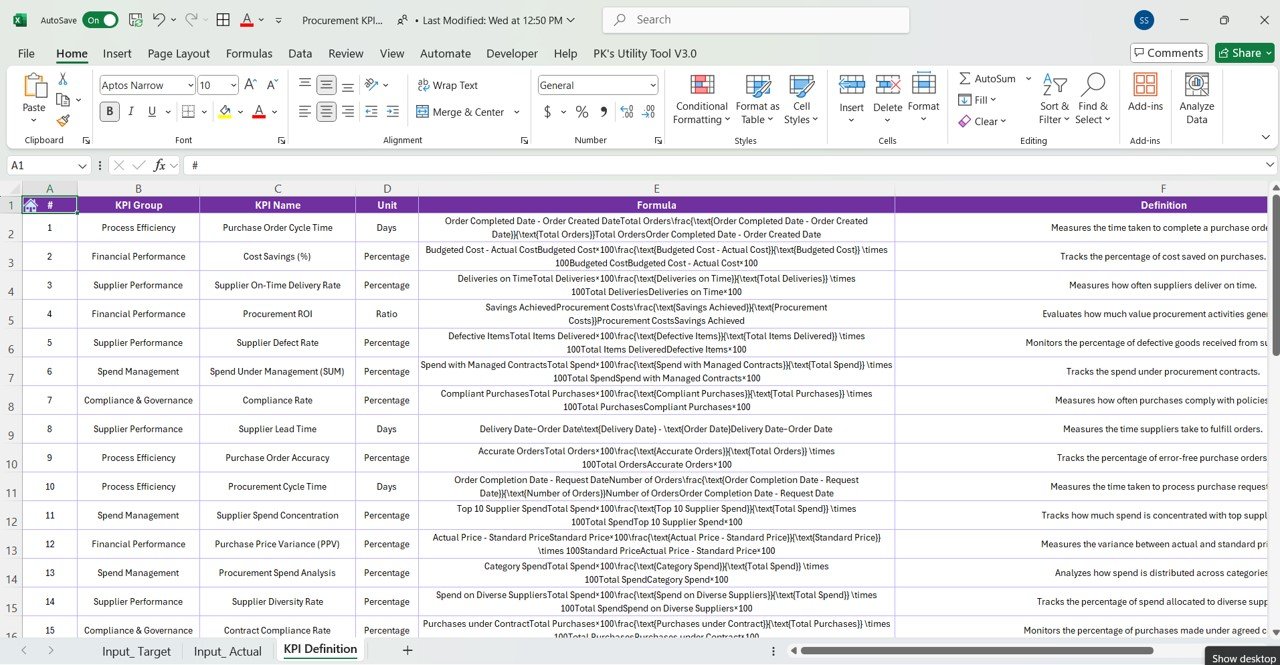
💡 In-Depth KPI Definitions
Gain deeper insights into each KPI with detailed definitions, formulas, and how each metric impacts the overall procurement process.
🖥️ Customizable Dashboard
The dashboard is fully interactive and can be customized to suit your specific business needs. Track, analyze, and report on the procurement KPIs that matter most.
Why You’ll Love the Procurement KPI Dashboard in Power BI

✅ Gain Real-Time Insights
Monitor procurement performance in real time, ensuring that you can react quickly to emerging issues and make informed decisions.
✅ Improve Procurement Efficiency
Use trend analysis to identify bottlenecks, reduce procurement costs, and optimize your supply chain.
✅ Streamline Reporting
Simplify reporting by having all your key procurement metrics in one centralized, interactive dashboard, saving time on manual data collection and reporting.
✅ Optimize Vendor Management
Track vendor performance, identify high-performing suppliers, and optimize procurement decisions to improve your supply chain.
✅ Fully Customizable for Your Needs
Adapt the dashboard to your unique procurement needs, whether for one department or across multiple locations, and track the metrics that are most important to your organization.
What’s Inside the Procurement KPI Dashboard Template in Power BI?
- Summary Page: Provides an overview of procurement performance, including key metrics like procurement cost and vendor performance.
- KPI Trend Page: Displays visual insights into procurement trends, comparing MTD and YTD data.
- KPI Definition Page: Offers detailed breakdowns of KPIs, including formulas and analysis.
- Real-Time Data Updates: Integrates data from Excel files for easy input and updating.
How to Use the Procurement KPI Dashboard in Power BI
1️⃣ Download the Template: Get access to the Procurement KPI Dashboard in Power BI.
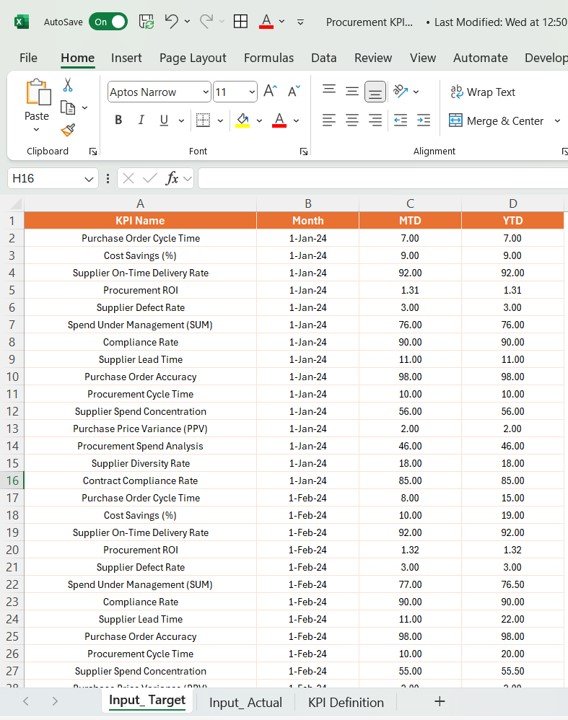
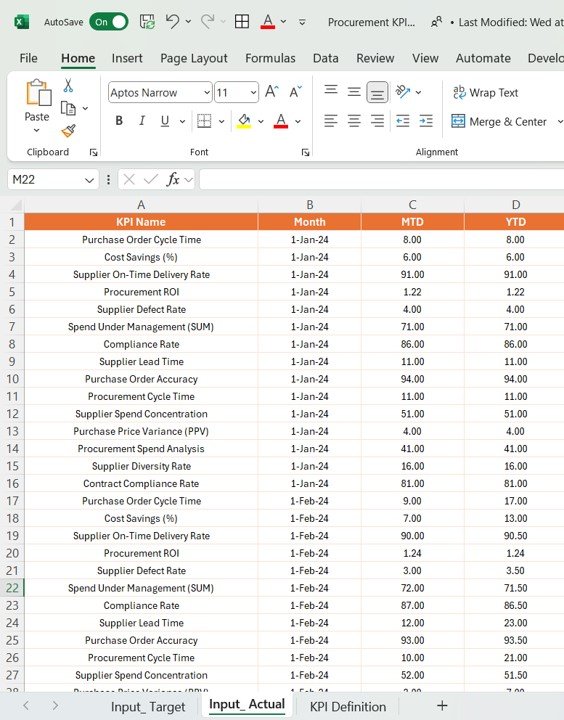
2️⃣ Input Your Data: Enter your actual and target data for KPIs in the designated Excel worksheets.
3️⃣ Track & Analyze KPIs: Use interactive filters and charts to analyze procurement performance and trends.
4️⃣ Optimize Procurement Strategy: Use insights to improve your procurement processes, vendor management, and cost control.
5️⃣ Generate Reports: Create custom reports based on your procurement KPIs for informed decision-making.
Who Can Benefit from the Procurement KPI Dashboard in Power BI?
🔹 Procurement Managers & Teams
🔹 Supply Chain Professionals
🔹 Business Analysts & Data Analysts
🔹 Chief Procurement Officers (CPOs)
🔹 Vendors & Supplier Management Teams
🔹 Companies Looking to Optimize Procurement Performance
Click here to read the Detailed blog post
Visit our YouTube channel to learn step-by-step video tutorials
Youtube.com/@PKAnExcelExpert


Reviews
There are no reviews yet.