The Automotive KPI Dashboard in Power BI is a robust and dynamic tool designed to help automotive businesses monitor and analyze key performance indicators (KPIs) for their operations. This dashboard enables automotive dealerships, manufacturers, service centers, and fleet operators to track critical metrics, including sales performance, service efficiency, inventory management, customer satisfaction, and more. With a visually engaging and interactive interface, this dashboard empowers decision-makers to make data-driven choices and optimize their operations for maximum profitability and customer satisfaction.
Using this Power BI-based dashboard, you can access real-time insights and gain an in-depth understanding of your automotive business’s performance. Track and compare key metrics across various departments or locations, identify trends, and uncover areas for improvement. Whether you’re managing a car dealership, a fleet of vehicles, or a service and repair center, this dashboard offers the tools you need to enhance operational efficiency and customer experience.
Key Features of the Automotive KPI Dashboard in Power BI
🚗 Sales Performance Tracking
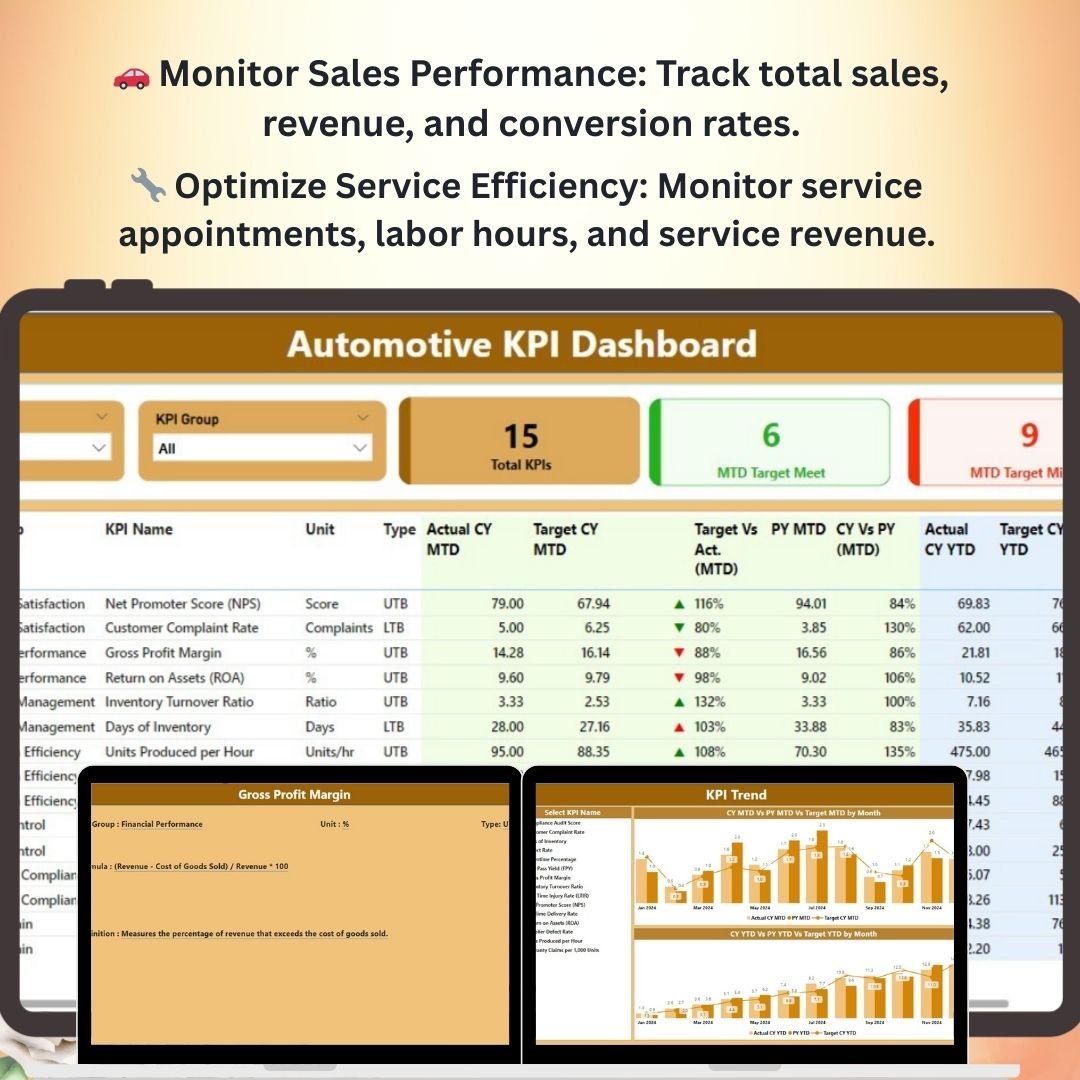
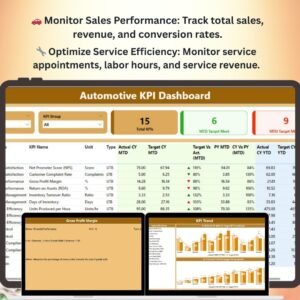
Monitor your sales performance, including total sales, revenue by car model, sales by region, and conversion rates. This feature helps you stay on top of your sales goals and identify top-performing models and sales teams.
🔧 Service Efficiency & Productivity
Track the efficiency and productivity of your service department by monitoring key metrics such as the number of service appointments, labor hours, service revenue, and customer satisfaction scores. Optimize service workflows and improve customer service outcomes.
📦 Inventory Management & Turnover
Manage your vehicle and parts inventory efficiently. Track the stock levels, turnover rates, and supplier performance to ensure optimal stock availability and reduce overstock or stockouts.
💬 Customer Satisfaction Monitoring
Measure customer satisfaction with feedback surveys, Net Promoter Scores (NPS), and customer retention rates. Analyze this data to enhance customer service and improve loyalty.
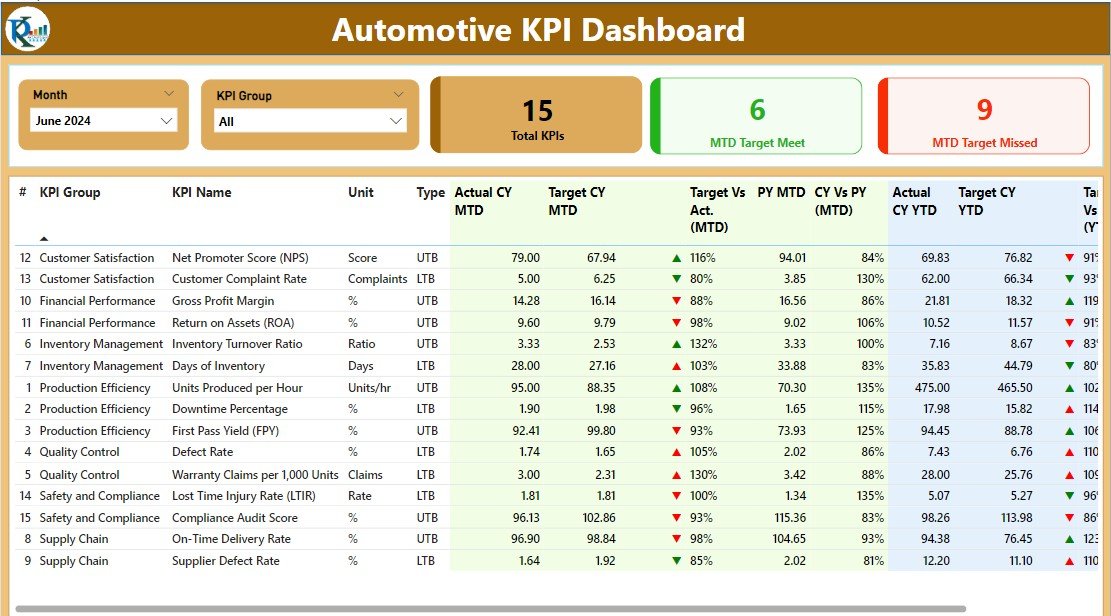
📊 Visual KPI Dashboard
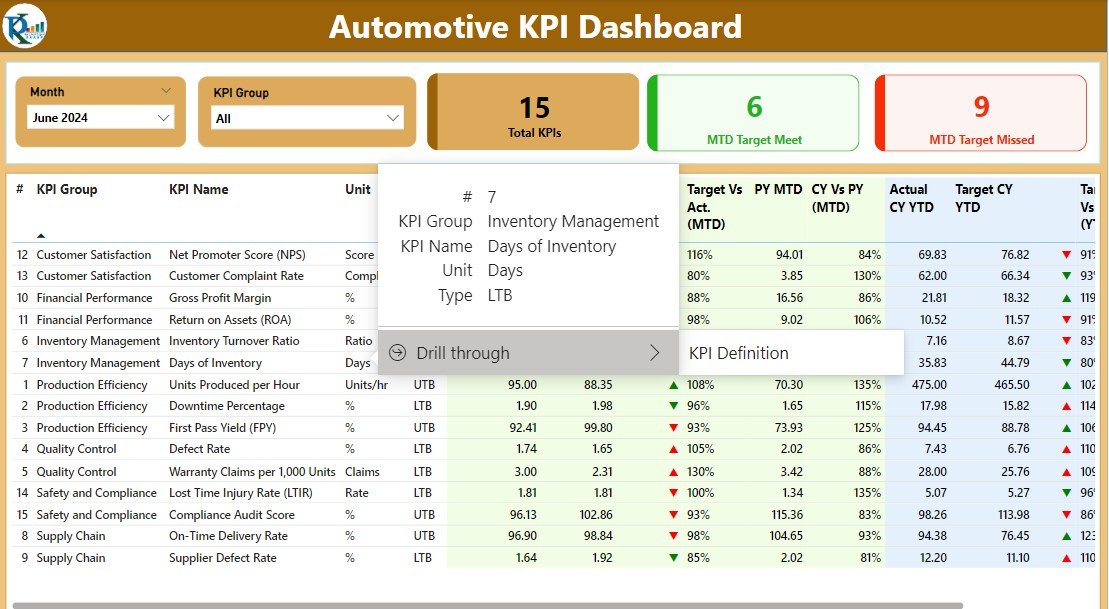
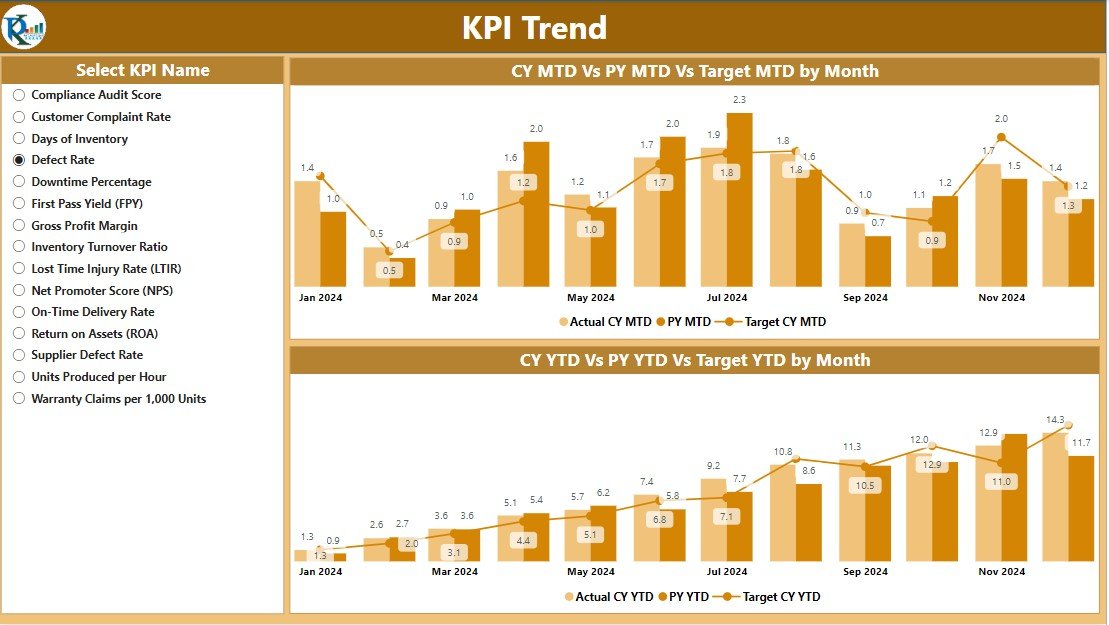
With visually compelling charts and graphs, this dashboard presents your key performance data in an easily digestible format. Filter, drill down, and compare KPIs across different timeframes, locations, or categories.
🖥️ Interactive & Real-Time Insights
Access real-time data and insights that allow you to make proactive decisions. The interactive nature of Power BI allows you to filter, slice, and dive deeper into specific performance areas for comprehensive analysis.
Why You’ll Love the Automotive KPI Dashboard in Power BI
✅ Gain Real-Time Insights
Access live data on your automotive business’s performance, enabling you to make informed, data-driven decisions that improve overall efficiency and profitability.
✅ Monitor Critical KPIs
Track all your key metrics such as sales, service, customer satisfaction, and inventory in one place, providing you with a comprehensive overview of your operations.
✅ Boost Sales & Service Efficiency
Monitor your sales and service departments closely to ensure that they are running at peak efficiency. Identify bottlenecks and areas for improvement to maximize productivity.
✅ Enhance Customer Experience
Use customer satisfaction data to drive improvements in service quality, leading to better customer retention and satisfaction.
✅ Fully Customizable & Scalable
Tailor the dashboard to suit your specific needs, whether you are tracking sales for a single dealership or managing operations across multiple locations. It is fully scalable to accommodate any automotive business size.
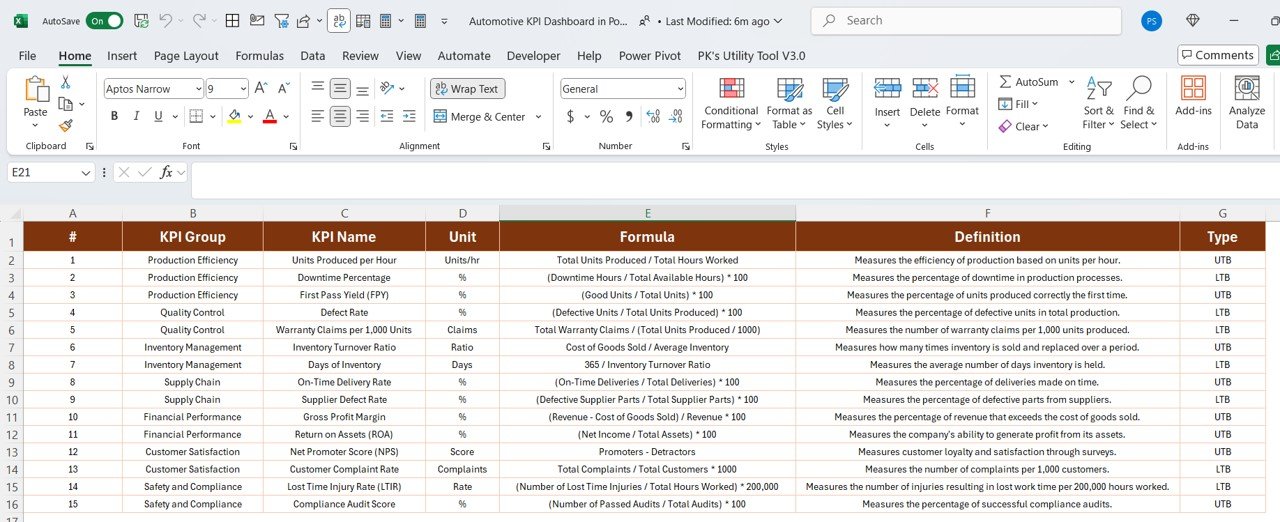
What’s Inside the Automotive KPI Dashboard Template in Power BI?
- Sales Performance Metrics: Track total sales, revenue by car model, and sales by region or sales team.
- Service Department Performance: Monitor service appointments, labor hours, and service revenue.
- Inventory Management & Turnover: Track stock levels, turnover rates, and supplier performance.
- Customer Satisfaction Data: Measure NPS, customer feedback, and retention rates.
- Real-Time KPI Tracking: Interactive charts, graphs, and tables that update with live data.
- Customizable Filters & Segments: Filter by regions, car models, time periods, or any other metric.
How to Use the Automotive KPI Dashboard in Power BI
1️⃣ Download the Template: Get access to the Automotive KPI Dashboard in Power BI.
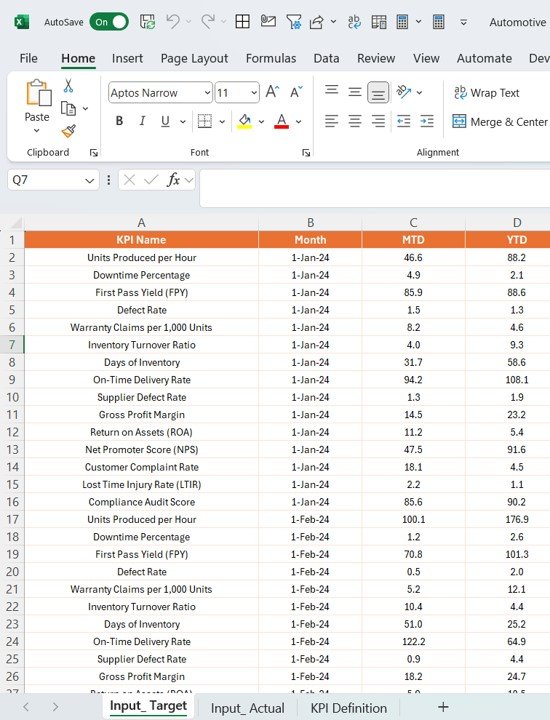
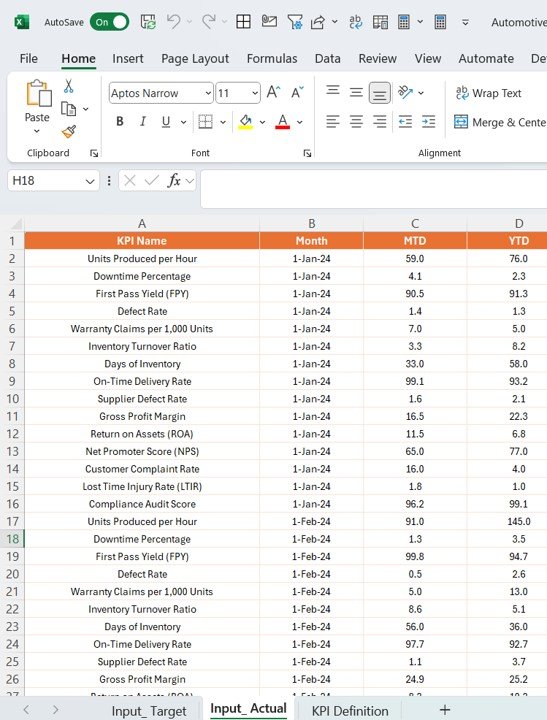
2️⃣ Input Your Data: Enter your automotive business data, including sales, service, inventory, and customer feedback.
3️⃣ Monitor Key Metrics: Use the dashboard to track performance across various areas like sales, service, and customer satisfaction.
4️⃣ Analyze & Optimize: Use the real-time data and insights to optimize sales strategies, service processes, and customer service practices.
Who Can Benefit from the Automotive KPI Dashboard in Power BI?
🔹 Automotive Dealership Owners & Managers
🔹 Service Center Operators
🔹 Fleet Managers
🔹 Automotive Sales Teams
🔹 Marketing Managers in the Automotive Industry
🔹 Automotive Business Consultants
Take control of your automotive business’s performance with the Automotive KPI Dashboard in Power BI. Track key metrics, monitor progress, and optimize operations for maximum profitability and customer satisfaction.
Click here to read the Detailed blog post
Visit our YouTube channel to learn step-by-step video tutorials
Youtube.com/@PKAnExcelExpert


Reviews
There are no reviews yet.