

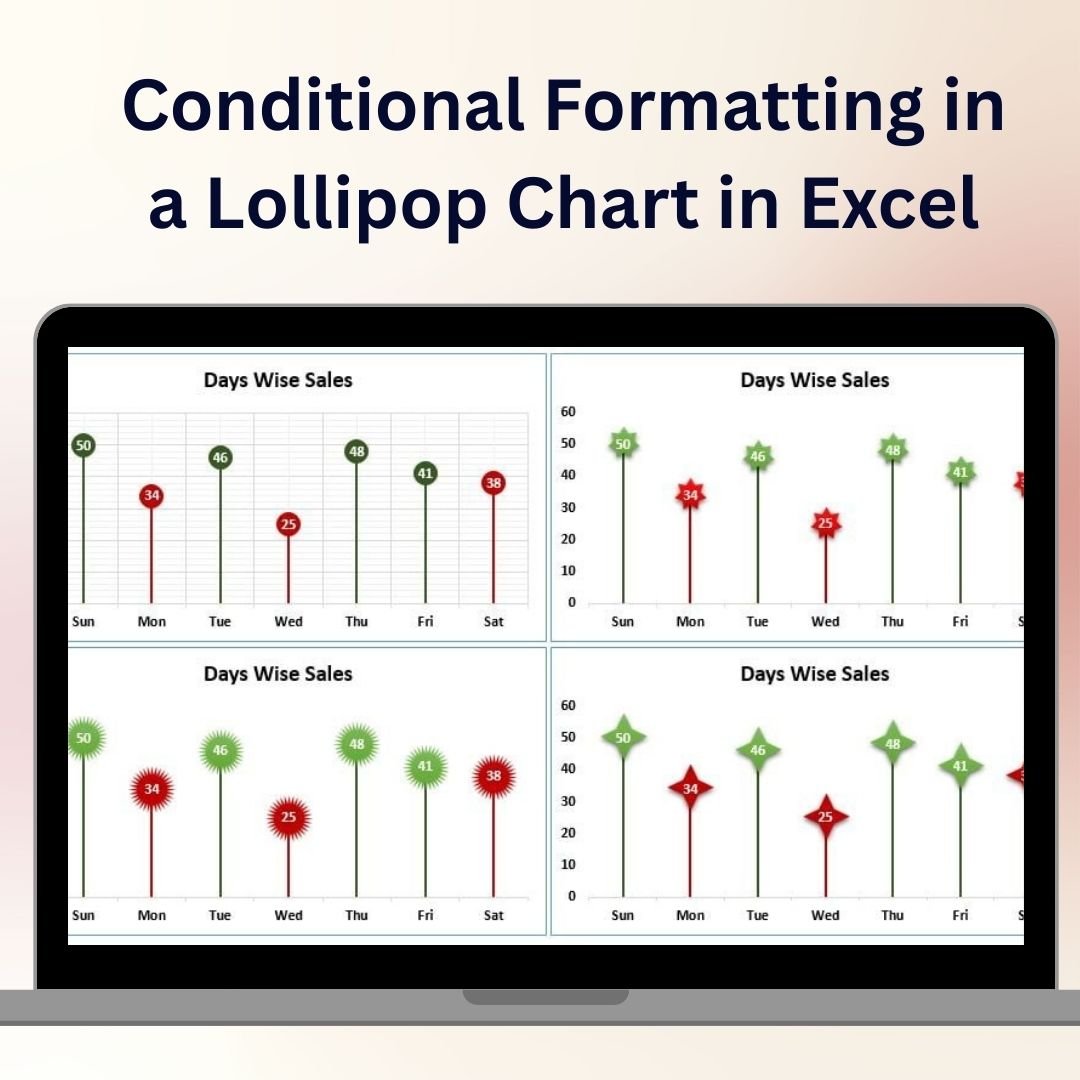
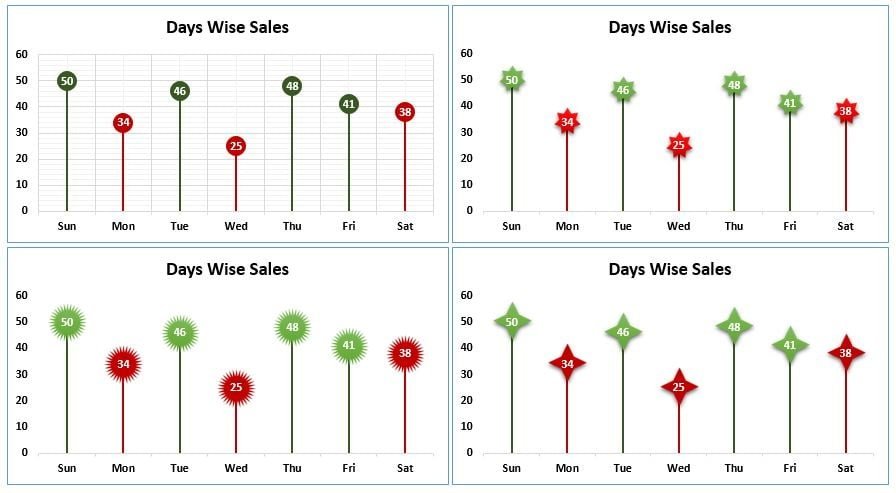

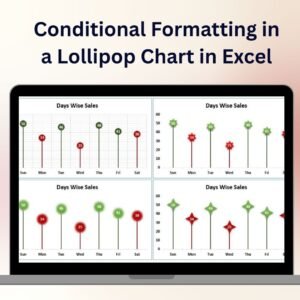
The Conditional Formatting in a Lollipop Chart in Excel is a unique and visually captivating tool designed to help you present your data in an engaging and easy-to-understand format. This template combines the effectiveness of a lollipop chart with the power of conditional formatting, allowing you to highlight specific values and trends within your data dynamically.
Lollipop charts are perfect for visualizing individual data points while maintaining a clean and simple look. By incorporating conditional formatting, you can instantly draw attention to key metrics, outliers, or any other data that needs emphasis. Whether you’re tracking sales performance, project milestones, or employee productivity, this Excel chart helps you communicate your data in a clear, professional, and visually appealing way.

Key Features of the Conditional Formatting in a Lollipop Chart in Excel
🎯 Dynamic Lollipop Chart Design
Track and visualize individual data points using the lollipop chart style, which combines a dot for each data point with a line extending to the value, providing a clear and precise representation of your metrics.
🎨 Conditional Formatting for Key Data Points
Easily highlight specific values or trends using Excel’s conditional formatting tools. This allows you to emphasize important data points, such as high performers, low performers, or any value that stands out.
📈 Track Multiple Metrics
The template allows you to track and compare multiple metrics or data sets within the same chart. You can easily visualize trends and differences between categories or time periods.
📊 Customizable Design
Customize the lollipop chart to match your branding or presentation style. Adjust colors, chart labels, and data points to fit your specific needs and improve your data presentation.
🖥️ Easy to Use & Update
No advanced Excel skills are required to use this template. Simply input your data, and the chart automatically updates with your new values, ensuring real-time insights with minimal effort.
Why You’ll Love the Conditional Formatting in a Lollipop Chart in Excel
✅ Engage Your Audience with Visual Data
Create eye-catching visualizations that help your audience quickly understand key trends and outliers. The lollipop chart makes complex data easy to digest.
✅ Highlight Key Insights Instantly
With the use of conditional formatting, you can easily highlight critical data points such as outliers, high performers, or values that need attention, improving the clarity of your reports.
✅ Simplify Data Communication
Communicate data trends and insights in a visually appealing way without overwhelming your audience. The lollipop chart’s clean design helps maintain focus on key metrics.
✅ Fully Customizable & Interactive
Adjust the chart’s design, colors, and labels to suit your specific needs. The interactive features make it easy to filter and explore your data in more detail.
✅ Save Time & Enhance Productivity
Use this ready-made template to save time on data visualization. Input your data and let the chart do the work, providing immediate insights and visualizations without manual effort.
What’s Inside the Conditional Formatting in a Lollipop Chart Template in Excel?
- Lollipop Chart Design: A simple yet effective chart style that uses dots and lines to represent data points clearly.
- Conditional Formatting: Highlight specific values, trends, or outliers to draw attention to key metrics.
- Customizable Data Points: Adjust data labels, colors, and chart styles to fit your reporting or presentation needs.
- Real-Time Updates: Automatically update the chart as you input new data to track progress, performance, and trends in real time.
- Interactive Features: Easily filter and analyze data by adjusting the chart’s settings.
How to Use the Conditional Formatting in a Lollipop Chart in Excel
1️⃣ Download the Template: Get immediate access to the Conditional Formatting in a Lollipop Chart in Excel.
2️⃣ Input Your Data: Enter your data values and categories into the Excel template.
3️⃣ Customize the Chart: Adjust colors, labels, and formatting to suit your needs.
4️⃣ Track & Visualize Data: Use the lollipop chart to track trends, compare metrics, and highlight key data points using conditional formatting.
Who Can Benefit from the Conditional Formatting in a Lollipop Chart in Excel?
🔹 Business Owners & Entrepreneurs
🔹 Marketing & Sales Teams
🔹 Data Analysts & Financial Professionals
🔹 Project Managers & Team Leaders
🔹 Report Writers & Presenters
🔹 Anyone Looking to Visualize Data Trends in a Clear, Engaging Way
Simplify your data analysis and presentations with the Conditional Formatting in a Lollipop Chart in Excel. Track key metrics, highlight important trends, and present your data visually for maximum impact.
Click here to read the Detailed blog post
Visit our YouTube channel to learn step-by-step video tutorials
Youtube.com/@PKAnExcelExpert
Watch the step-by-step video tutorial:
Compatibility and Requirements
- Works in Microsoft Excel desktop (Excel 2016 or later, or Microsoft 365).
- Key points are highlighted with conditional formatting. Microsoft explains it in Use conditional formatting to highlight information.
Frequently Asked Questions
What is a lollipop chart?
A chart that shows each data point as a dot with a line extending to its value. It gives a clean view of individual values.
What does the conditional formatting do?
It highlights specific values, trends or outliers, such as high or low performers, so they stand out.
Can I compare several metrics?
Yes. You can track and compare multiple metrics or data sets in the same chart.
Does it update with new data?
Yes. Enter your data and the chart updates with the new values.
Related Conditional Formatting Charts
- Conditional Formatting in a Line Chart: the same idea in a line chart
- Conditional Formatting in Excel Chart: color a column chart by rules
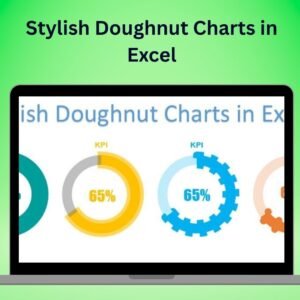
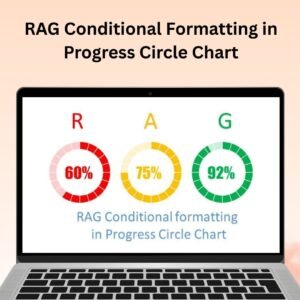
- Conditional Formatting in Stylish Doughnut Chart: rule-based colors in a doughnut chart
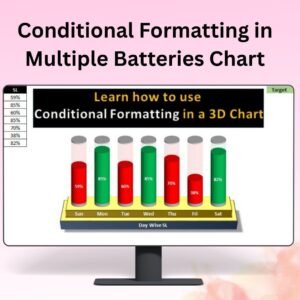
- RAG Conditional Formatting in 3D Chart: red, amber and green status in a 3D chart
- Data Analyst’s Chart & Visualization Pack: 10 chart templates for Excel and Google Sheets in one download
Browse all Excel chart templates or the Excel dashboards.








Reviews
There are no reviews yet.