

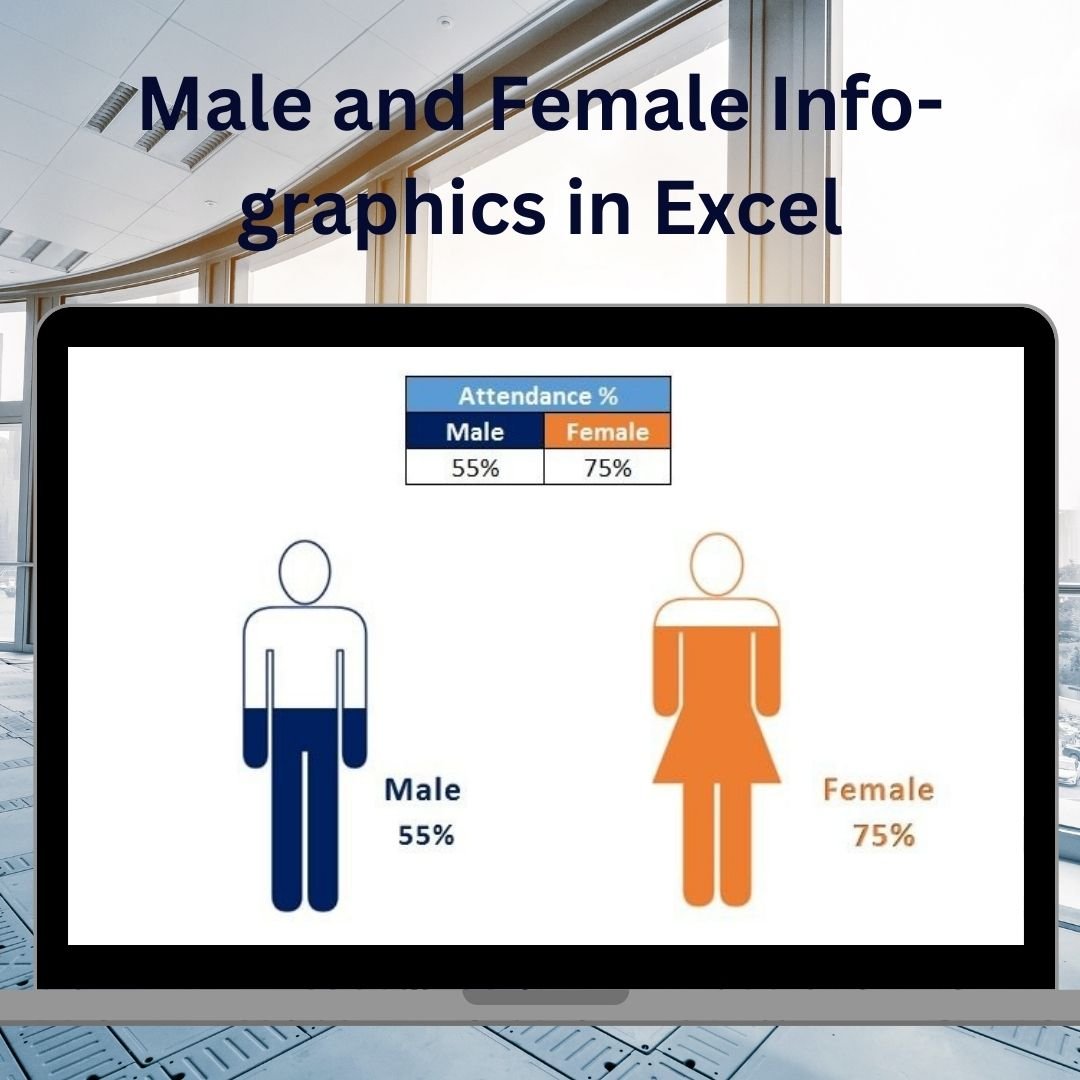

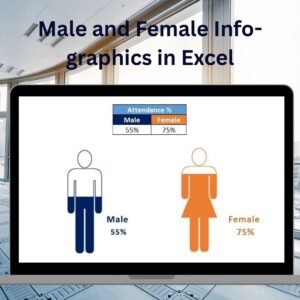
The Male and Female Info-graphics in Excel is a unique and visually appealing template designed to help you present gender-specific data in a dynamic, easy-to-understand infographic format. Whether you’re analyzing demographics, workforce composition, or survey results, this template allows you to visualize gender-related data in a way that is both engaging and informative.
With this Excel template, you can create stunning infographics that compare male and female data across various metrics, such as age groups, income levels, employment statistics, or educational attainment. The tool provides interactive charts, bar graphs, and other visual elements to clearly highlight gender disparities, trends, and insights.
This fully customizable template is perfect for business analysts, HR professionals, market researchers, and anyone who needs to present gender-specific data in a professional and visually compelling manner. The user-friendly layout ensures that no advanced Excel skills are required, making it accessible for all users.
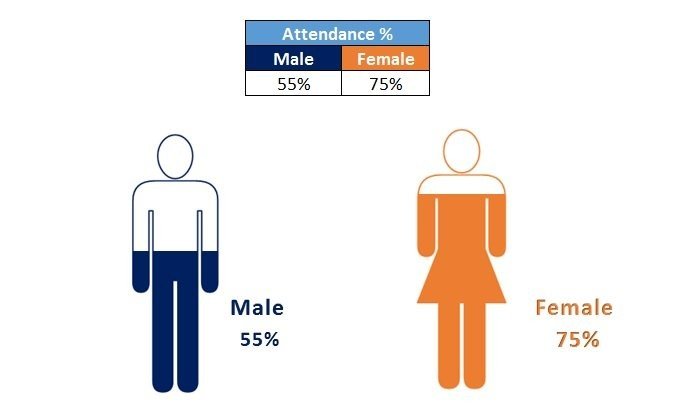
Key Features of the Male and Female Info-graphics in Excel
📊 Gender-Based Data Visualization
Track and visualize gender-specific data such as sales performance, employee distribution, or customer demographics. Create compelling graphics that allow for easy comparisons between male and female data.
🔄 Interactive & Customizable Charts
Use customizable bar charts, pie charts, and other infographic-style visuals to present data dynamically. The template allows for easy customization of colors, layouts, and data inputs.
📉 Track Key Metrics
Track and compare key metrics such as salary distribution, education levels, job roles, and more. Visualize differences between genders with clear, easy-to-read graphics that highlight important insights.
📈 Dynamic & Real-Time Data Updates
As you input new data, the infographics update in real time, ensuring that your visuals are always reflective of the latest information. This dynamic feature saves time and makes it easier to create reports that are up-to-date.
🖥️ User-Friendly Interface
This template is designed to be easy to use with a simple, drag-and-drop interface. No advanced Excel skills are needed to input data and generate stunning infographics.
Why You’ll Love the Male and Female Infographics in Excel
✅ Present Gender-Specific Data in a Clear, Visual Format
Transform complex data into visually compelling graphics that make it easier to understand gender trends and disparities.
✅ Enhance Data Presentation
Impress your audience with professional, easy-to-read infographics that convey gender-based insights effectively. Perfect for presentations, reports, and analyses.
✅ Save Time with Dynamic Data Updates
Input new data and watch the infographics automatically update in real time. No need for manual adjustments or time-consuming redesigns.
✅ Fully Customizable for Your Needs
Customize the charts, color schemes, and layouts to fit your specific data analysis goals. Tailor the template to suit any gender-related data you need to track.
✅ Use Interactive Features to Drill Down Into Data
Use slicers and other interactive features to filter and explore your data from multiple perspectives, gaining deeper insights into gender-based trends.
What’s Inside the Male and Female Infographics in Excel Template?
- Gender-Based Data Visualization: Create infographics to compare male and female data across various metrics.
- Interactive Charts: Customize bar charts, pie charts, and graphs to present your data dynamically.
- Real-Time Data Updates: The template updates automatically as you input new data.
- Customizable Design: Adjust the layout, colors, and data points to suit your analysis.
- User-Friendly Interface: Input data easily and generate professional visuals without advanced Excel skills.
How to Use the Male and Female Infographics in Excel
1️⃣ Download the Template: Get instant access to the Male and Female Infographics template in Excel.
2️⃣ Input Your Data: Enter the data for male and female categories into the template to generate dynamic infographics.
3️⃣ Customize Your Design: Adjust the layout, color schemes, and chart types to match your branding or reporting needs.
4️⃣ Present & Share: Use the visually engaging infographics in your presentations, reports, and business meetings to convey gender-based insights.
Who Can Benefit from the Male and Female Infographics in Excel?
🔹 Business Analysts & Data Scientists
🔹 HR Professionals & Recruiters
🔹 Marketing Teams & Customer Analysts
🔹 Educators & Researchers
🔹 Report Writers & Presenters
🔹 Anyone Analyzing Gender-Specific Data for Business or Research Purposes
Make your data presentations more engaging and informative with the Male and Female Infographics in Excel. Track and visualize gender-based data, uncover trends, and present valuable insights in a visually compelling format.
Click here to read the Detailed blog post
Visit our YouTube channel to learn step-by-step video tutorials
Youtube.com/@PKAnExcelExpert
Watch the step-by-step video tutorial:
Compatibility and Requirements
- Works in Microsoft Excel desktop (Excel 2016 or later, or Microsoft 365).
- Microsoft’s chart basics are in Create a chart from start to finish.
Frequently Asked Questions
What data can I show with this template?
Male and female data across metrics such as age groups, income levels, salary distribution, education levels, job roles or survey results.
Which chart types does it use?
Bar charts, pie charts and other infographic-style visuals.
Does it update when I enter new data?
Yes. The infographics update automatically as you enter new data.
Can I change the layout and colors?
Yes. You can adjust the layout, colors and data points to suit your analysis.
Related Infographic Charts
- Quick Male-Female and Waffle Chart in Excel: another male and female comparison chart
- Mind-Blowing Excel Hack: 3D Waffle Charts in Just Steps: show shares as a grid of squares
- Dynamic Chart with Slicer for Employees Count by Age Group: split staff by age group
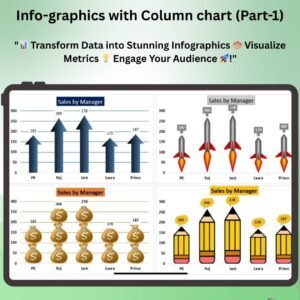
- Info-graphics with Column Chart (Part-2): an infographic column chart
- Data Analyst’s Chart & Visualization Pack: 10 chart templates for Excel and Google Sheets in one download
Browse all Excel chart templates or the Excel dashboards.








Reviews
There are no reviews yet.