

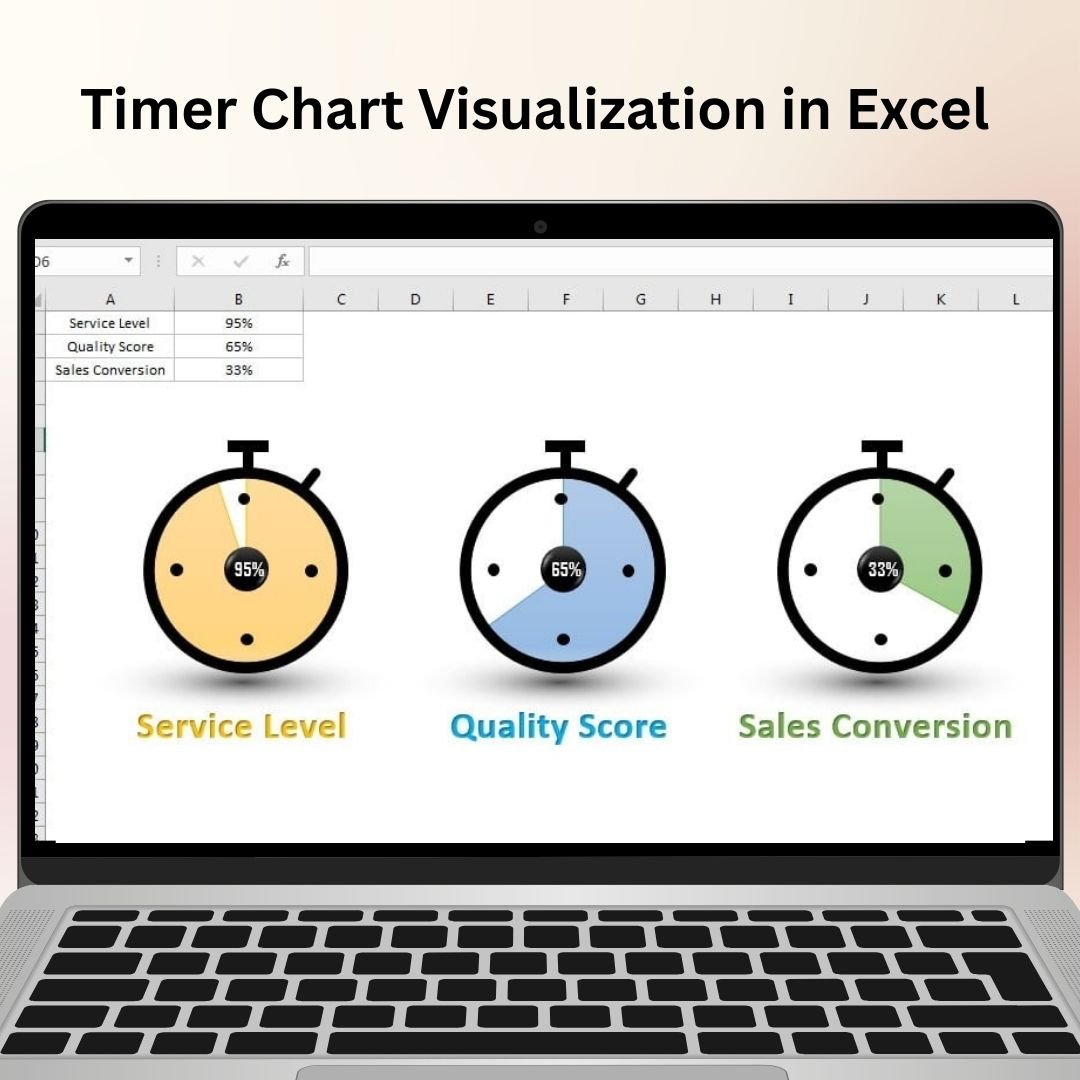

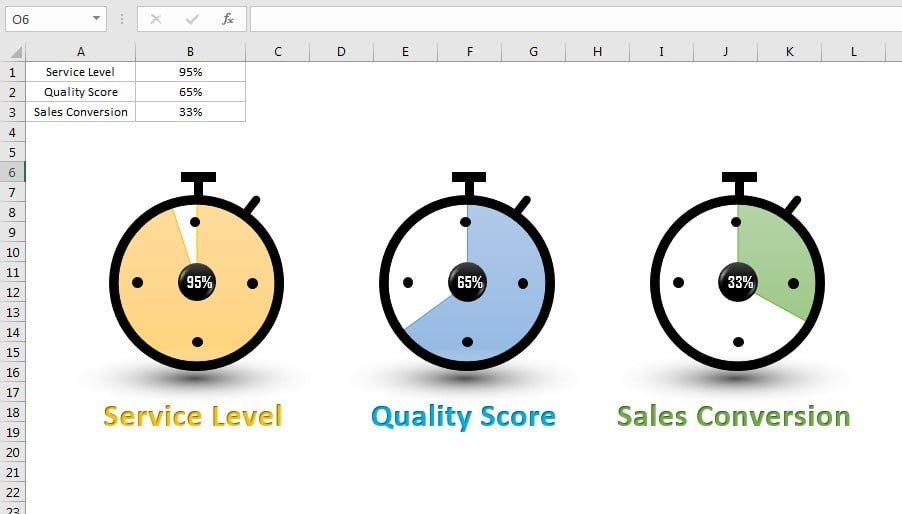
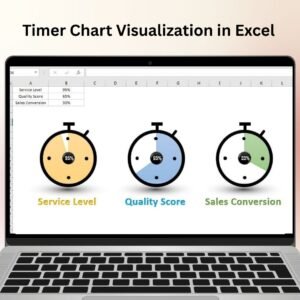
The Timer Chart Visualization in Excel is a unique and innovative tool designed to help you track and visualize time-based data in an intuitive and easy-to-understand way. This chart is ideal for representing project timelines, event durations, task deadlines, and more. It allows you to present time-based data in a visually engaging manner, making it easier to analyze progress and identify trends over time.
The Timer Chart Visualization transforms your raw data into a dynamic visual, highlighting key time milestones and ensuring that you stay on track with deadlines. Whether you’re managing a project, tracking performance, or simply measuring the time taken to complete tasks, this chart helps you see your data in a way that makes sense and provides instant insights.
Key Features of the Timer Chart Visualization in Excel
📌 Time-Based Data Visualization
The Timer Chart is designed to visualize time intervals and progress. You can represent tasks, events, or milestones as bars, with each bar indicating the duration of a specific activity or phase. This makes it easy to track the timeline and identify any delays or completed tasks.
🛠 Customizable Time Intervals
You can set up custom time intervals for your chart, whether it’s hours, days, weeks, or months. This flexibility ensures that you can tailor the visualization to fit any type of project or data set, regardless of the time scale.
💡 Dynamic Progress Tracking
The chart allows you to monitor progress in real time. As you update the data, the chart dynamically adjusts to reflect the changes, making it easier to see which tasks are on track and which ones require more attention.
🔢 Color-Coded Milestones
The Timer Chart includes color coding to represent different stages or milestones of a project or task. You can assign colors to indicate the completion status, making it easier to see at a glance which tasks are finished, in progress, or pending.
🚀 Interactive Data Updates
The chart is interactive and automatically updates as you input new data. Whether you’re tracking multiple tasks or events, the chart will adjust to show the current status, ensuring you always have the latest information at your fingertips.
📊 Ideal for Project Management
This chart is perfect for project managers, team leaders, and anyone needing to track timelines and task durations. It helps you stay organized and ensures that you meet deadlines, making it a valuable tool for efficient project management.
⚙ User-Friendly Setup
Despite its powerful capabilities, the Timer Chart Visualization is easy to set up and use. With a simple interface and clear instructions, you can start visualizing time-based data with just a few clicks.
🚀 Why You’ll Love the Timer Chart Visualization in Excel
✅ Track Time Progress – Visualize the duration of tasks, events, or projects. ✅ Customizable Time Intervals – Adjust the time scale to fit your needs. ✅ Real-Time Updates – The chart dynamically adjusts as data changes. ✅ Color-Coded Milestones – Easily track task status with color indicators. ✅ Ideal for Project Management – Perfect for managing timelines, tasks, and deadlines. ✅ Simple and User-Friendly – Easy to set up with step-by-step instructions.
📂 What’s Inside the Timer Chart Visualization in Excel?
- Time-Based Data Visualization: Display time intervals and progress in a visually engaging way.
- Customizable Time Intervals: Adjust the chart to fit your specific project needs.
- Real-Time Data Updates: Automatically update the chart as you modify your data.
- Color-Coded Milestones: Use color coding to track task completion and progress.
- Step-by-Step Setup Instructions: Clear guide for setting up and customizing the chart.
🔍 How to Use the Timer Chart Visualization in Excel
1️⃣ Download the Template – Instant access to the Excel file upon purchase. 2️⃣ Enter Your Data – Add your tasks or events and their respective start and end times. 3️⃣ Customize the Chart – Adjust time intervals and color codes to fit your project needs. 4️⃣ Monitor Progress – Track the duration of tasks and see their completion status visually. 5️⃣ Update as Needed – The chart will update in real time as new data is entered.
🎯 Who Can Benefit from the Timer Chart Visualization in Excel? 🔹 Project Managers
🔹 Business Analysts
🔹 Operations Managers
🔹 Team Leaders
🔹 Event Planners
🔹 Anyone needing to track time-based data and deadlines
Stay on top of your timelines and improve efficiency with the Timer Chart Visualization in Excel. This tool offers an innovative way to track and visualize time progress, ensuring that you meet deadlines and manage tasks effectively.
Click here to read the Detailed blog post
https://www.pk-anexcelexpert.com/timer-chart-visualization-in-excel/
Visit our YouTube channel to learn step-by-step video tutorials
Watch the step-by-step video tutorial:
Compatibility and Requirements
- Works in Microsoft Excel desktop (Excel 2016 or later, or Microsoft 365).
- Microsoft explains how Excel charts work in Create a chart from start to finish.
Frequently Asked Questions
What does the timer chart show?
Tasks, events or milestones appear as bars, and each bar shows the duration of an activity or phase.
What data do I enter?
Your tasks or events with their start and end times. The chart updates as you change the data.
Can I change the time scale?
Yes. You can set the intervals to hours, days, weeks or months.
Can I color tasks by status?
Yes. You assign colors to show which tasks are finished, in progress or pending.
Are setup instructions included?
Yes. The file comes with step-by-step instructions for setting up and customizing the chart.
Related Excel Chart Templates
- Horizontal Timeline Chart in Excel: show milestones on a timeline
- Vertical Timeline Chart in Excel: a vertical timeline layout
- Stylish Progress Bar Chart in Excel: show progress as bars
- Power Gantt Chart in Excel: plan tasks on a Gantt chart
- Data Analyst’s Chart & Visualization Pack: 10 chart templates in one download
Browse all Excel charts and visualizations or the Excel project management templates.






Reviews
There are no reviews yet.