

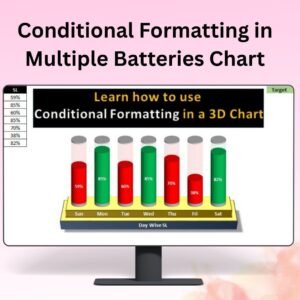
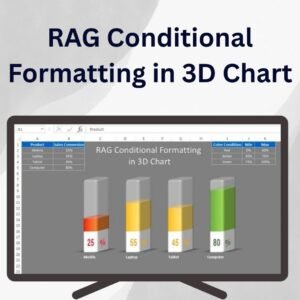
The RAG Conditional Formatting in 3D Chart in Excel is an advanced data visualization tool that allows you to represent performance data in a 3D chart using the Red, Amber, Green (RAG) system. This chart helps you visually categorize and track key performance indicators (KPIs) or any other data that can be classified into different status levels based on color. By utilizing the RAG color scheme, it becomes easier to identify areas that require attention and monitor progress in a visually engaging way.
The RAG Conditional Formatting in 3D Chart not only makes your data more interactive and appealing but also ensures that you can interpret the status of your metrics quickly and clearly. Whether you are tracking project progress, sales goals, or other performance metrics, this chart is ideal for decision-makers who need to keep track of multiple parameters at once, providing immediate insight into where things stand.

Key Features of the RAG Conditional Formatting in 3D Chart
📌 3D Visualization
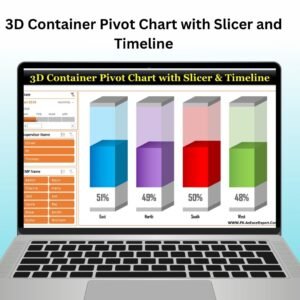
This chart uses a 3D design to make your data more dynamic and visually engaging. The 3D aspect adds depth to your presentation, making it stand out in reports or presentations.
🛠 RAG Color Coding
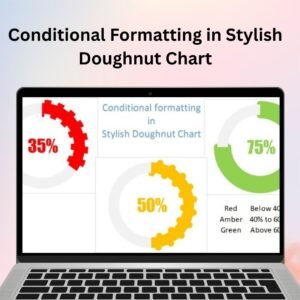
The RAG (Red, Amber, Green) color coding system is applied using Conditional Formatting to categorize and represent performance status. Red signifies critical issues, Amber indicates caution or moderate progress, and Green shows that the target or goal is being met.
💡 Customizable Conditional Formatting
You have full control over the RAG thresholds, allowing you to define your own criteria for each color. This flexibility makes it easy to adapt the chart to any type of data, whether it’s project performance, sales goals, or financial metrics.
🔢 Dynamic Updates
As your data changes, the RAG Conditional Formatting in 3D Chart automatically updates, providing real-time visual feedback on your data. This ensures that your chart always reflects the latest information without requiring manual adjustments.
🚀 Clear Data Presentation
The 3D RAG chart provides an easy-to-understand visual representation of complex data, making it ideal for stakeholders or teams who need to make quick decisions based on the status of various metrics.
📊 Perfect for Dashboards and Reports
Whether you’re creating a performance dashboard, a sales report, or a project status update, this 3D RAG chart will make your data more visually engaging and easier to interpret.
⚙ User-Friendly Setup
Setting up the RAG Conditional Formatting in 3D Chart is simple, even for those who are not advanced Excel users. The chart comes with clear instructions for creating and customizing it to suit your needs.
🚀 Why You’ll Love the RAG Conditional Formatting in 3D Chart
✅ Interactive 3D Design – Adds depth to your data presentation. ✅ Customizable RAG Thresholds – Tailor the chart to your specific performance data. ✅ Real-Time Updates – Automatically refreshes when the data is changed. ✅ Perfect for Dashboards – Ideal for performance tracking, project management, and KPIs. ✅ Clear Data Interpretation – Quickly identify areas that need attention with the color-coded system.
📂 What’s Inside the RAG Conditional Formatting in 3D Chart?
- 3D Conditional Chart: A dynamic chart with Red, Amber, and Green colors.
- Customizable RAG Thresholds: Set your own thresholds for each color to match your data.
- Real-Time Updates: The chart automatically reflects changes in your data.
- Step-by-Step Setup Instructions: Easy-to-follow guide for creating and customizing the chart.
🔍 How to Use the RAG Conditional Formatting in 3D Chart
1️⃣ Download the Template – Instant access to the Excel file upon purchase. 2️⃣ Input Your Data – Enter your performance data into the Excel sheet. 3️⃣ Customize RAG Settings – Adjust the RAG thresholds to match your needs. 4️⃣ Track Performance – The chart will visually represent your data as it updates in real-time. 5️⃣ Share and Present – Use the chart in reports or presentations to show the status of your metrics.
🎯 Who Can Benefit from the RAG Conditional Formatting in 3D Chart? 🔹 Project Managers
🔹 Business Analysts
🔹 Sales Teams
🔹 Operations Managers
🔹 Financial Analysts
🔹 Anyone looking for an interactive and dynamic way to track performance
Make your data more interactive and engaging with the RAG Conditional Formatting in 3D Chart. This tool provides a visually clear way to track key performance metrics and is perfect for use in dashboards, reports, and presentations.
Click here to read the Detailed blog post
https://www.pk-anexcelexpert.com/rag-conditional-formatting-in-3d-chart/
Visit our YouTube channel to learn step-by-step video tutorials
Watch the step-by-step video tutorial:
Compatibility and Requirements
- Works in Microsoft Excel desktop (Excel 2016 or later, or Microsoft 365).
- The RAG colors come from Excel conditional formatting rules you can edit.
- Learn more in Use conditional formatting to highlight information on Microsoft Support.
Frequently Asked Questions
What do the three colors mean?
Red marks critical issues, Amber shows caution or moderate progress, and Green shows the target is being met.
Can I set my own thresholds?
Yes. You define the criteria for each color, so the chart fits project, sales or financial data.
Does the chart update when my data changes?
Yes. The chart and its colors update automatically when you change the data.
Are setup instructions included?
Yes. The file comes with step-by-step instructions for creating and customizing the chart.
Related RAG and 3D Chart Templates
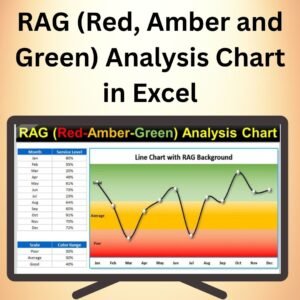
- RAG (Red, Amber and Green) Analysis Chart in Excel: a flat RAG status chart
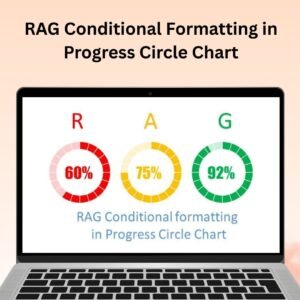
- RAG Conditional Formatting in Progress Circle Chart: RAG colors on a progress circle
- RAG waffle Chart visualization with Slicer: a waffle chart with a slicer
- 3D Gauge Chart in Excel: another 3D chart for KPIs
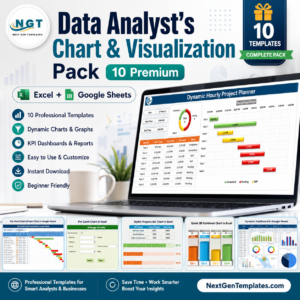
- Data Analyst’s Chart & Visualization Pack: 10 chart templates in one bundle
Browse all Excel charts and visualization templates or the Excel KPI dashboards.







Reviews
There are no reviews yet.