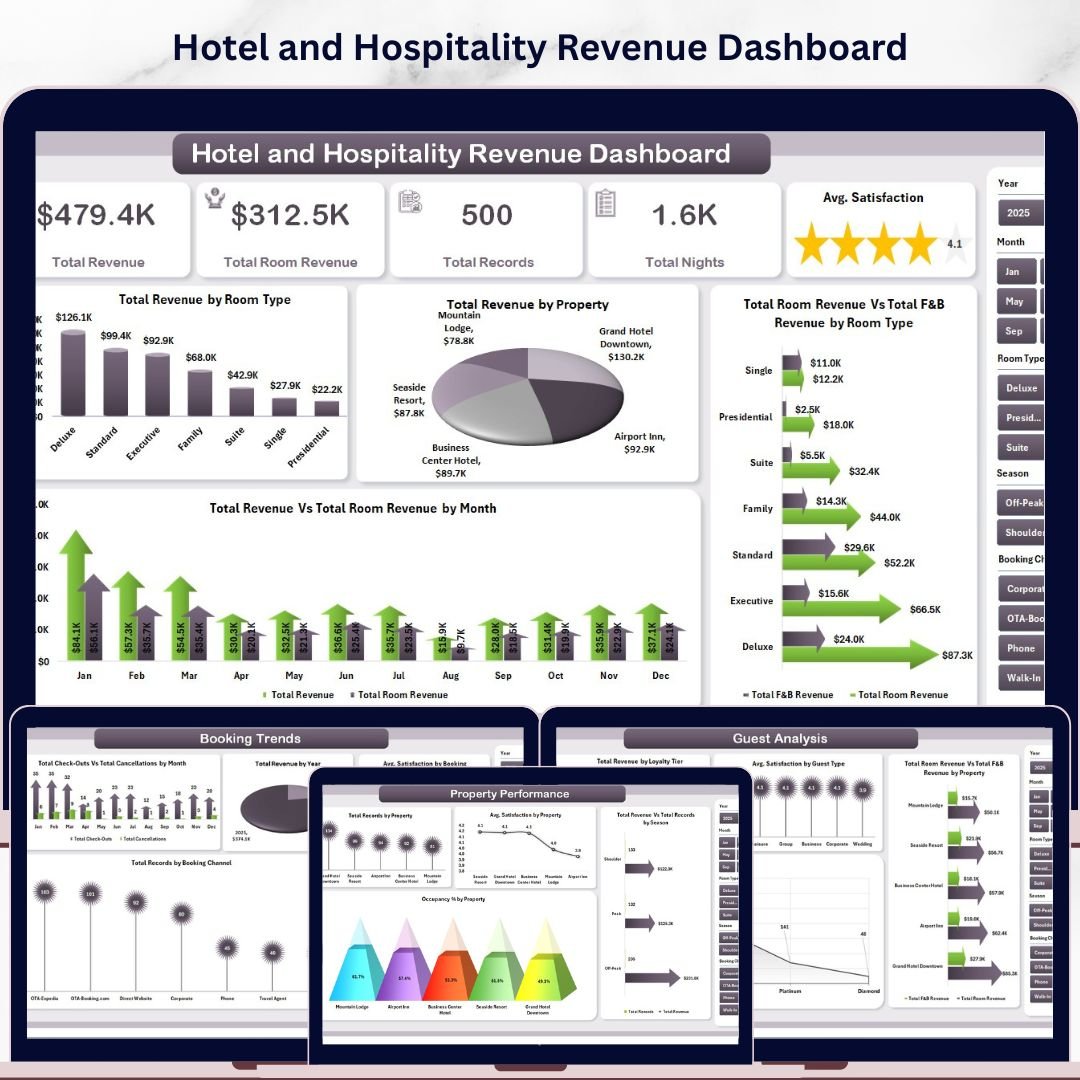


Hotel and Hospitality Revenue Dashboard in Excel is a professionally designed, ready-to-use Excel dashboard template that gives hotel managers, revenue analysts, and hospitality professionals a complete view of their property’s financial performance. This template includes 5 interactive dashboard pages, a structured data sheet, and a support sheet with pivot tables — covering everything from room revenue and F&B analysis to guest satisfaction, booking trends, and property-level occupancy tracking. With built-in slicers for quick filtering and auto-refreshing pivot charts, you get instant clarity on how your hotel business is performing across every key metric.
🔑 Key Features of Hotel and Hospitality Revenue Dashboard in Excel
📌 5 Interactive Dashboard Pages – Overview, Revenue Breakdown, Guest Analysis, Property Performance, and Booking Trends give you a 360-degree view of hotel operations and revenue streams.
📌 KPI Summary Cards – Instantly view Total Revenue, Total Room Revenue, Total Records, Total Nights, and Avg. Satisfaction right at the top of the Overview page.
📌 Dynamic Slicer Filters – Apply filters across all dashboard pages using Excel slicers for quick, interactive analysis by property, room type, season, booking channel, and more.
📌 Pivot-Powered Auto-Refresh – All charts are driven by pivot tables in the Support sheet. Simply update your data and click Refresh All to update every chart instantly.
📌 Guest Satisfaction Tracking – Monitor average satisfaction scores by guest type, property, booking channel, and loyalty tier to identify service gaps and improvement areas.
📌 Revenue Segmentation – Break down revenue by room type, booking channel, guest type, and property to understand where your money is really coming from.
📌 Booking Trend Analysis – Track check-outs vs cancellations by month, revenue by year, and booking channel distribution to spot seasonal patterns and optimize pricing strategy.
📌 No VBA or Macros Required – This template runs entirely on Excel formulas, pivot tables, and charts. Compatible with Excel 2016 and later versions.
📦 What’s Inside the Hotel and Hospitality Revenue Dashboard
This Excel dashboard contains 7 sheet tabs designed to deliver actionable hospitality insights:
1. Overview Page — The main landing page displays high-level KPI cards showing Total Revenue, Total Room Revenue, Total Records, Total Nights, and Avg. Satisfaction. Below the cards, interactive charts visualize Total Revenue by Room Type, Total Revenue by Property, Total Room Revenue Vs Total F&B Revenue by Room Type, and Total Revenue Vs Total Room Revenue by Month. Multiple slicers let you filter the entire dashboard instantly.
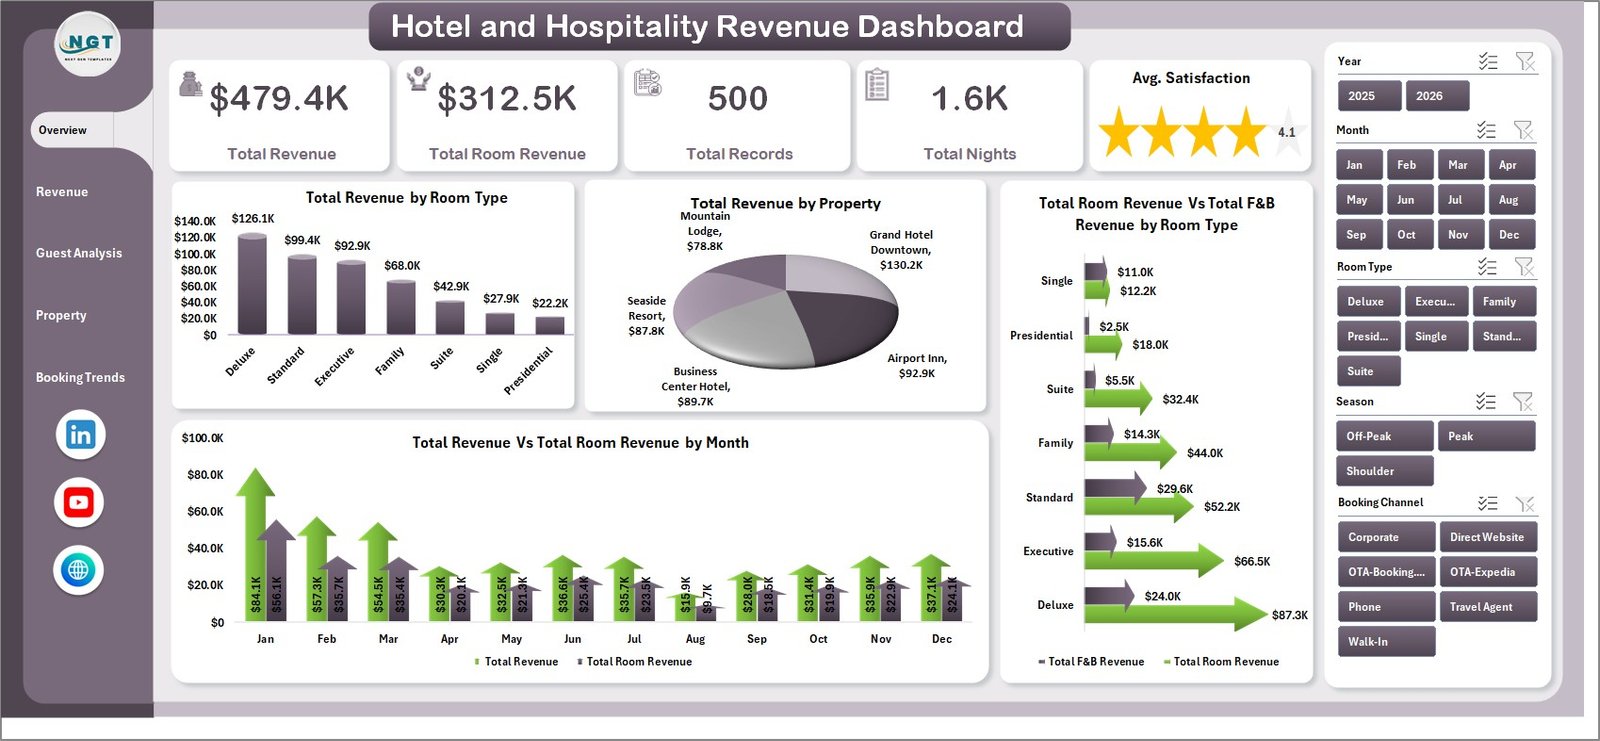
Hotel and Hospitality Revenue Dashboard
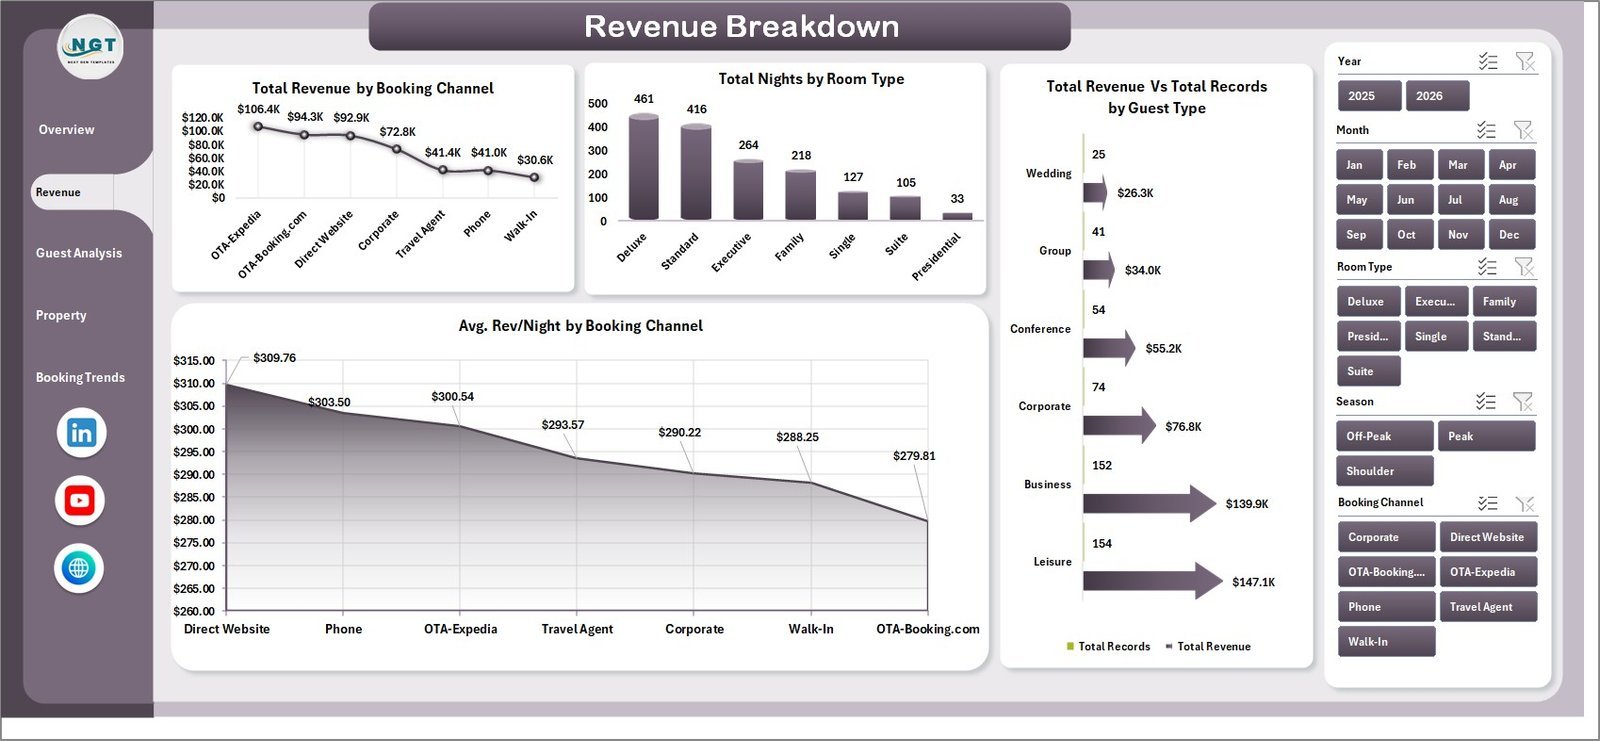
2. Revenue Breakdown Page — This page dives deeper into revenue segmentation with charts for Total Revenue by Booking Channel, Total Nights by Room Type, Total Revenue Vs Total Records by Guest Type, and Avg. Rev/Night by Booking Channel. Understand which channels and guest segments drive the most value.
 Revenue Breakdown
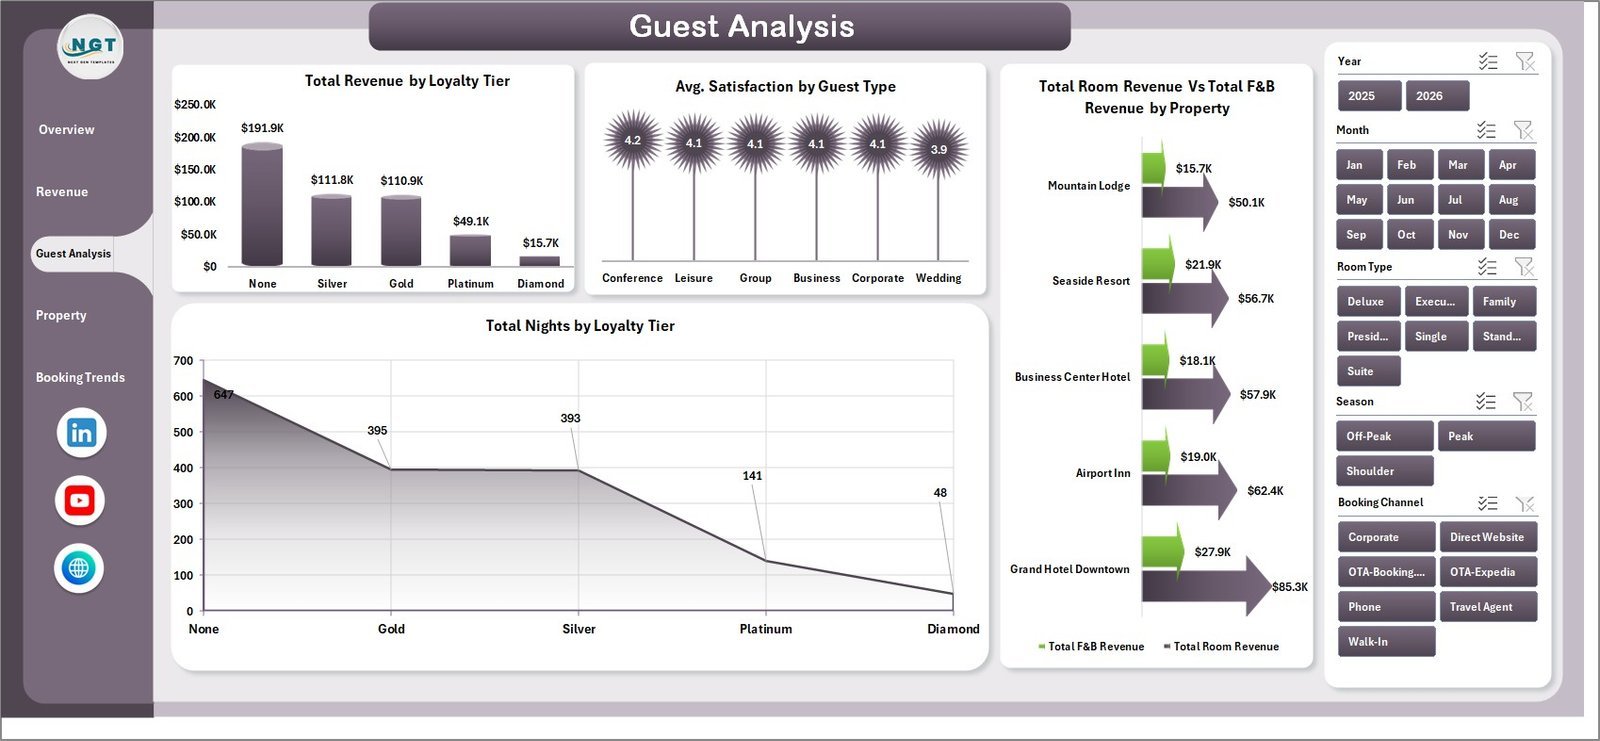
3. Guest Analysis Page — Explore guest-level insights through Total Revenue by Loyalty Tier, Avg. Satisfaction by Guest Type, Total Room Revenue Vs Total F&B Revenue by Property, and Total Nights by Loyalty Tier. Identify your most valuable guest segments and loyalty program effectiveness.
 Guest Analysis
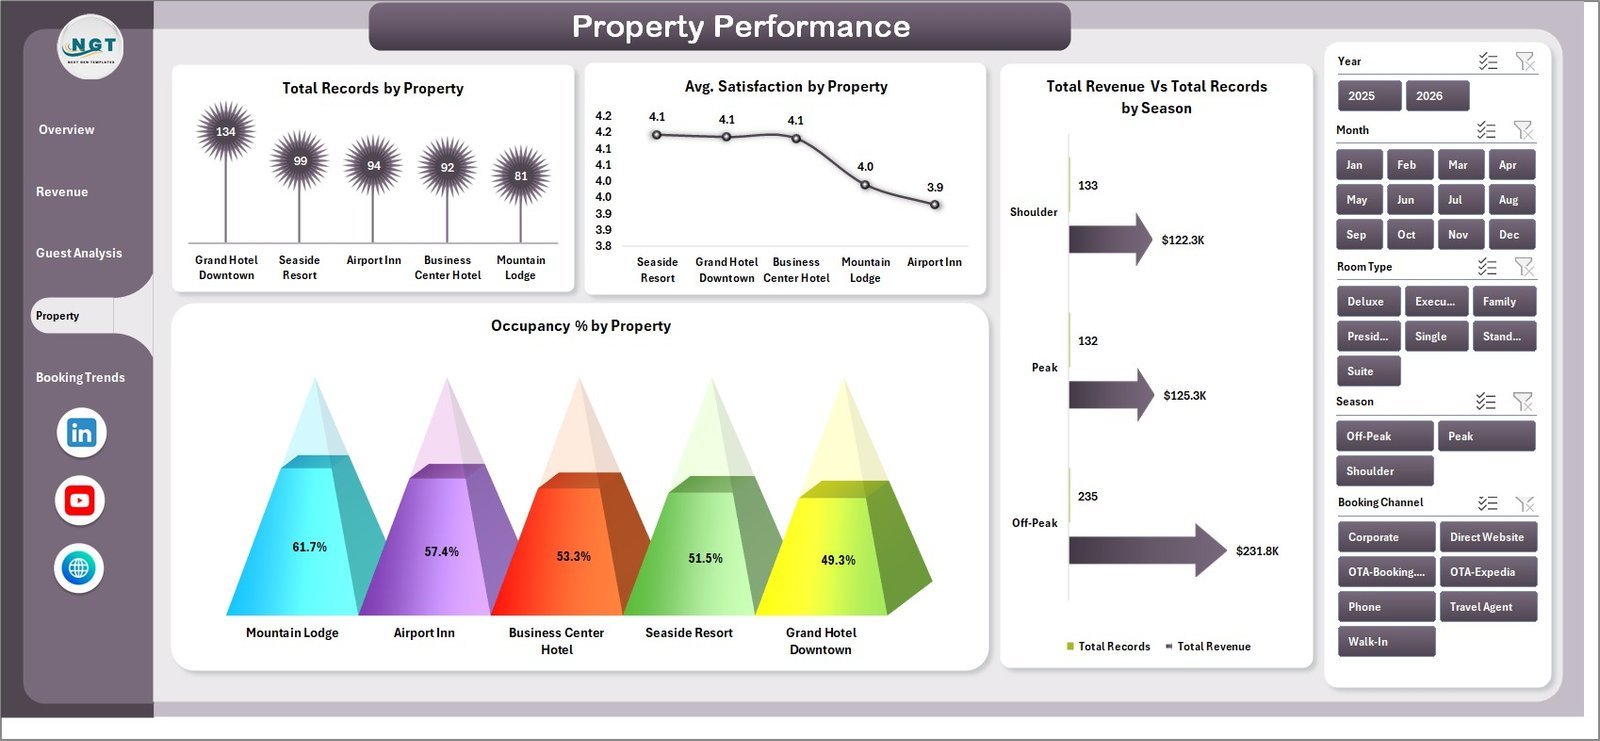
4. Property Performance Page — Compare properties side by side with Total Records by Property, Avg. Satisfaction by Property, Total Revenue Vs Total Records by Season, and Occupancy % by Property. This page helps multi-property operators benchmark and optimize each location.
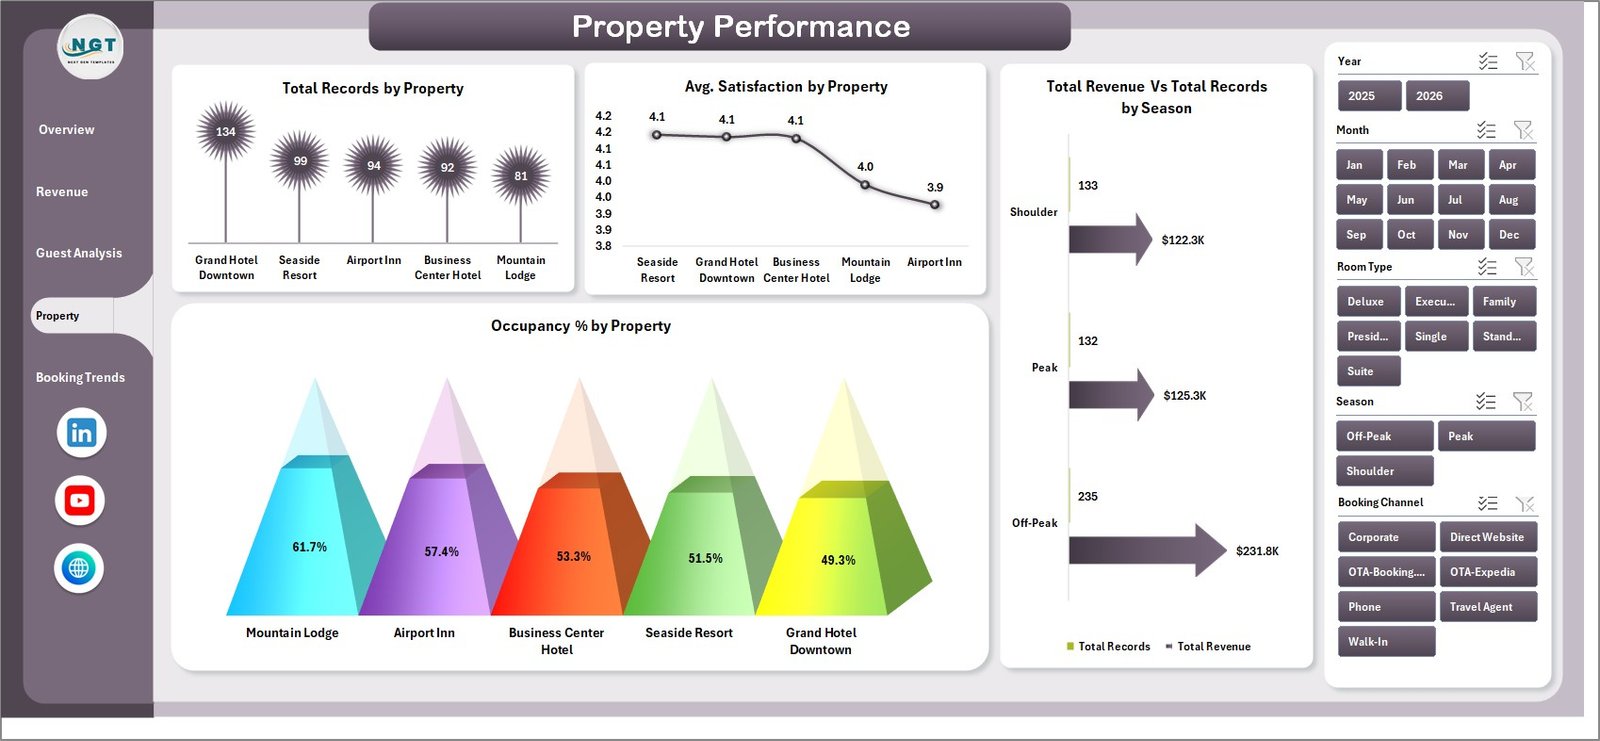 Property Performance
5. Booking Trends Page — Track patterns over time with Total Check-Outs Vs Total Cancellations by Month, Total Revenue by Year, Avg. Satisfaction by Booking Channel, and Total Records by Booking Channel. Spot seasonal trends and optimize your revenue management strategy.
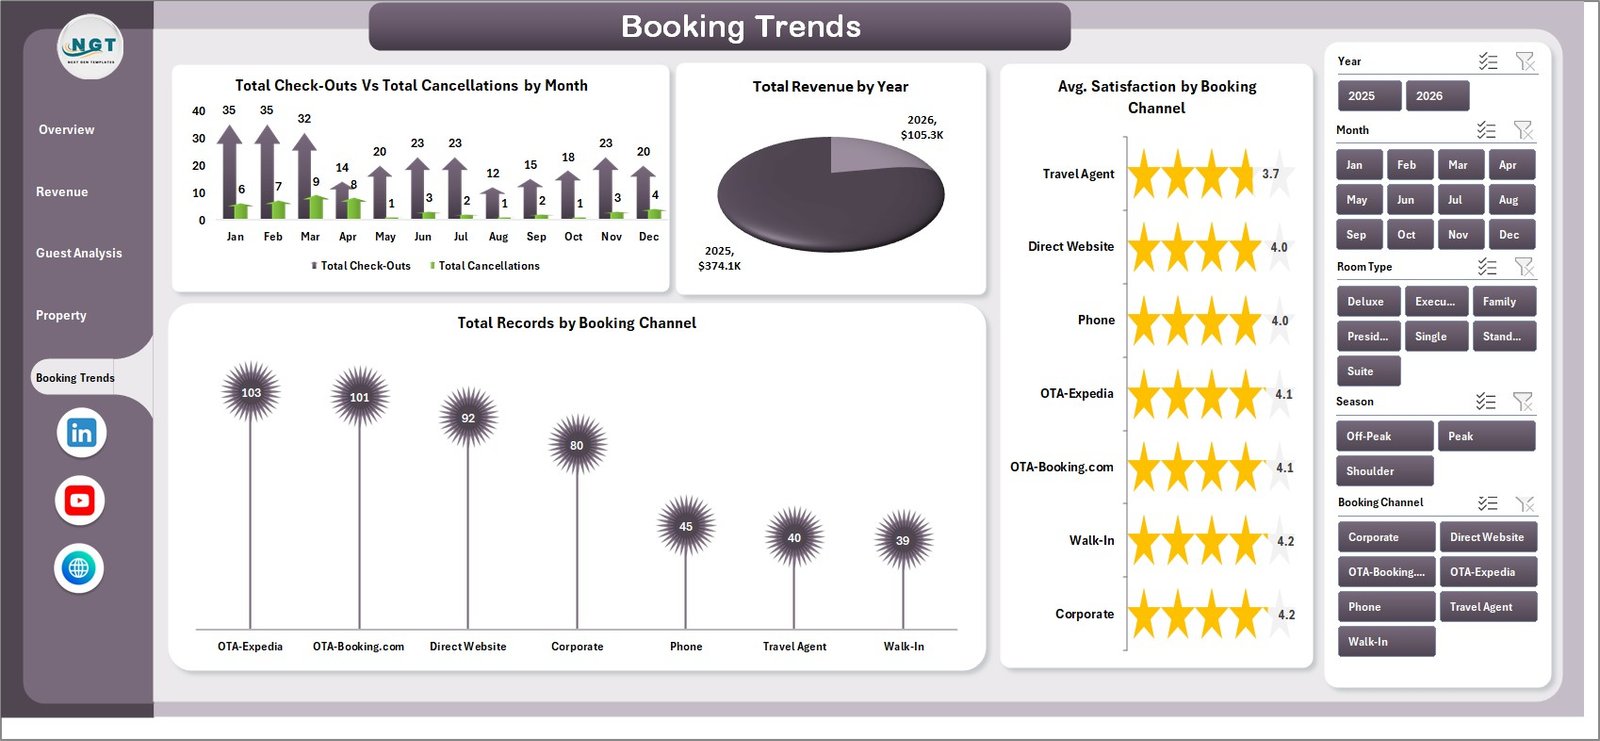 Booking Trends
6. Data Sheet — This is where all your raw data lives. Enter your hotel booking records in the pre-formatted columns and the entire dashboard updates automatically when you refresh the pivots.
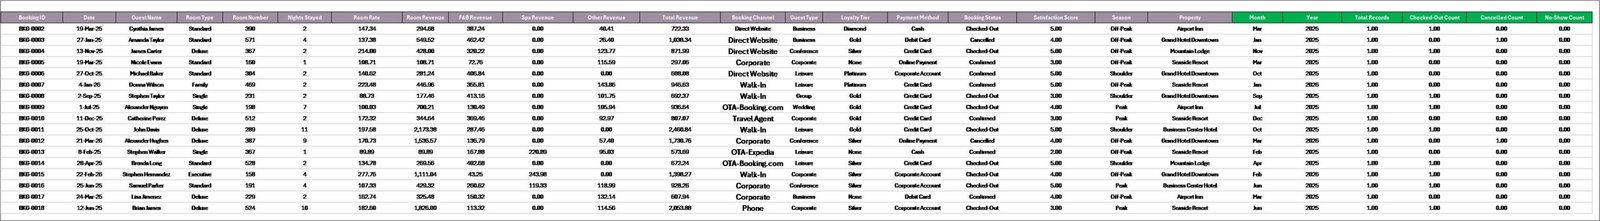 Data Sheet Tab
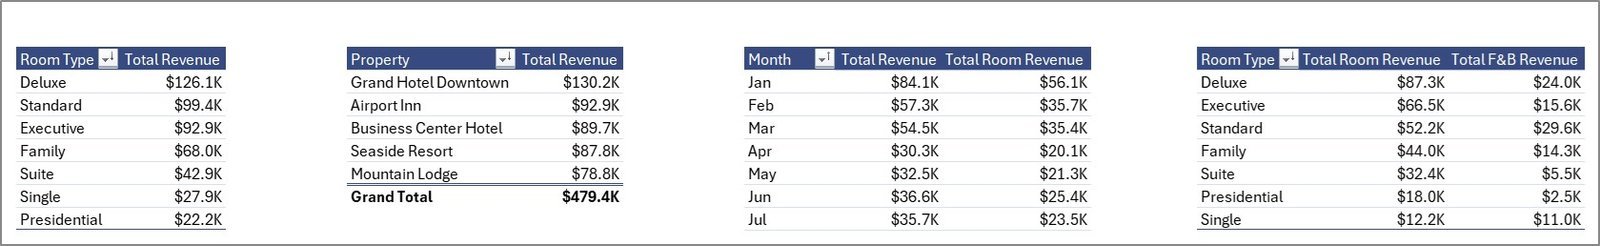
7. Support Sheet — Contains all the pivot tables that power the dashboard. After updating data, go to the Data tab in Excel’s ribbon and click Refresh All — every pivot and chart updates instantly. You can keep this sheet hidden during daily use.
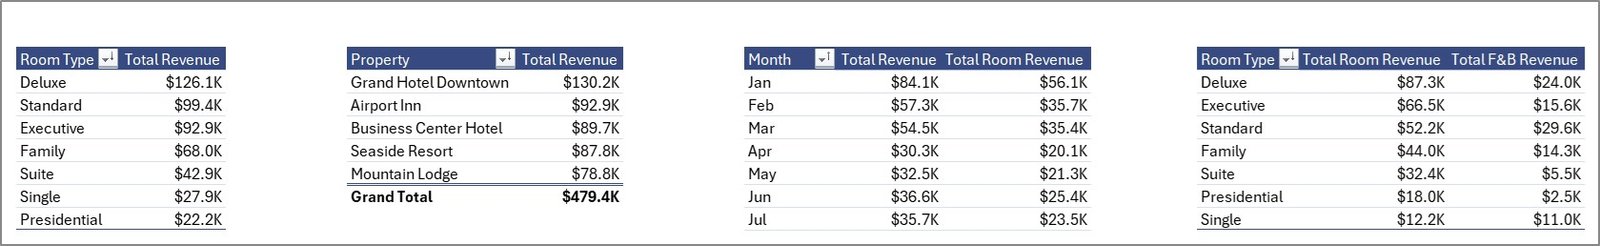 Support Sheet Tab
⚙️ How to Use the Hotel and Hospitality Revenue Dashboard
1️⃣ Download and open the Excel file in Microsoft Excel 2016 or later.
2️⃣ Navigate to the Data Sheet tab and replace the sample data with your own hotel booking records in the same column format.
3️⃣ Go to the Data tab in Excel’s ribbon and click Refresh All to update all pivot tables and charts.
4️⃣ Use the slicers on each dashboard page to filter by property, room type, booking channel, season, loyalty tier, and more.
5️⃣ Explore each of the 5 dashboard pages — Overview, Revenue Breakdown, Guest Analysis, Property Performance, and Booking Trends — for deep insights into your hotel’s performance.
👥 Who Can Benefit from This Dashboard
📌 Hotel General Managers tracking overall property performance and revenue
📌 Revenue Managers analyzing booking channels, ADR, and occupancy patterns
📌 Hospitality Analysts benchmarking multiple properties and guest segments
📌 Resort Operators monitoring seasonal trends and loyalty program effectiveness
📌 Finance Teams in the hospitality industry needing quick revenue breakdowns
📌 Students and Educators studying hospitality management and business intelligence
❓ Frequently Asked Questions
What KPIs does the Hotel and Hospitality Revenue Dashboard track?
The Hotel and Hospitality Revenue Dashboard in Excel tracks 5 key metrics on the Overview page: Total Revenue, Total Room Revenue, Total Records, Total Nights, and Average Satisfaction. Additional analysis covers revenue by room type, booking channel, guest type, property, loyalty tier, occupancy percentage, and cancellation trends.
Do I need advanced Excel skills to use this hotel dashboard?
No. Simply replace the sample data in the Data Sheet with your own hotel booking records, then click Refresh All in Excel’s Data tab. All pivot tables, charts, and KPI cards update automatically — no formulas to edit or macros to run.
Can I use this dashboard for multiple hotel properties?
Yes. The dashboard includes a Property Performance page that compares Total Records, Avg. Satisfaction, Revenue, and Occupancy % across multiple properties. Just include all property data in the Data Sheet and use slicers to filter by property.
What is the best Excel template for tracking hotel revenue?
The Hotel and Hospitality Revenue Dashboard in Excel is one of the best options available. It provides 5 interactive pages covering revenue breakdown, guest analysis, property performance, and booking trends — all powered by pivot tables that auto-refresh with your data.
Is this dashboard compatible with Google Sheets?
This template is designed specifically for Microsoft Excel 2016 and later. For a Google Sheets alternative, check out the Hospitality & Guest Booking Performance Dashboard in Google Sheets.
How do I customize the charts and slicers?
The charts are linked to pivot tables in the Support sheet. You can modify pivot field settings, add new fields, or change chart types directly in Excel. Slicers can be connected to additional pivots for even more interactive filtering.
🔗 Explore Related Templates
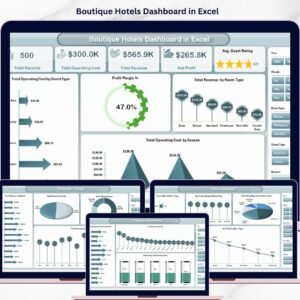
📌 Boutique Hotels Dashboard in Excel – Focused analytics for boutique hotel operations and guest experience tracking.
📌 Hotel Chains KPI Dashboard in Excel – Track chain-wide KPIs across multiple hotel locations with scorecard-style metrics.
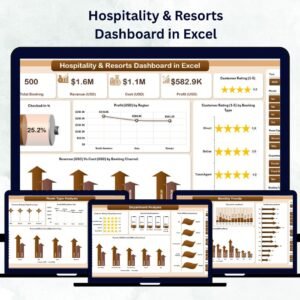
📌 Hospitality & Resorts KPI Dashboard in Excel – Comprehensive KPI tracking for resorts and hospitality businesses.
📌 Browse all Excel Dashboard Templates on NextGenTemplates.
📖 Click here to read the Detailed Blog Post
🎥 Visit our YouTube channel to learn step-by-step video tutorials
👉 YouTube.com/@NextGenTemplates


Reviews
There are no reviews yet.