



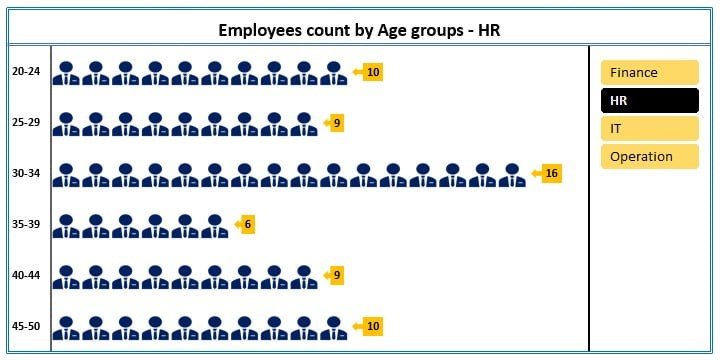
The Dynamic Chart with Slicer for Employees Count by Age Group in Excel is an advanced tool designed to help HR departments, managers, and business owners analyze and visualize employee distribution across different age groups. This interactive chart allows you to quickly assess workforce demographics by automatically updating with a slicer, making it easier to filter and explore employee data by specific age ranges.
Whether you’re tracking recruitment trends, analyzing workforce diversity, or simply need a dynamic visual representation of your employees’ age distribution, this chart is the perfect solution. With real-time updates and customizable features, the Dynamic Chart with Slicer provides a clear, engaging, and easy-to-understand view of employee demographics, helping you make informed decisions and presentations.
Key Features of the Dynamic Chart with Slicer for Employees Count by Age Group
📌 Interactive Slicer for Easy Filtering
The slicer allows you to interact with the data dynamically, enabling you to filter employee age groups with just a click. This feature makes it easy to zoom in on specific age categories, providing a more detailed breakdown of your workforce.
🛠 Customizable Age Groups
You can customize the age groups to fit your organization’s specific needs. Whether you want to track employees in specific age ranges like 20-30, 30-40, or more granular age divisions, the chart can be tailored to reflect your required metrics.
💡 Real-Time Data Updates
As you modify or input new employee data, the chart updates automatically to reflect those changes in real-time. This ensures that your data visualizations are always up-to-date, saving you time and ensuring accuracy in your reports.
🔢 Clear and Dynamic Visual Representation
The chart presents employee data with vibrant, easy-to-understand visuals, using age group-specific segments to help you quickly assess employee distribution. With this dynamic chart, you can instantly compare different age groups and spot trends in your workforce.
🚀 Versatile Use Cases
This dynamic chart is perfect for HR professionals, team leaders, or anyone who needs to analyze employee demographics. It’s a useful tool for visualizing trends in workforce age, understanding diversity, and planning for future recruitment needs.
📊 Clean and Professional Design
With its professional, polished look, this chart is ideal for presentations, reports, or meetings. The design ensures that your data is clearly presented, making it easy for your audience to digest key insights.
⚙ Simple Setup and Customization
Setting up the Dynamic Chart with Slicer is simple, even for those with limited Excel experience. With clear setup instructions and customization options, you can get the chart up and running in no time, allowing you to tailor it to your needs.
🚀 Why You’ll Love the Dynamic Chart with Slicer for Employees Count by Age Group
✅ Dynamic Filtering – Use the slicer to filter data and focus on specific age groups. ✅ Customizable Age Groups – Adjust the age ranges and labels to suit your needs. ✅ Real-Time Data Updates – Automatically update the chart as new employee data is entered. ✅ Clear and Engaging Visuals – Easily understand employee distribution across age groups. ✅ Simple Setup – Quick to implement and easy to customize for your specific needs.
📂 What’s Inside the Dynamic Chart with Slicer for Employees Count by Age Group?
- Dynamic Age Group Chart: A visual chart that dynamically adjusts as you filter employee data by age group.
- Customizable Slicer: Easily filter and view specific employee age groups.
- Real-Time Data Updates: The chart adjusts automatically as new data is entered or modified.
- Clear Setup Instructions: Easy-to-follow steps to get the chart up and running.
🔍 How to Use the Dynamic Chart with Slicer for Employees Count by Age Group
1️⃣ Download the Template – Instant access to the Excel file upon purchase. 2️⃣ Input Your Employee Data – Enter employee age information to generate the chart. 3️⃣ Customize the Age Groups – Adjust the age ranges as needed to reflect your organization’s categories. 4️⃣ Interact with the Slicer – Use the slicer to filter data by specific age groups and track employee distribution. 5️⃣ Analyze and Present – Use the dynamic chart to analyze your workforce’s age demographics and present insights in reports or meetings.
🎯 Who Can Benefit from the Dynamic Chart with Slicer for Employees Count by Age Group? 🔹 HR Managers
🔹 Business Owners
🔹 Recruitment Teams
🔹 Workforce Analysts
🔹 Team Leaders
🔹 Anyone looking to track and visualize workforce demographics
Make workforce analysis easier with the Dynamic Chart with Slicer for Employees Count by Age Group. This interactive tool allows you to filter and analyze employee age data efficiently, helping you make more informed decisions for your organization.
Click here to read the Detailed blog post
https://www.pk-anexcelexpert.com/dynamic-chart-with-slicer-for-employees-count-by-age-group/
Visit our YouTube channel to learn step-by-step video tutorials
Watch the step-by-step video tutorial:
Compatibility and Requirements
- Works in Microsoft Excel desktop (Excel 2016 or later, or Microsoft 365).
- The chart is filtered with a slicer. Microsoft explains slicers in Use slicers to filter data.
Frequently Asked Questions
What does the chart show?
It shows how many employees fall into each age group. The chart updates as you filter it with the slicer.
Can I change the age groups?
Yes. You can set your own ranges, such as 20 to 30 or 30 to 40, or use smaller divisions.
Does the chart update when I add employees?
Yes. When you add or change employee data, the chart updates to match.
What comes in the download?
The Excel file with the age group chart, the slicer and setup steps.
Related Chart Templates
- Quick Dynamic Sales by Employees Chart with Slicer in Excel: the same slicer approach for sales by employee
- Stylish Pivot Chart with Slicer in Excel: a pivot chart driven by a slicer
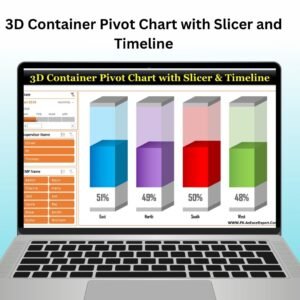
- 3D Container Pivot Chart with Slicer and Timeline: a 3D pivot chart with a slicer and a timeline
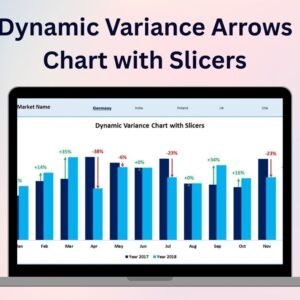
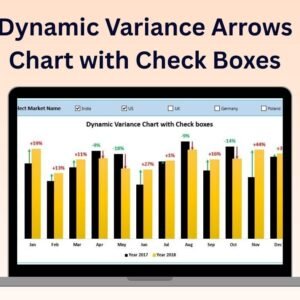
- Dynamic Variance Arrows Chart with Slicers: variance arrows you filter with slicers
- Data Analyst’s Chart & Visualization Pack: 10 chart and visualization templates for Excel and Google Sheets
Browse all Excel charts and visualizations or the Excel HR and payroll templates.







Reviews
There are no reviews yet.