


The Architecture KPI Dashboard in Excel is a powerful and interactive tool designed for architects, project managers, and architecture firms to track, analyze, and optimize the performance of architectural projects. This customizable dashboard helps you monitor key performance indicators (KPIs) such as project progress, budget management, client satisfaction, design timelines, and resource allocation, allowing you to ensure that your projects are completed efficiently and within budget.
Whether you’re working on residential, commercial, or mixed-use projects, this Excel-based dashboard provides a comprehensive overview of your architecture business, enabling you to track performance, optimize resource utilization, and enhance project delivery. The Architecture KPI Dashboard in Excel is the perfect solution for architects looking to streamline their project management processes and achieve successful project outcomes.
Key Features of the Architecture KPI Dashboard in Excel
🏗️ Comprehensive Project Tracking
Track essential KPIs related to architectural projects, including design phases, project timelines, resource utilization, and budget adherence. Keep a clear overview of project progress and performance.
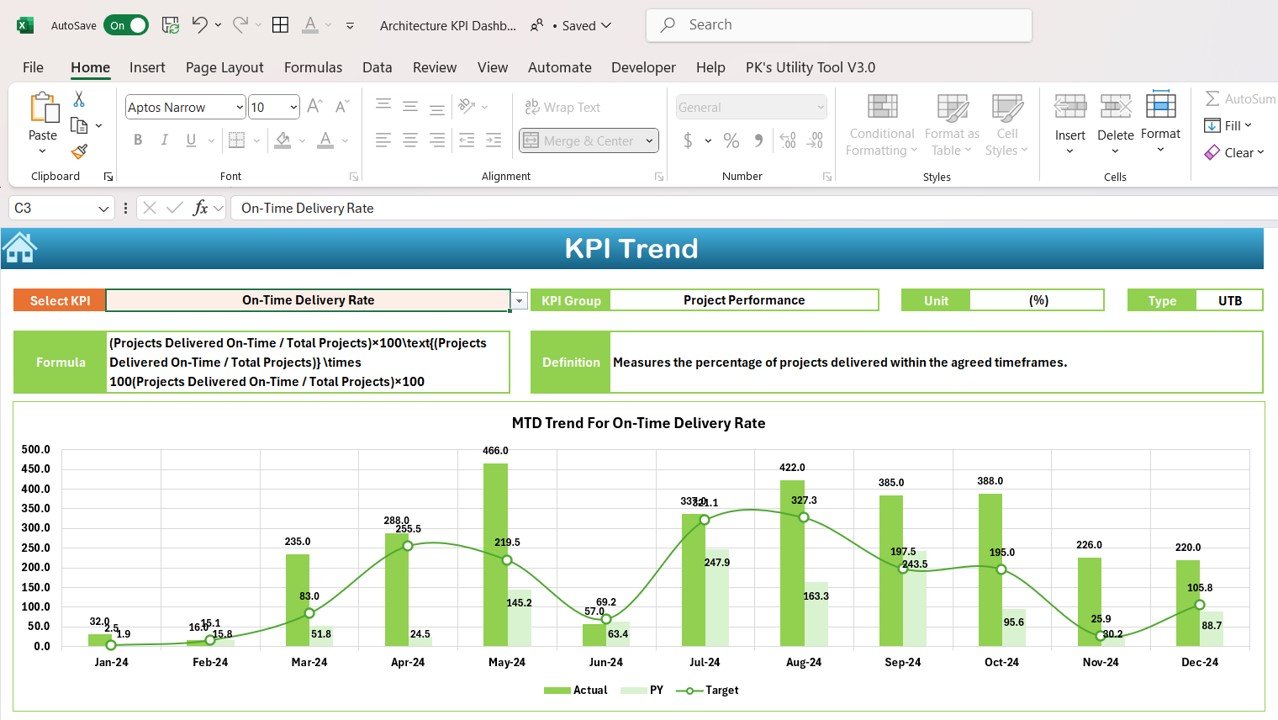
⚡ Real-Time Progress Monitoring
Monitor project milestones, design phases, and project completion percentages in real-time. Stay on top of deadlines and ensure that projects are progressing as planned.
📈 Client Satisfaction & Feedback Insights
Analyze client feedback and satisfaction levels for each project. Ensure that designs meet client expectations and enhance relationships for repeat business.
📅 Customizable KPIs for Architecture Projects
Adjust the dashboard to track KPIs specific to your architectural projects, such as design cost, material costs, client approvals, and project timelines.
🖥️ Interactive & User-Friendly Interface
The dashboard is designed to be easy to navigate, offering interactive charts, filters, and slicers that allow you to drill down into specific data points, helping you track and analyze project performance efficiently.
Why You’ll Love the Architecture KPI Dashboard in Excel

✅ Track Project Design & Construction Phases
Monitor the progress of your projects, from the design phase to construction completion. Ensure that your projects stay on track and within budget.
✅ Optimize Resource Utilization
Track resource allocation, including labor, materials, and equipment usage, to ensure that resources are being used efficiently across all projects.
✅ Manage Project Budgets & Costs
Monitor project budgets, material costs, and expenditures to ensure that your projects remain cost-effective and within financial constraints.
✅ Enhance Client Relationships
Track client feedback and satisfaction to ensure that the final design meets expectations, fostering strong relationships and repeat business.
✅ Make Data-Driven Project Decisions
Leverage insights from the dashboard to make informed decisions about project adjustments, resource allocation, and budgeting to improve overall project performance.
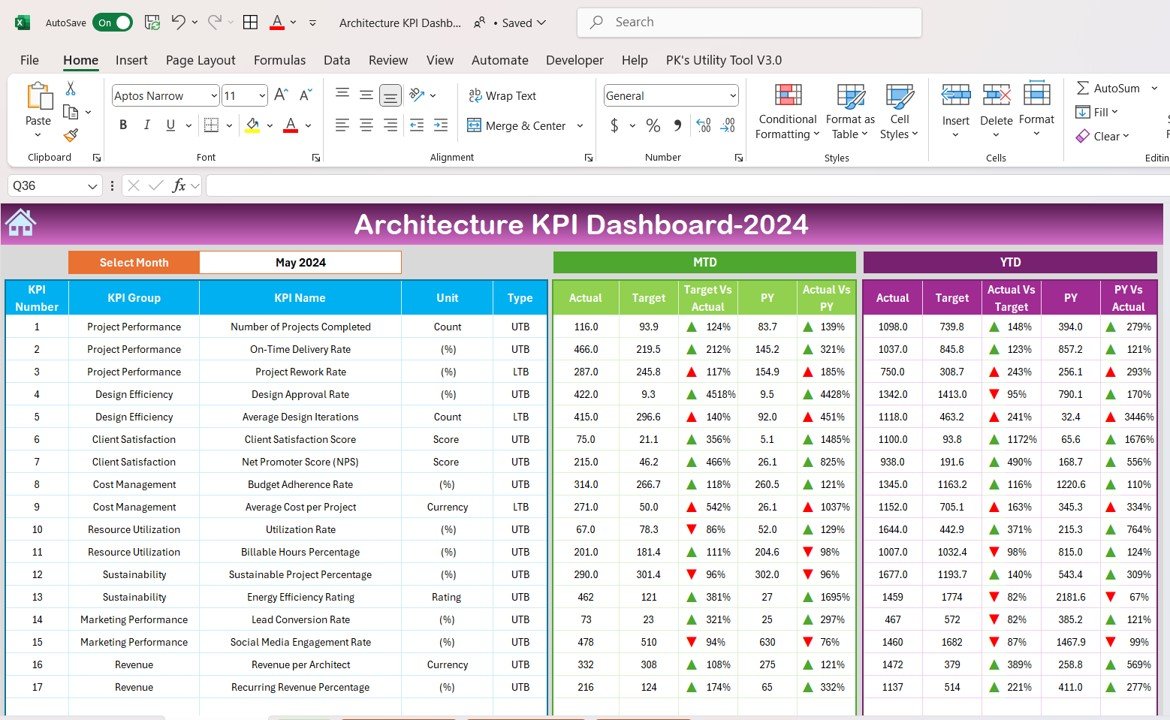
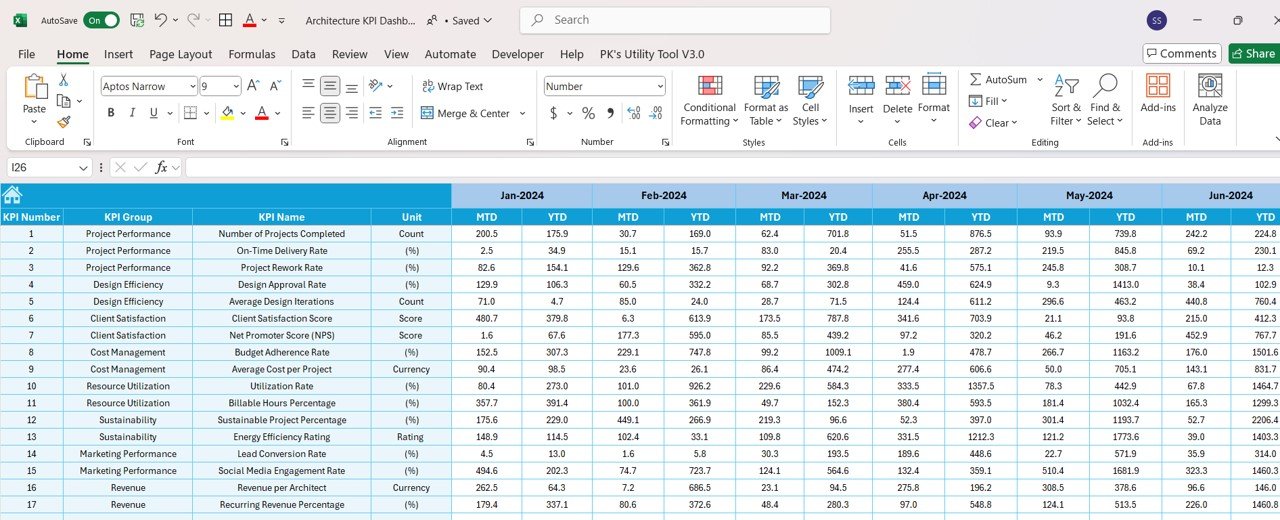
What’s Inside the Architecture KPI Dashboard Template?
- Project Progress Tracking: Monitor project timelines, milestones, and design phases to ensure that projects are progressing as scheduled.
- Budget & Cost Management: Track project budgets, material costs, and labor expenses to ensure projects stay within budget.
- Client Feedback & Satisfaction: Analyze client satisfaction levels and feedback to improve service delivery and project outcomes.
- Resource Allocation Monitoring: Track labor, materials, and equipment usage to optimize resource allocation and reduce waste.
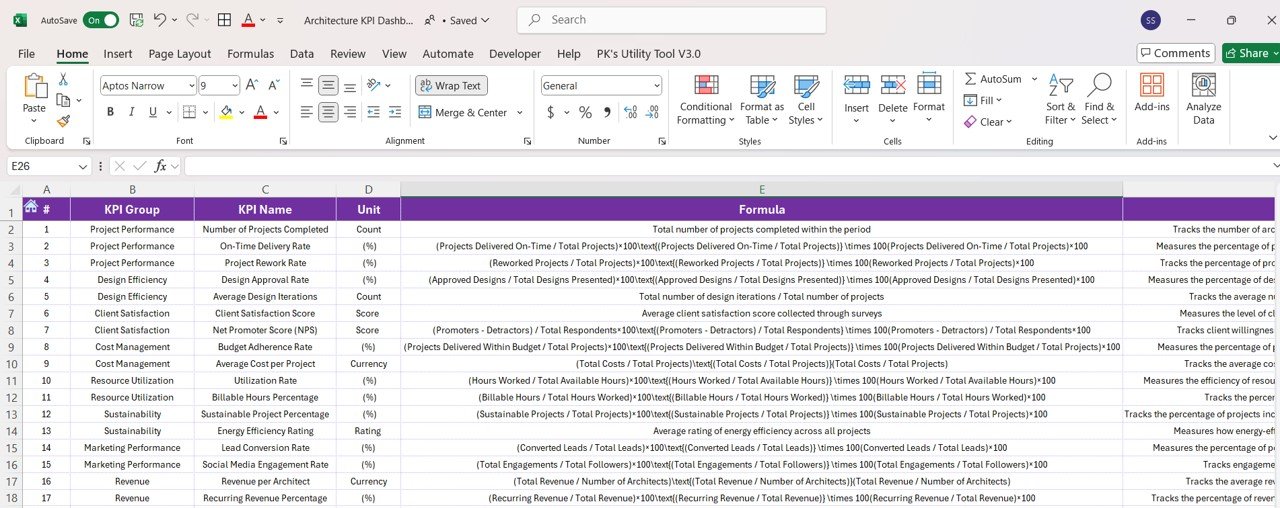
- Customizable KPIs: Adjust the dashboard to fit your specific project and business needs, such as client approval rates or design complexity.
- Interactive Reporting: Use dynamic charts and filters to track data and make informed decisions about project performance and resources.
How to Use the Architecture KPI Dashboard in Excel
1️⃣ Download the Template: Instantly access your Architecture KPI Dashboard in Excel.
2️⃣ Input Project Data: Enter data such as project milestones, design phases, budgets, and client feedback.
3️⃣ Track & Monitor KPIs: Use the dashboard to monitor real-time progress, budgets, and resource utilization across multiple projects.
4️⃣ Analyze & Optimize: Use insights from the dashboard to optimize resource allocation, reduce costs, and improve project delivery.
Who Can Benefit from the Architecture KPI Dashboard in Excel?
🔹 Architects & Architectural Firms
🔹 Project Managers & Construction Teams
🔹 Business Owners in the Architecture & Design Industry
🔹 Contractors & Builders
🔹 Interior Designers & Landscape Architects
🔹 Anyone Managing Architectural Projects & Resources
Track, analyze, and optimize your architecture projects with the Architecture KPI Dashboard in Excel. Monitor key performance metrics, improve resource allocation, and ensure project success from start to finish.
Click here to read the Detailed blog post
Visit our YouTube channel to learn step-by-step video tutorials
Youtube.com/@PKAnExcelExpert


Reviews
There are no reviews yet.