
Key Features of Cardiology Institutes Dashboard
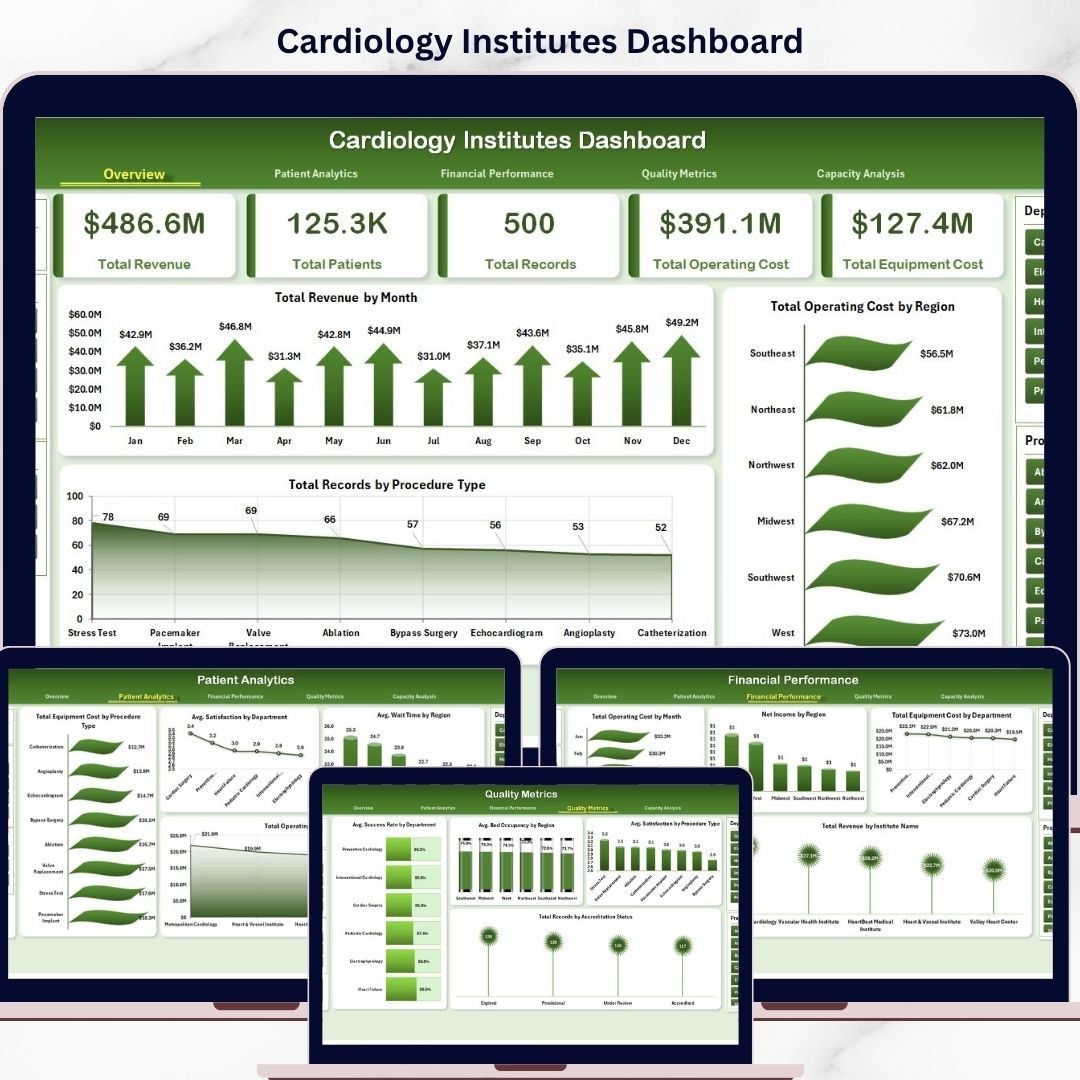
Introducing the Cardiology Institutes Dashboard-a powerful, ready-to-use digital Excel dashboard designed specifically for cardiology centers, hospitals, and healthcare administrators who want to visualize and analyze their operational and financial data effortlessly. With a simple data update and refresh mechanism, this dashboard transforms complex data into actionable insights in seconds.
This dashboard contains multiple interactive pages, each equipped with dynamic slicers and visually engaging charts, making it easier than ever to monitor key performance indicators and make informed decisions.
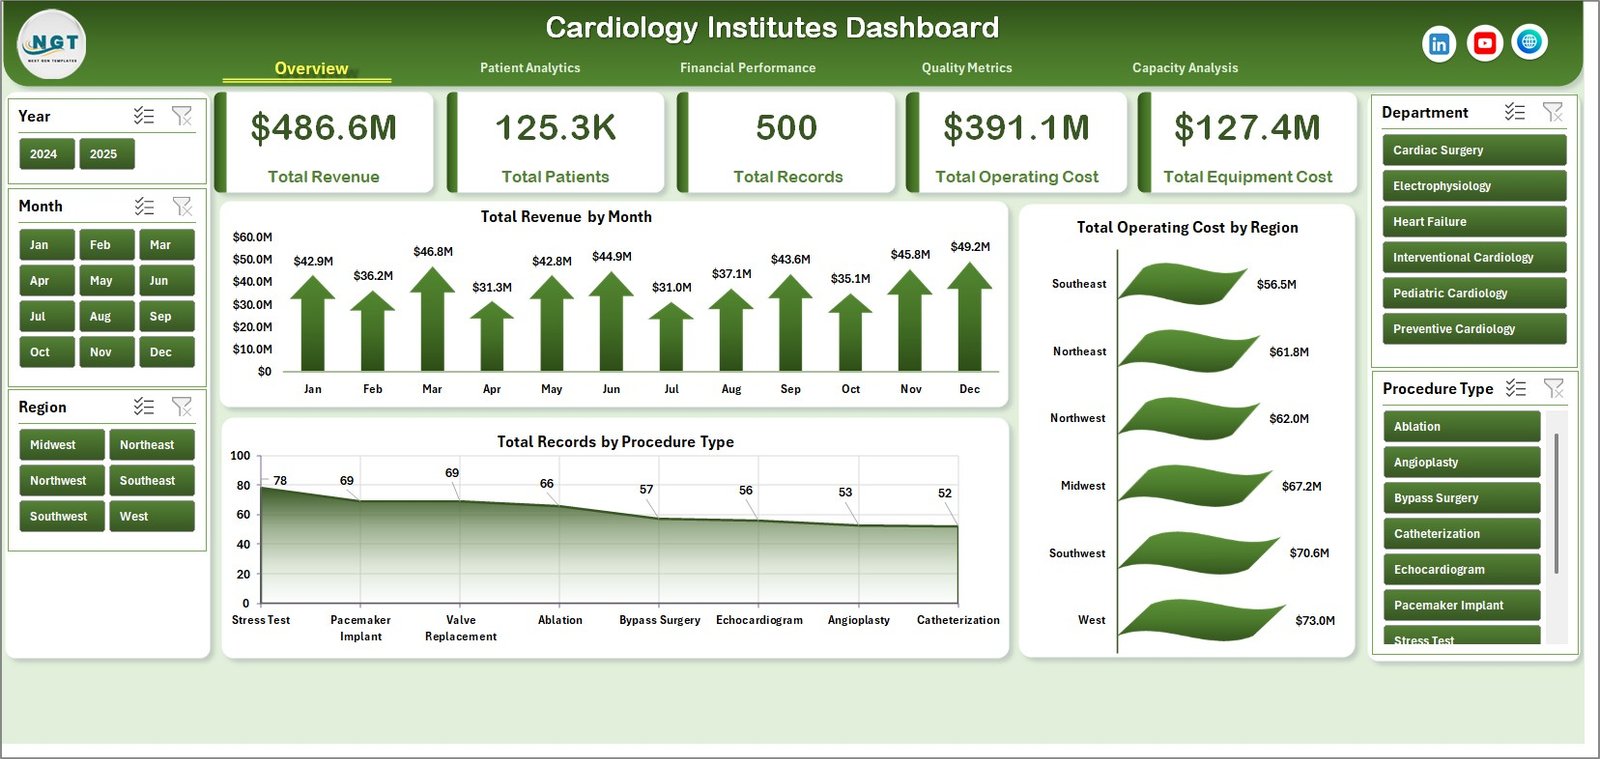
- 🩺 Overview Page: High-level cards display Total Revenue, Total Patients, Total Records, Total Operating Cost, and Total Equipment Cost. Visual charts such as Total Revenue by Month, Total Operating Cost by Region, and Total Records by Procedure Type offer quick insights into major trends.
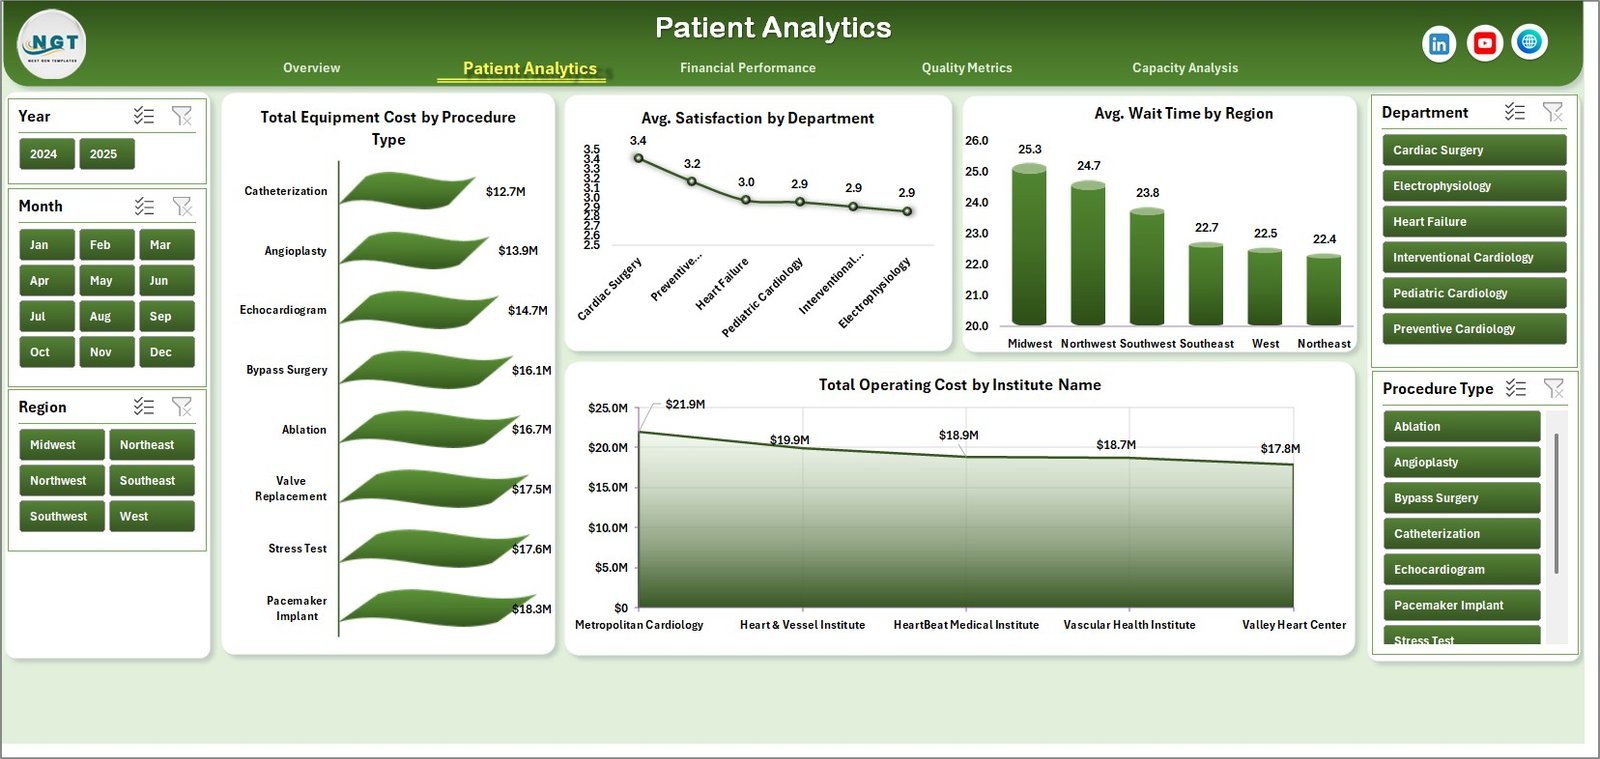
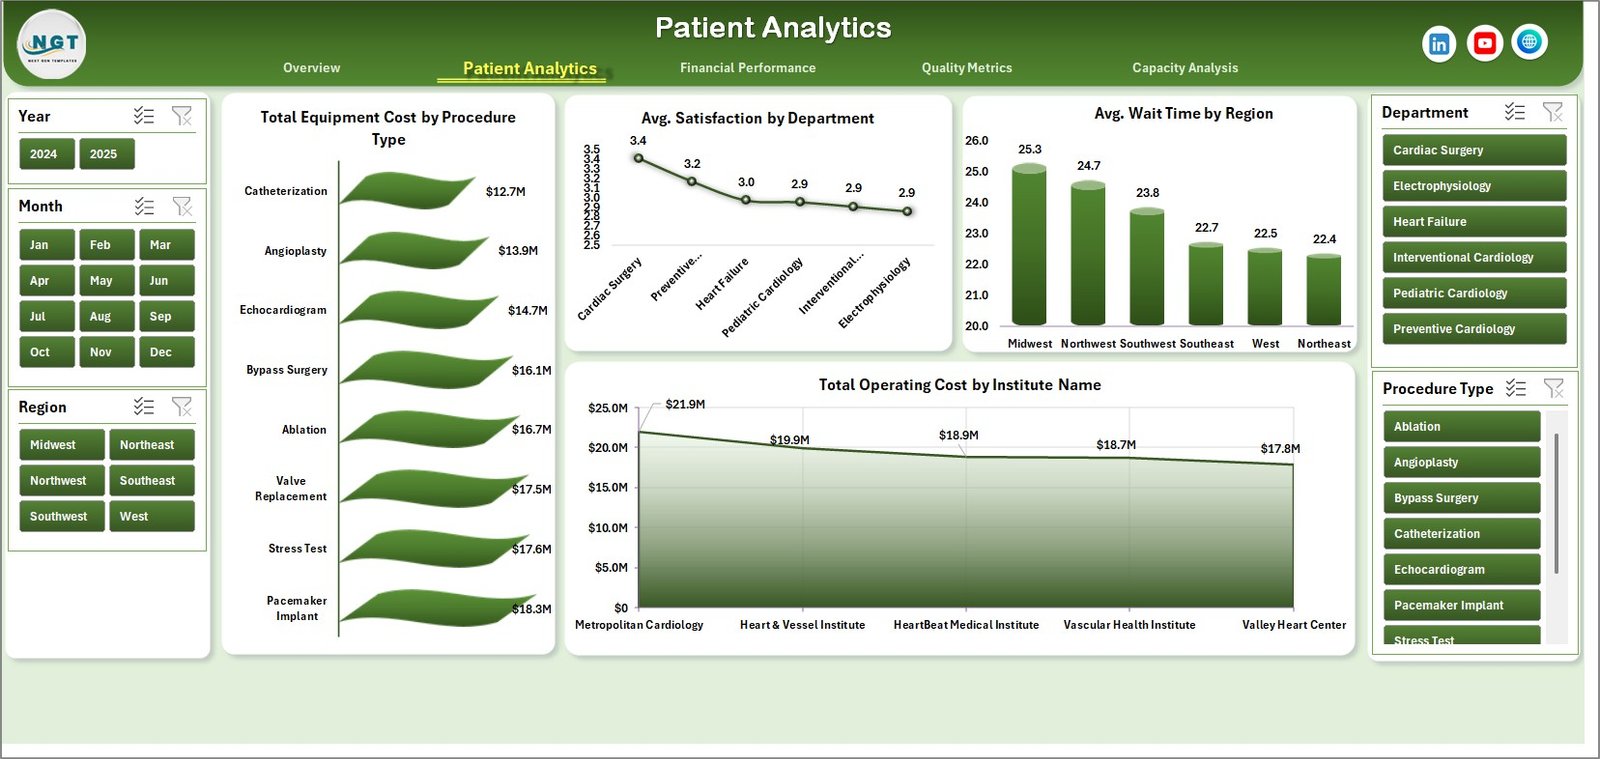
- 📊 Patient Analytics: Dive deep into metrics like Total Equipment Cost by Procedure Type, Average Satisfaction by Department, Average Wait Time by Region, and Total Operating Cost by Institute Name for comprehensive patient-related data analysis.
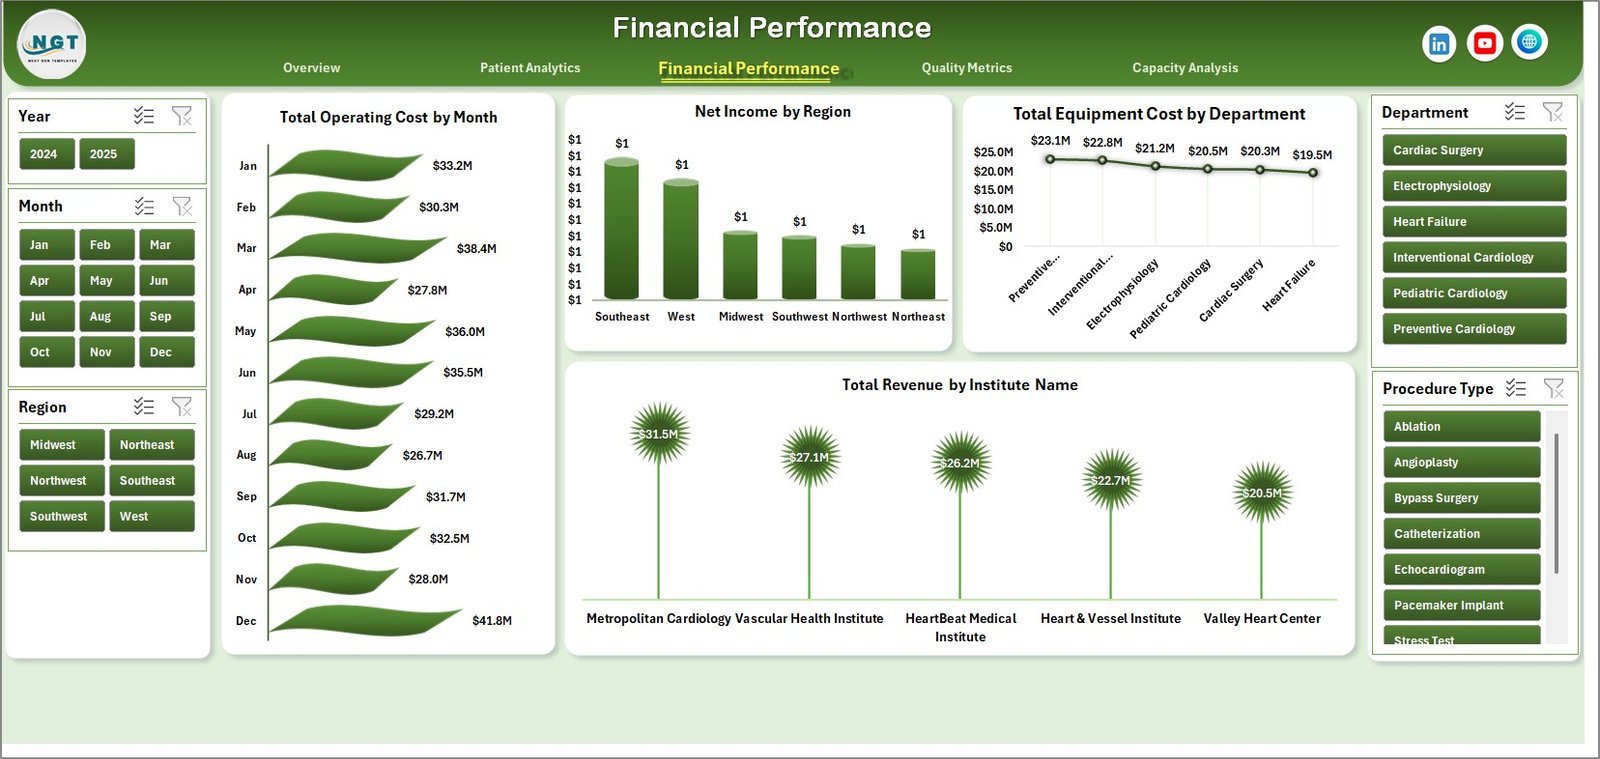
- 💰 Financial Performance: Track Total Operating Cost by Month, Net Income by Region, Total Equipment Cost by Department, and Total Revenue by Institute Name to maintain financial health and spot growth opportunities.
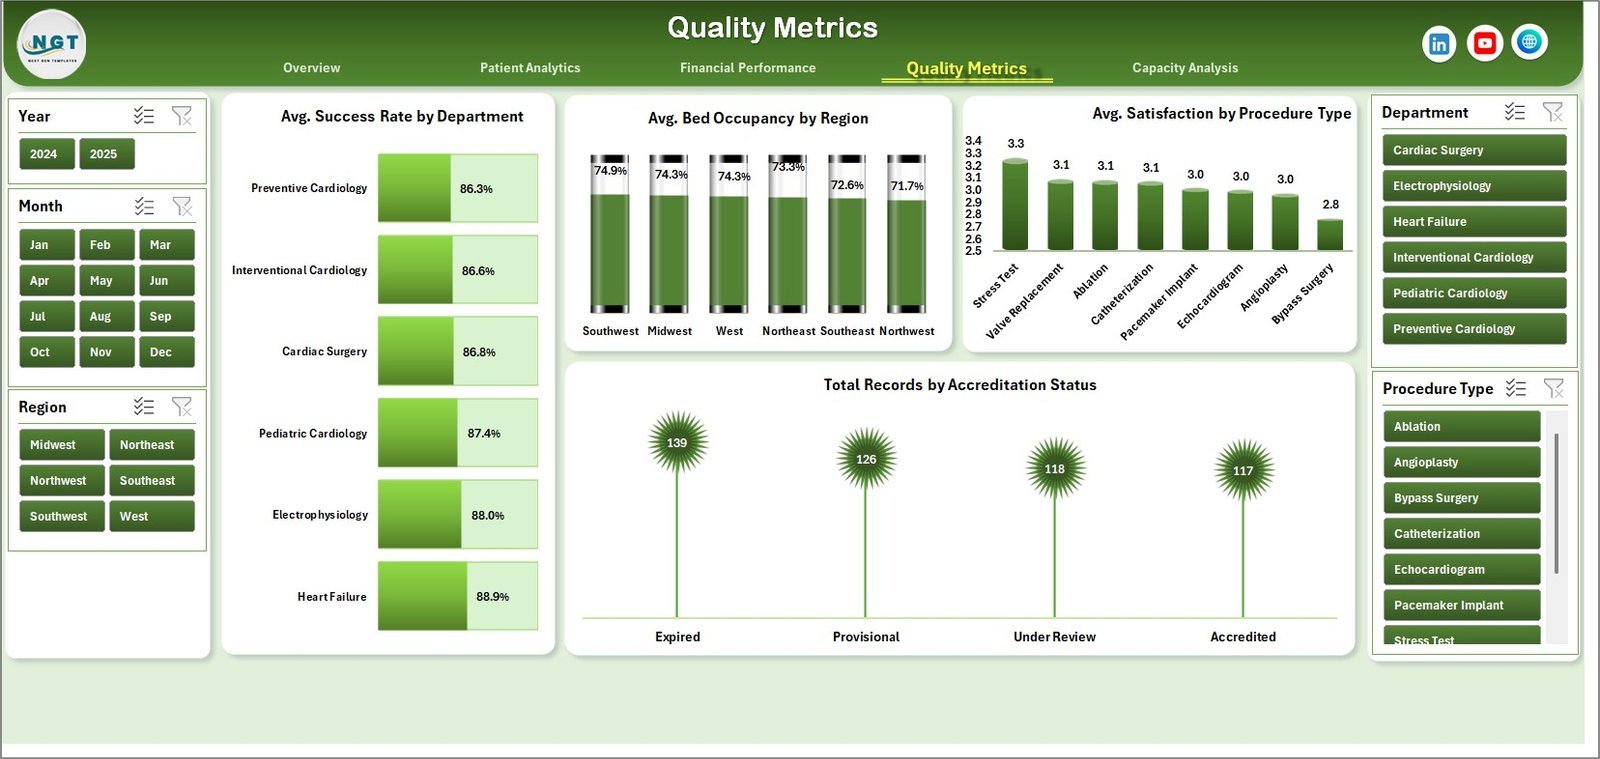
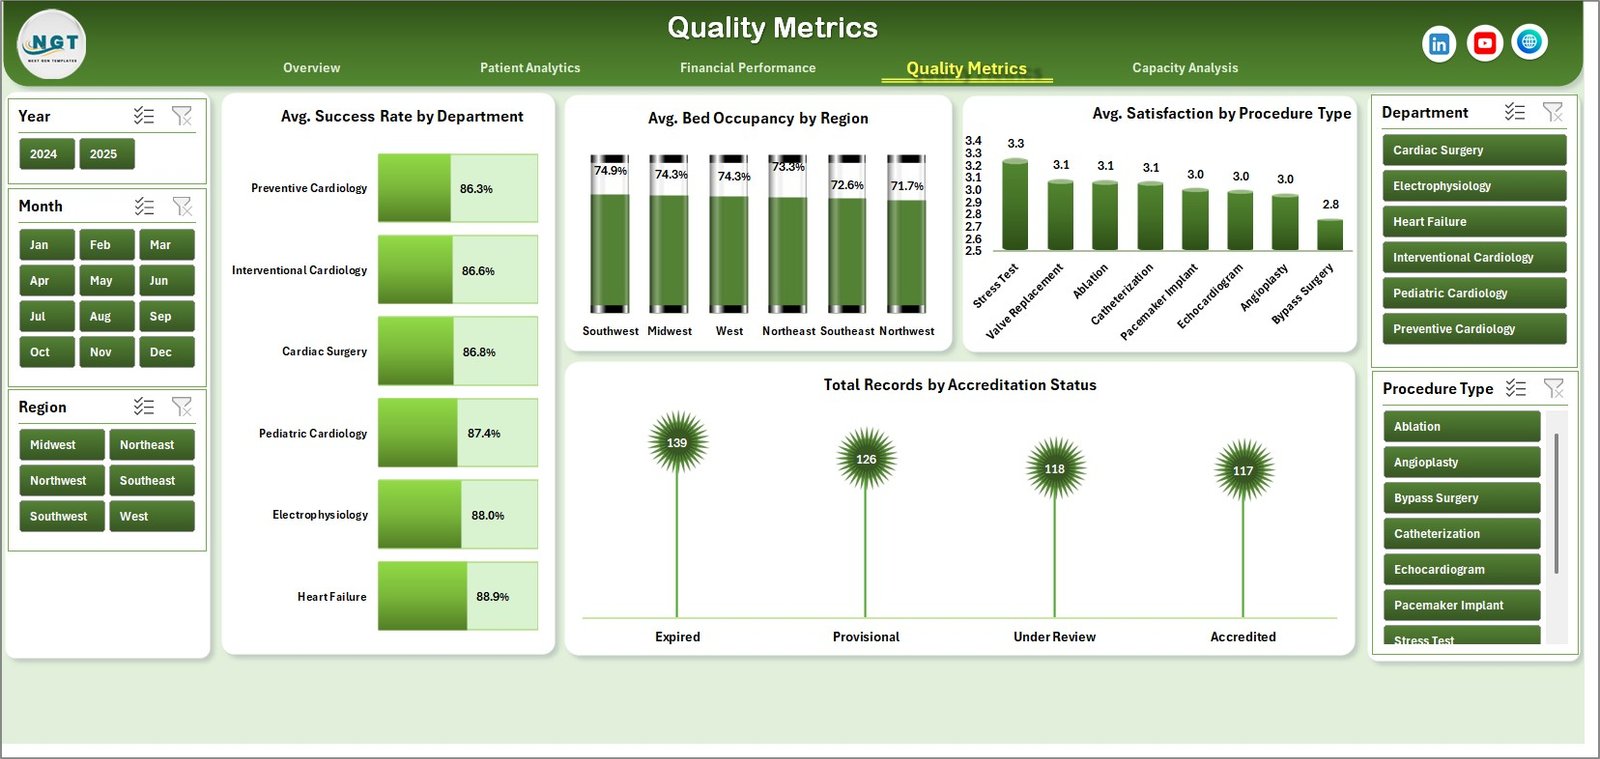
- ✅ Quality Metrics: Monitor Average Success Rate by Department, Bed Occupancy by Region, Satisfaction by Procedure Type, and Records by Accreditation Status to ensure high-quality patient care.
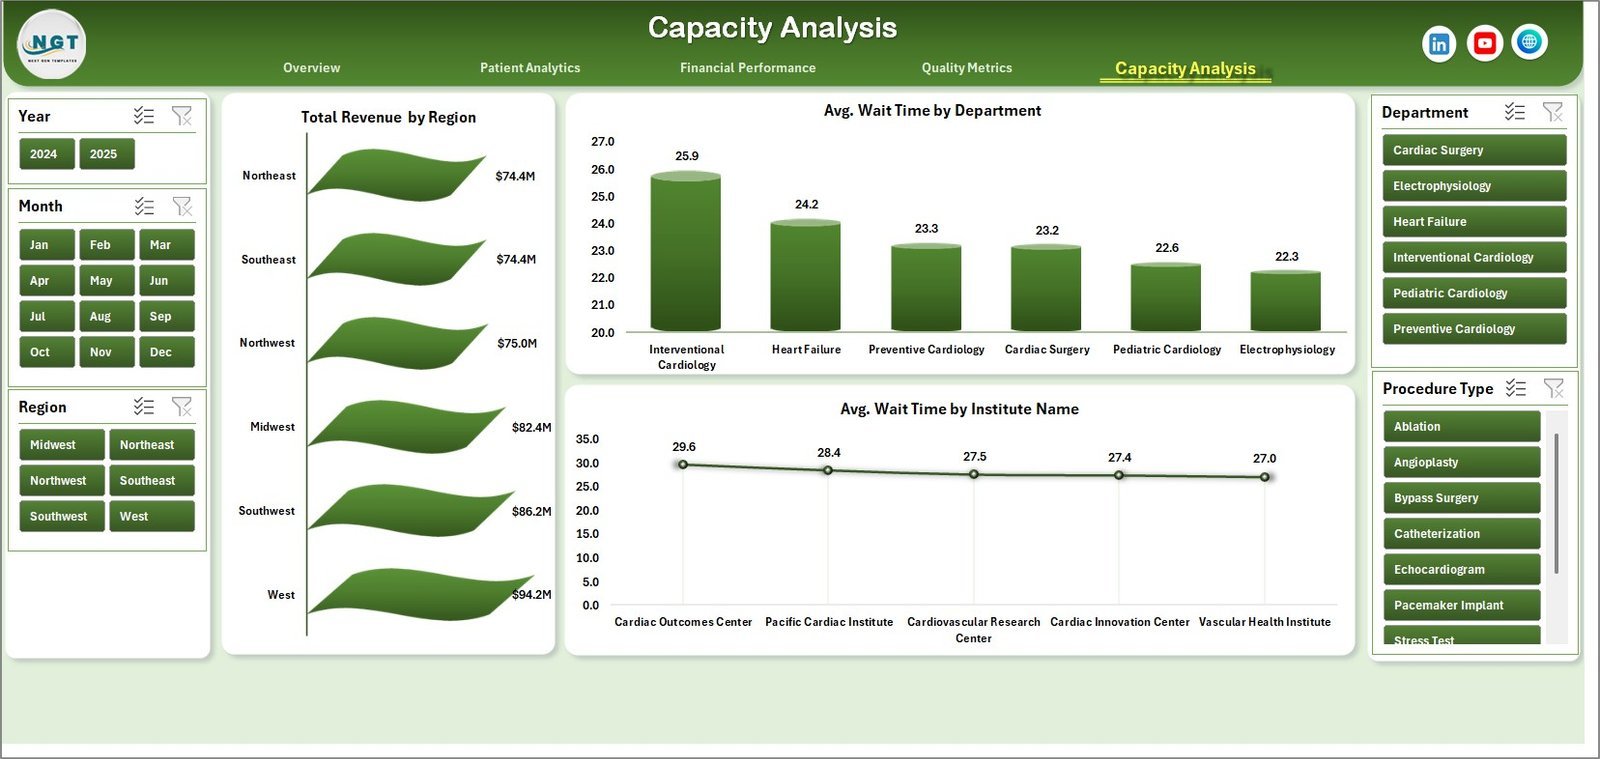
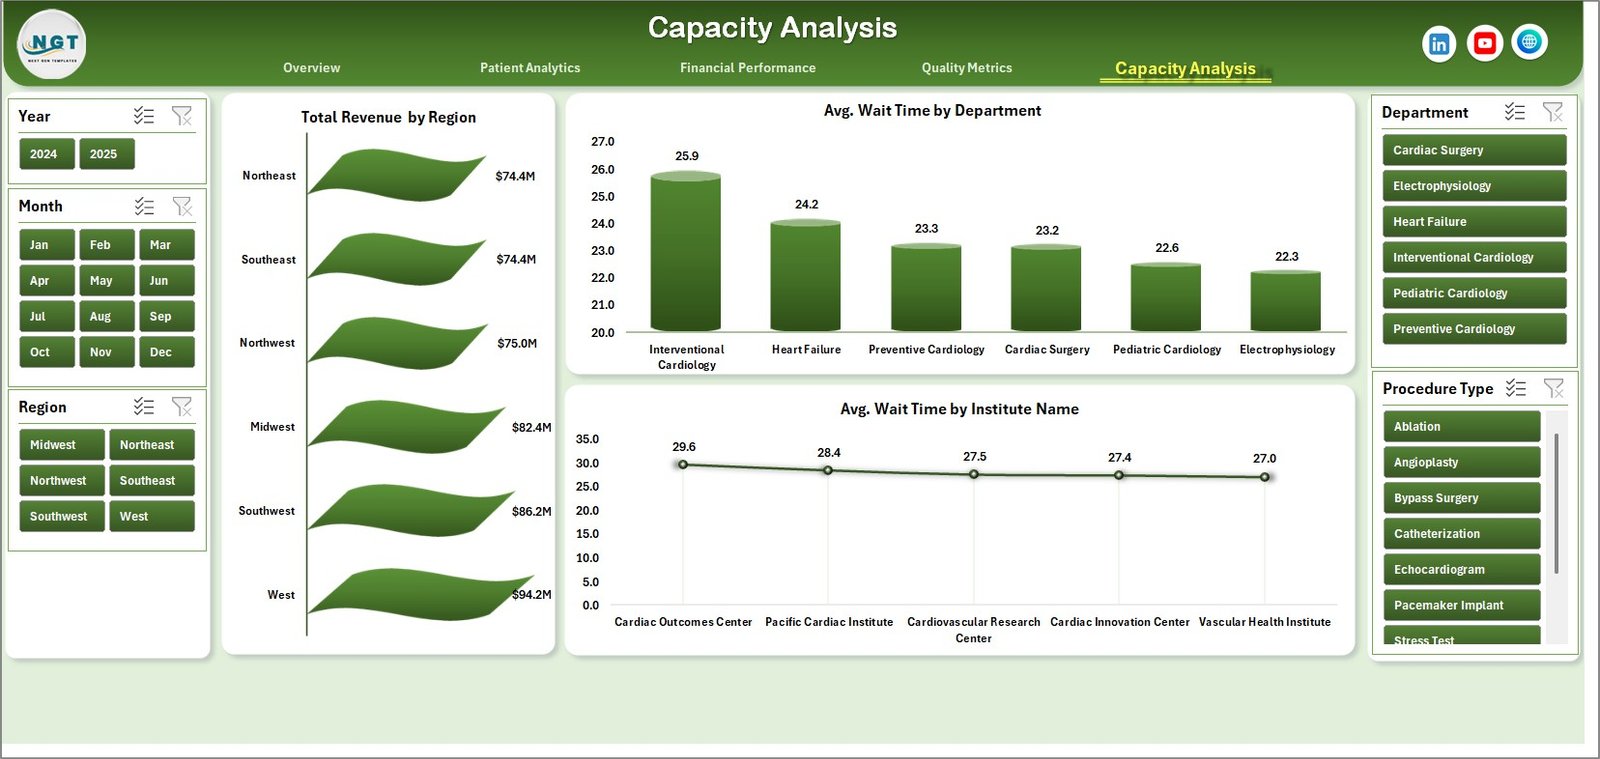
- 🏥 Capacity Analysis: Analyze Total Revenue by Region, Average Wait Times by Department and Institute to optimize resource allocation and improve patient flow.
- 📁 Data Sheet Tab: Update your data easily in the provided format for seamless dashboard refreshment.
- 🔧 Support Sheet: Contains pivot tables powering the dashboard; refresh all pivots quickly from the Excel Ribbon’s Data tab after data updates.
What’s Inside the Cardiology Institutes Dashboard
The dashboard includes six main sheets, each focusing on critical aspects of cardiology institute operations:
- Overview Page with top-level KPIs and slicers for fast filtering.
- Patient Analytics presenting detailed patient-centric metrics.
- Financial Performance offering insights into revenue and costs.
- Quality Metrics to measure care standards and accreditation.
- Capacity Analysis for operational efficiency and wait-time optimization.
- Data Sheet and Support Sheet for easy data management and dynamic pivot refresh.
Each page is built with clarity and usability in mind, featuring interactive charts and slicers for an intuitive user experience.
How to Use the Cardiology Institutes Dashboard
Getting started with the Cardiology Institutes Dashboard is straightforward and requires no advanced technical skills:
- 📝 Step 1: Enter or update your raw data in the Data Sheet tab, following the provided format exactly.
- 🔄 Step 2: Navigate to the Data tab on the Excel Ribbon and click on Refresh All to update all pivot tables and charts automatically.
- 📊 Step 3: Explore various sheets using slicers to filter data by region, department, procedure type, and other parameters.
- 👁️ Step 4: Analyze the visually rich charts and cards to gain insights into revenue, patient satisfaction, operational costs, and quality metrics.
- 🔒 Step 5: The Support Sheet is hidden by default but contains all underlying pivot tables for advanced users wishing to customize further.
With these simple steps, users can maintain an up-to-date, interactive cardiology dashboard that drives data-driven decision-making.
Who Can Benefit from This Cardiology Institutes Dashboard
This dashboard is designed for a broad audience within the cardiology and healthcare sector. It is perfect for:
- 🏥 Hospital Administrators aiming to monitor financial and operational performance in real-time.
- 👨⚕️ Cardiology Department Heads seeking to track patient metrics and procedural outcomes efficiently.
- 📈 Healthcare Analysts who need a powerful yet easy-to-use tool for data visualization and reporting.
- 💼 Financial Officers focused on budgeting, cost control, and revenue optimization within cardiology institutes.
- 🎯 Quality Assurance Teams dedicated to maintaining accreditation standards and patient satisfaction.
- 🖥️ Data Managers responsible for updating and maintaining accurate datasets without complex software.
Whether you manage a single cardiology center or a network of institutes, this dashboard streamlines your data analysis and reporting needs.
Cardiology Institutes Dashboard
Patient Analytics

Financial Performance
Quality Metrics
Capacity Analysis
Data Sheet tab
Support sheet tab
Click here to read the Detailed blog post.
Visit our YouTube channel to learn step-by-step video tutorials.


Reviews
There are no reviews yet.