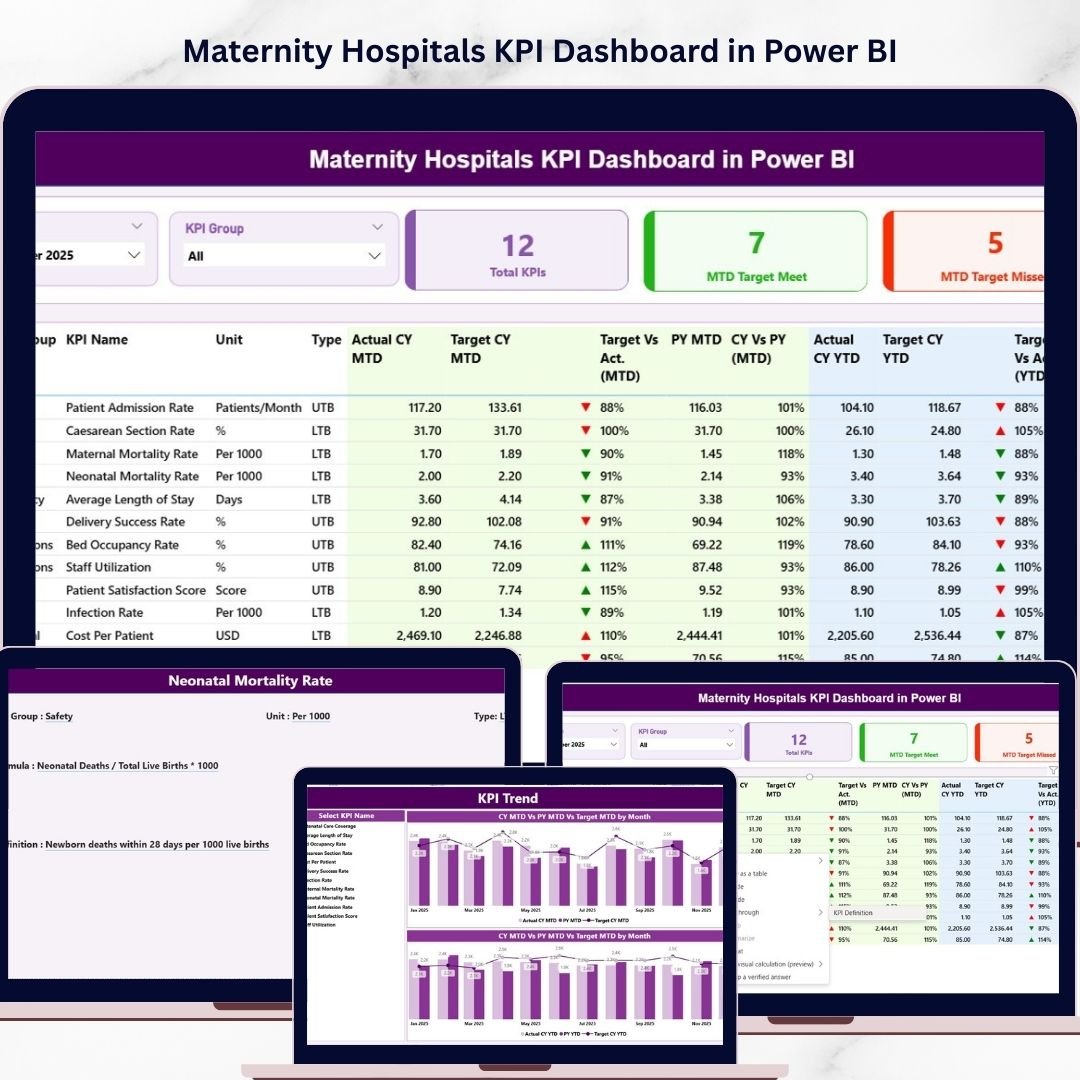
Managing maternity healthcare performance requires accuracy, visibility, and data-driven decisions. Hospitals must monitor critical metrics such as delivery outcomes, patient satisfaction, maternal complications, and hospital efficiency. However, tracking these metrics through scattered spreadsheets and manual reports can be time-consuming and inefficient.Maternity Hospitals KPI Dashboard in Power BI
The Maternity Hospitals KPI Dashboard in Excel is designed to solve this challenge. It is a powerful, ready-to-use Excel dashboard that helps maternity hospitals track healthcare KPIs, analyze trends, and improve decision-making. With automated calculations, interactive charts, and organized KPI tracking, hospital administrators can quickly evaluate performance and identify areas that require attention.Maternity Hospitals KPI Dashboard in Power BI
Because the dashboard is built in Excel, it is easy to implement, customize, and maintain. Hospitals can simply enter their data and instantly generate performance insights that help improve maternal healthcare outcomes.
Key Feature of Maternity Hospitals KPI Dashboard in Excel
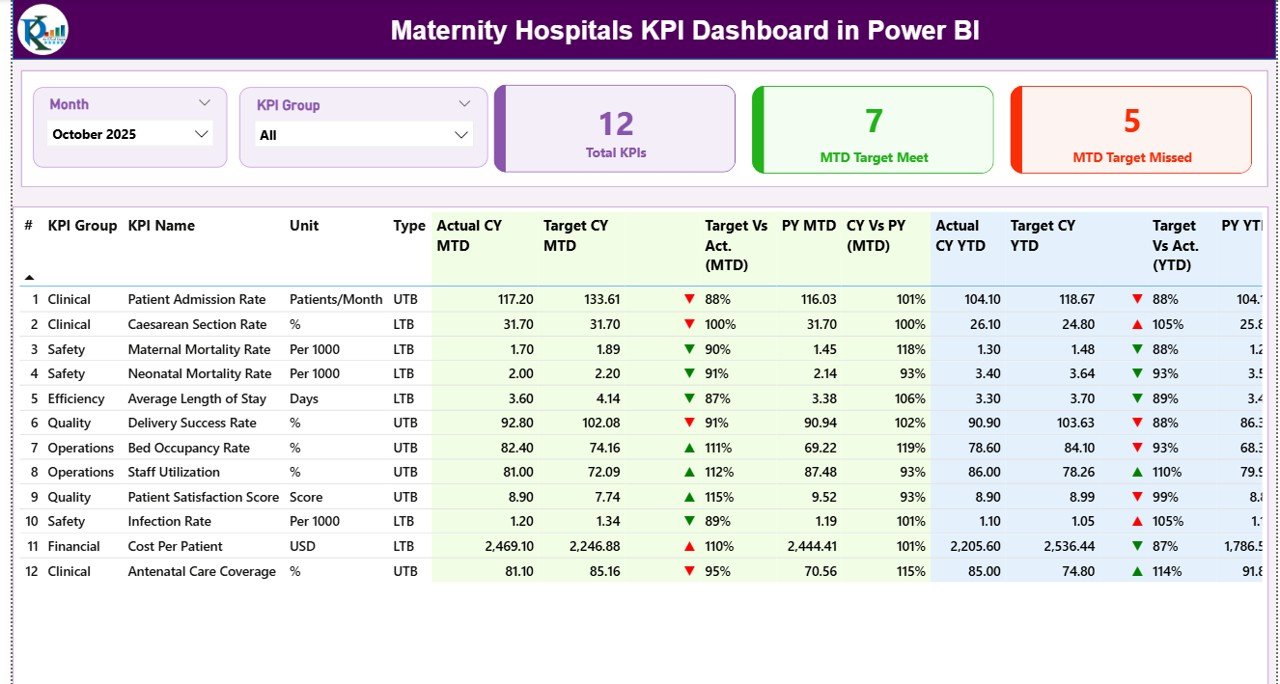
📊 Interactive KPI Dashboard – Monitor important maternity healthcare KPIs through visually organized charts, KPI cards, and performance indicators.
📅 Monthly Performance Monitoring – Select any month from the dropdown menu to instantly update the entire dashboard with new performance insights.
📈 MTD and YTD Performance Analysis – Track Month-to-Date and Year-to-Date KPI performance to understand both short-term and long-term trends.
📉 Target vs Actual Comparison – Evaluate hospital performance by comparing actual results with defined targets and previous year data.
📊 Automated Trend Analysis – Identify performance trends through dynamic charts that compare targets, actual values, and historical performance.
🧭 Centralized Summary Page – Quickly navigate through dashboard sections using interactive buttons that connect to each worksheet.
⚡ Conditional Formatting Indicators – Instantly identify KPI performance improvements or declines through visual arrows and indicators.
🔄 Automatic Dashboard Updates – Once data is entered, the dashboard refreshes automatically to reflect the latest performance metrics.
📁 Organized Multi-Sheet Structure – The template includes multiple structured worksheets that manage KPI definitions, targets, actual data, and historical comparisons.
What’s Inside the Maternity Hospitals KPI Dashboard in Excel
This ready-to-use template includes 7 structured Excel worksheets that simplify maternity hospital KPI management.
📑 Summary Sheet
Acts as the navigation hub of the dashboard with interactive buttons that allow users to move between different sections instantly.
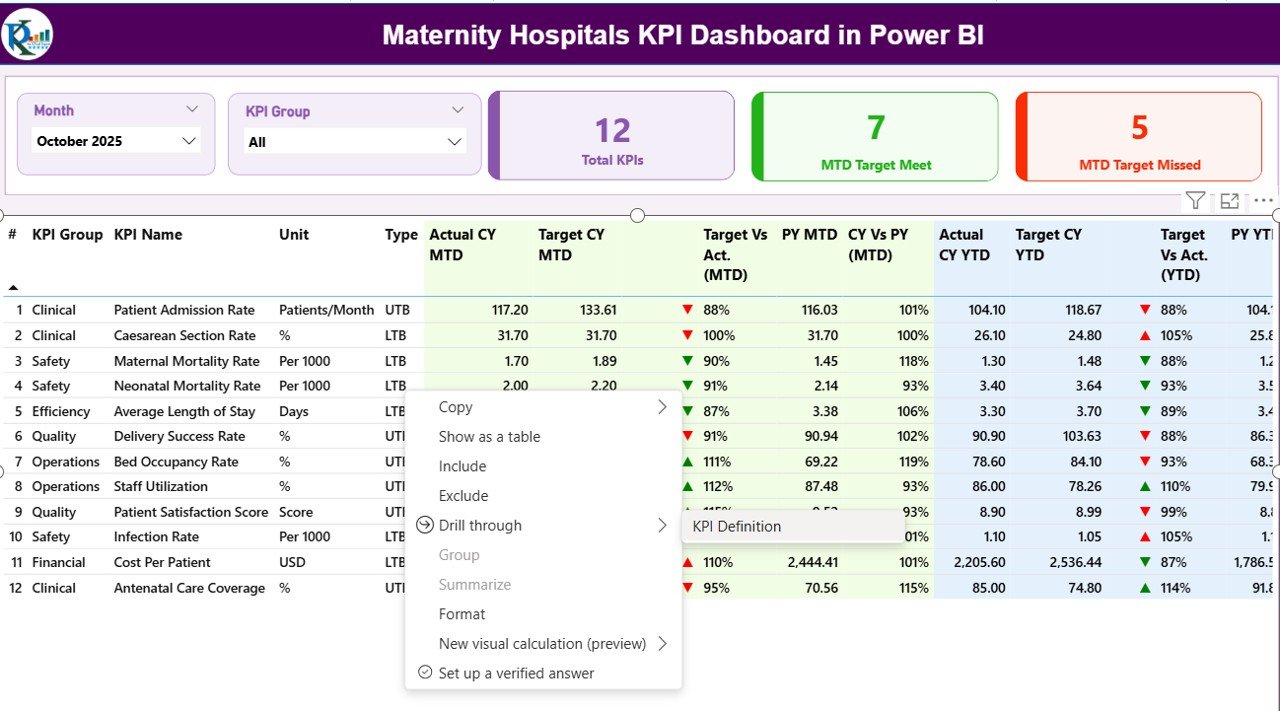
📊 Dashboard Sheet
Displays all maternity hospital KPIs with visual charts and KPI cards. Users can change the selected month to automatically update all performance metrics.
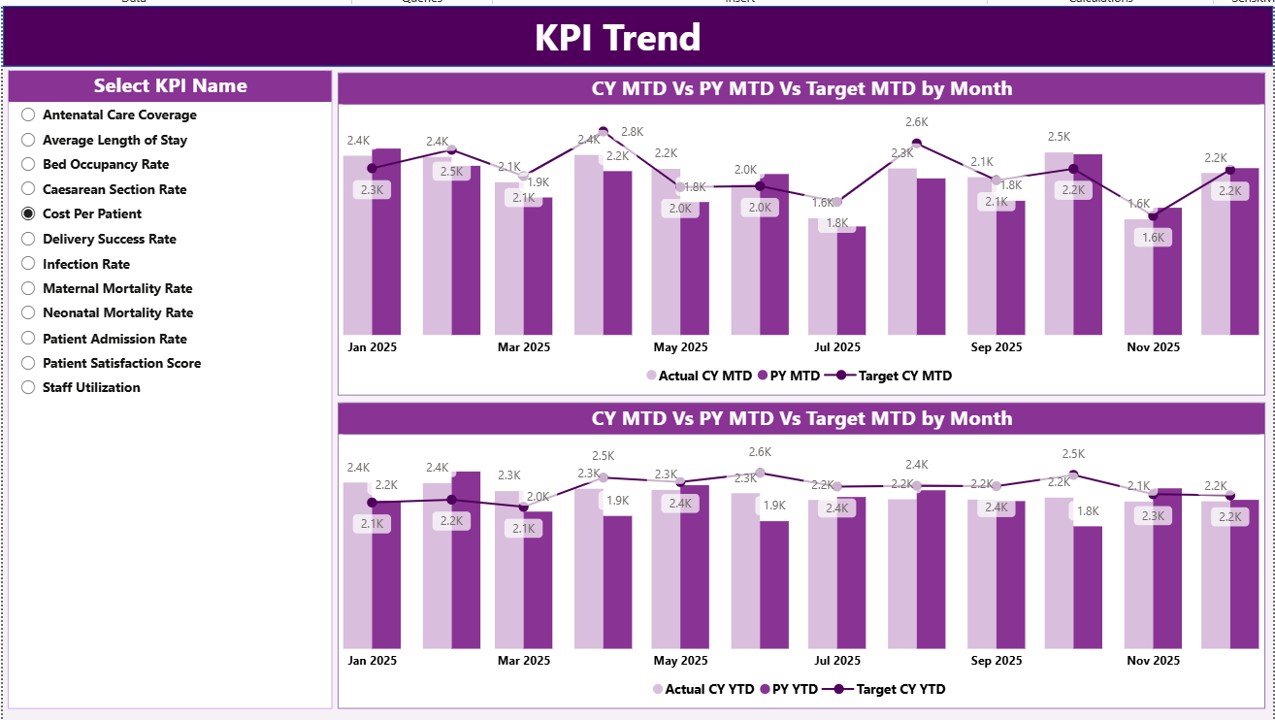
📈 Trend Analysis Sheet
Provides detailed trend analysis for selected KPIs including performance charts, KPI definitions, units, and formulas.
📝 Actual Data Input Sheet
Allows users to enter monthly KPI values for maternity hospital operations. All dashboard calculations update automatically based on this data.
🎯 Target Sheet
Stores monthly and yearly KPI targets that help hospitals evaluate whether performance goals are achieved.
📅 Previous Year Data Sheet
Maintains historical KPI values so hospitals can compare current performance with previous year results.
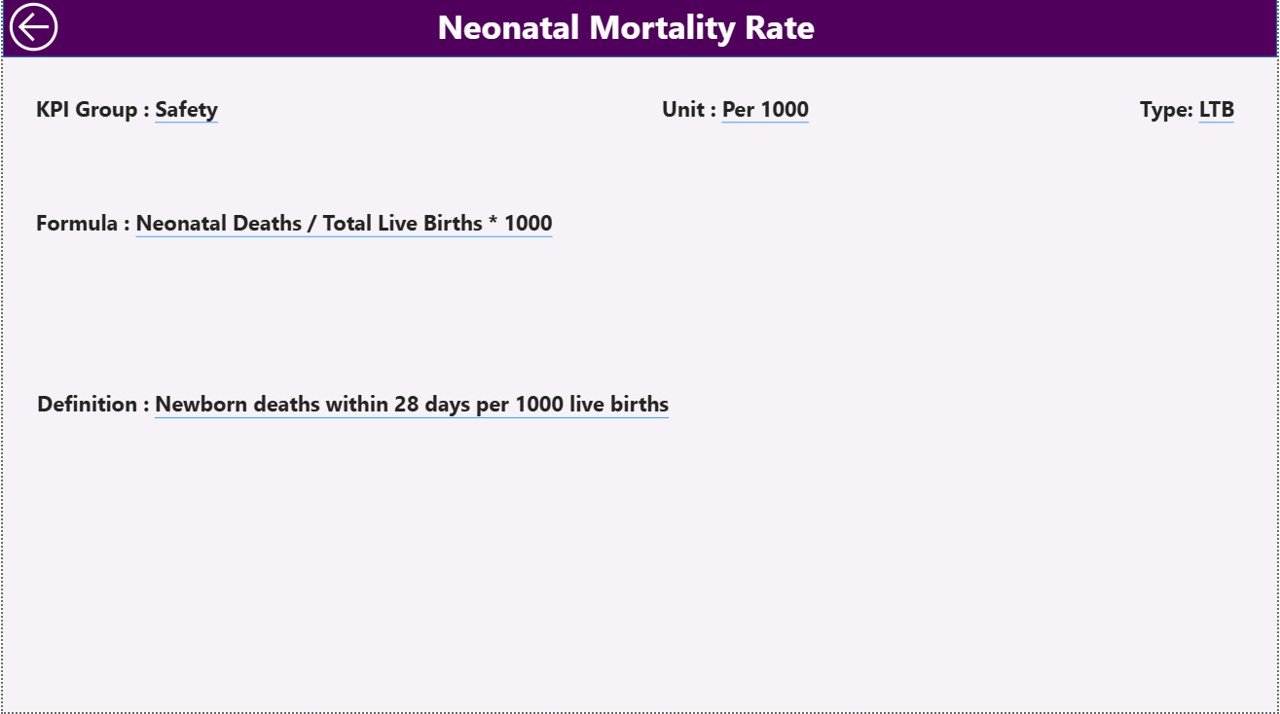
📘 KPI Definition Sheet
Stores detailed KPI information including KPI names, formulas, units, groups, and definitions for better understanding.
How to Use the Maternity Hospitals KPI Dashboard in Excel
Using the dashboard is simple and requires no advanced Excel expertise.
1️⃣ Define KPIs
Enter KPI details such as name, formula, and unit in the KPI Definition Sheet.
2️⃣ Enter Performance Targets
Input monthly or yearly KPI targets in the Target Sheet.
3️⃣ Update Actual Performance Data
Enter monthly hospital KPI data in the Actual Numbers Input Sheet.
4️⃣ Add Previous Year Data
Input historical KPI values to enable year-over-year performance comparison.
5️⃣ Analyze the Dashboard
Open the Dashboard Sheet and select a month to instantly view updated performance insights.
This workflow allows hospital administrators to analyze operational performance quickly and efficiently.
Who Can Benefit from This Maternity Hospitals KPI Dashboard in Excel
🏥 Hospital Administrators – Monitor maternity hospital performance and improve operational efficiency.
👩⚕️ Medical Directors – Evaluate clinical outcomes and maternal healthcare performance indicators.
📊 Healthcare Data Analysts – Analyze hospital data trends and generate performance insights.
📋 Quality Control Teams – Track patient safety metrics and quality improvement initiatives.
🏛 Government Health Departments – Monitor maternity healthcare performance across hospitals and healthcare facilities.
🏥 Private Clinics and Hospitals – Track patient care metrics and hospital operational performance.
Because the dashboard is built in Excel, it is suitable for both small clinics and large healthcare institutions.
Click here to read the Detailed blog post
Watch the step-by-step video tutorial:


