Cities across the world are evolving into smart, connected, and sustainable ecosystems. Governments and urban planners manage numerous initiatives such as smart transportation systems, renewable energy projects, digital governance platforms, IoT infrastructure, and environmental sustainability programs. However, monitoring dozens or even hundreds of projects simultaneously can quickly become overwhelming without the right tools.
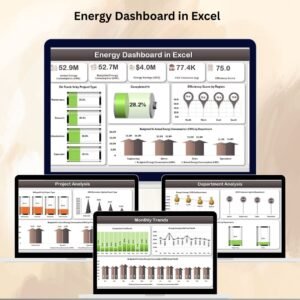
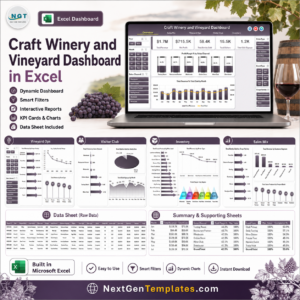
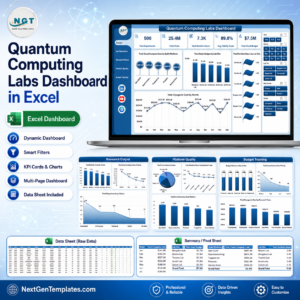
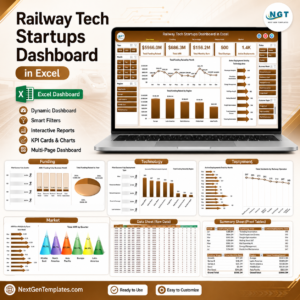
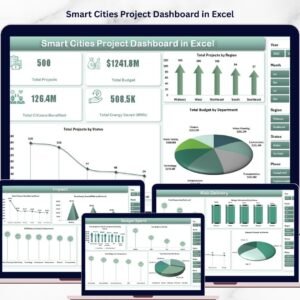
The Smart Cities Project Dashboard in Excel is a powerful and ready-to-use analytics template designed to help city administrators, project managers, and planning teams track smart city initiatives efficiently. This interactive Excel dashboard consolidates complex project data into a single visual platform, allowing decision-makers to monitor project progress, budgets, environmental impact, and citizen benefits.
Instead of relying on scattered spreadsheets and manual reports, this dashboard transforms raw project data into meaningful insights through dynamic charts, KPI cards, and analytical views. With this structured monitoring system, city leaders can quickly evaluate project performance, identify risks, track sustainability outcomes, and make better strategic decisions.
Because Excel provides flexible data analysis and visualization capabilities, organizations can easily update project data while the dashboard automatically refreshes charts and insights. As a result, the Smart Cities Project Dashboard in Excel becomes a powerful decision-support tool for managing modern urban development programs.
Key Feature of Smart Cities Project Dashboard in Excel 📊
The Smart Cities Project Dashboard in Excel includes several powerful features that simplify project monitoring and improve urban governance.
🌆 Comprehensive Project Monitoring
Track all smart city initiatives in a centralized dashboard that displays project status, budgets, and environmental impact.
📊 Interactive KPI Cards
Instantly view key metrics such as Total Projects, Total Budget, Citizens Benefited, and Energy Saved (MWh).
📍 Dynamic Data Filtering with Slicers
Use slicers to filter project data by region, department, status, and project category for deeper insights.
💰 Budget Allocation and Spend Tracking
Monitor budget vs actual spending across funding sources and departments to ensure responsible financial management.
🌱 Environmental Impact Monitoring
Track sustainability metrics such as CO₂ reduction and energy savings generated by smart city initiatives.
📡 IoT Infrastructure Tracking
Analyze the distribution of IoT devices deployed across different regions.
⚠️ Project Risk Monitoring
Identify projects with high risk levels and evaluate potential delays.
📈 Monthly Project Trends Analysis
Visualize how projects progress over time through monthly performance charts.
📊 Multi-page Analytical Dashboard
Access multiple analytical views including project overview, financial analysis, impact evaluation, and risk monitoring.
⚡ User-Friendly Excel Interface
No advanced technical skills are required. Simply update project data and the dashboard updates automatically.
What’s Inside the Smart Cities Project Dashboard in Excel 📂
This Excel template includes five powerful analytical pages, each designed to provide insights from different perspectives.
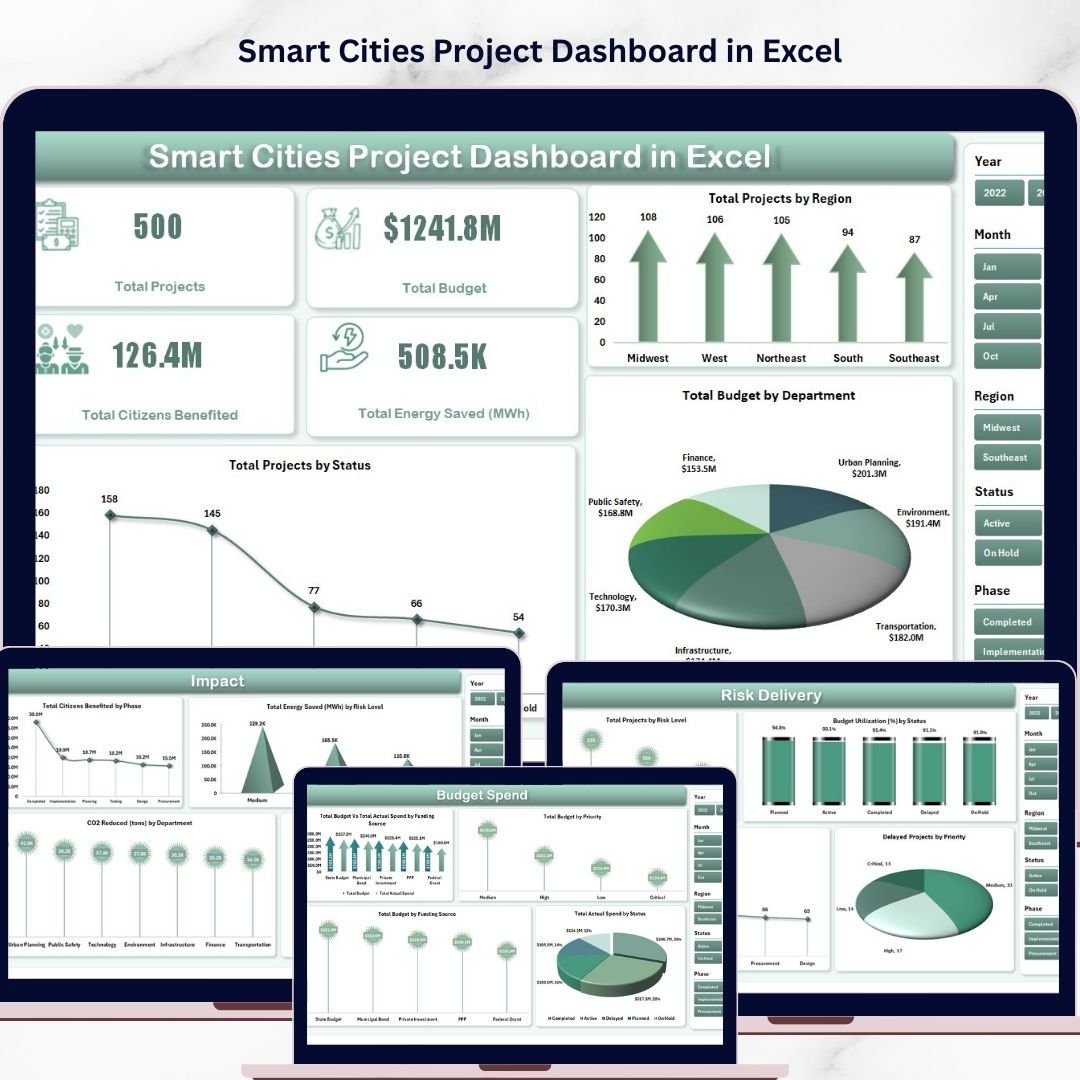
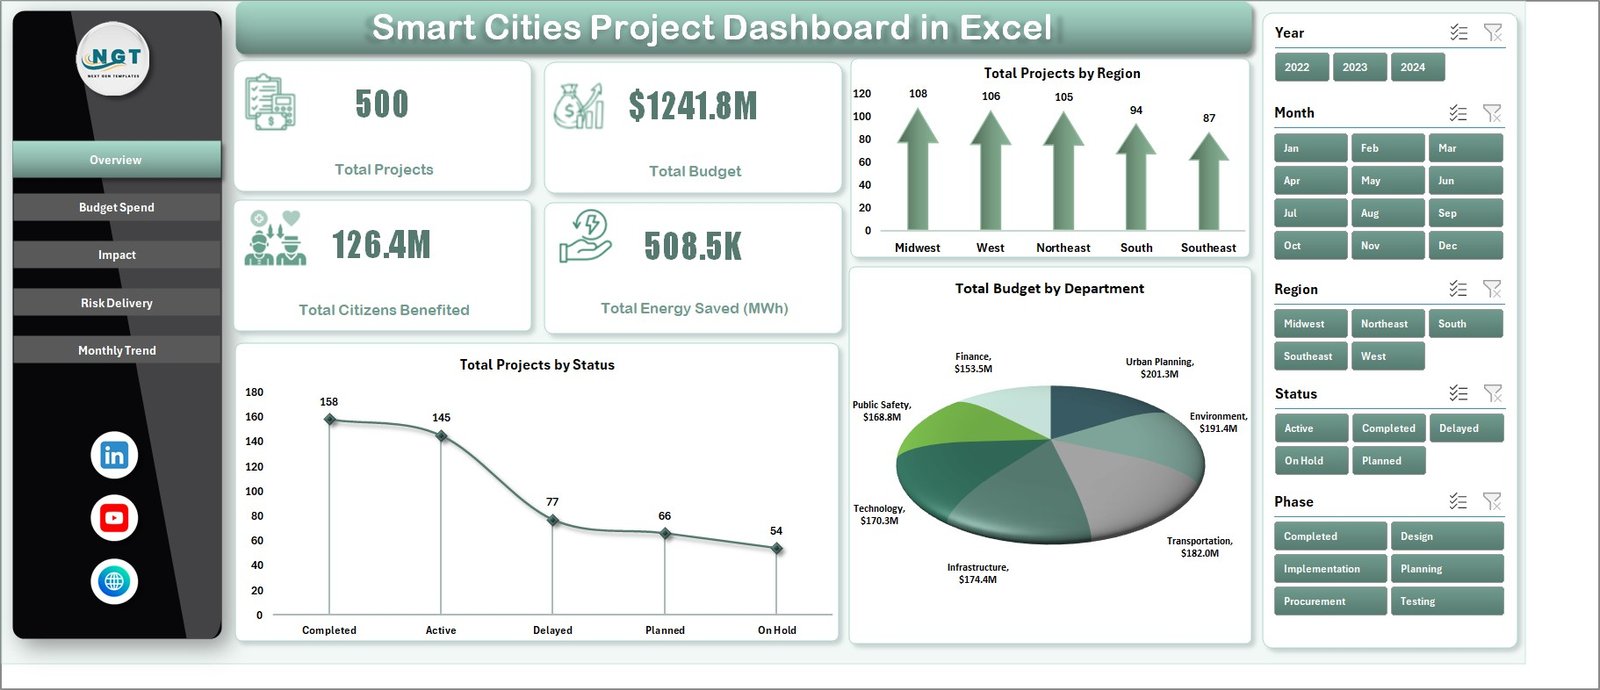
📊 Overview Page – Project Summary
Provides a complete snapshot of smart city initiatives including total projects, budgets, citizens benefited, and energy savings.
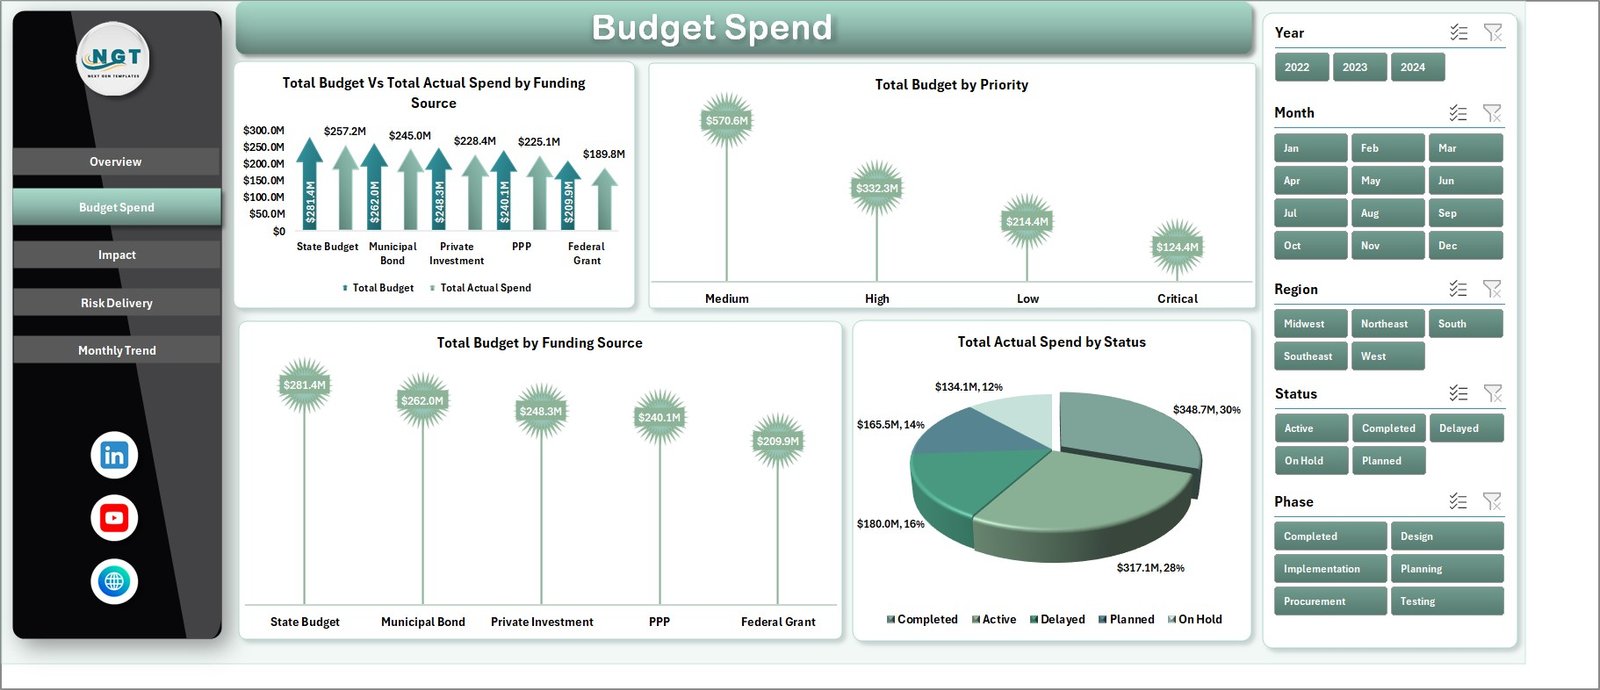
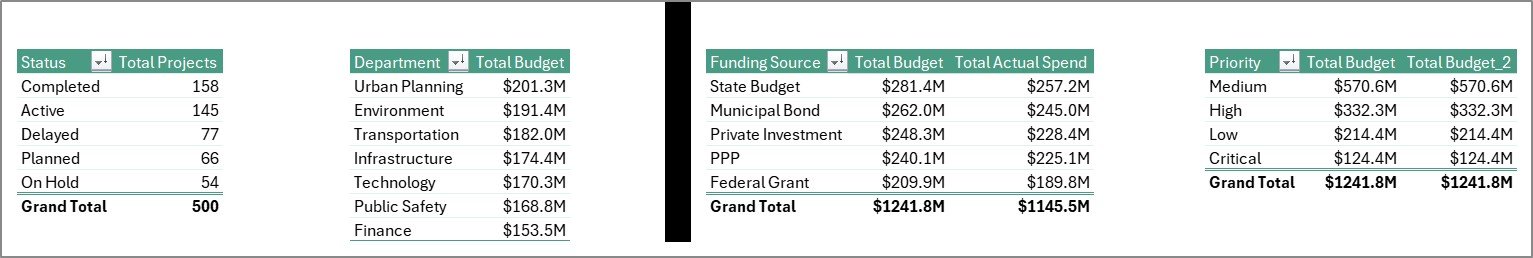
💰 Budget Spend Analysis Page
Tracks budget allocation and actual spending across funding sources and departments.
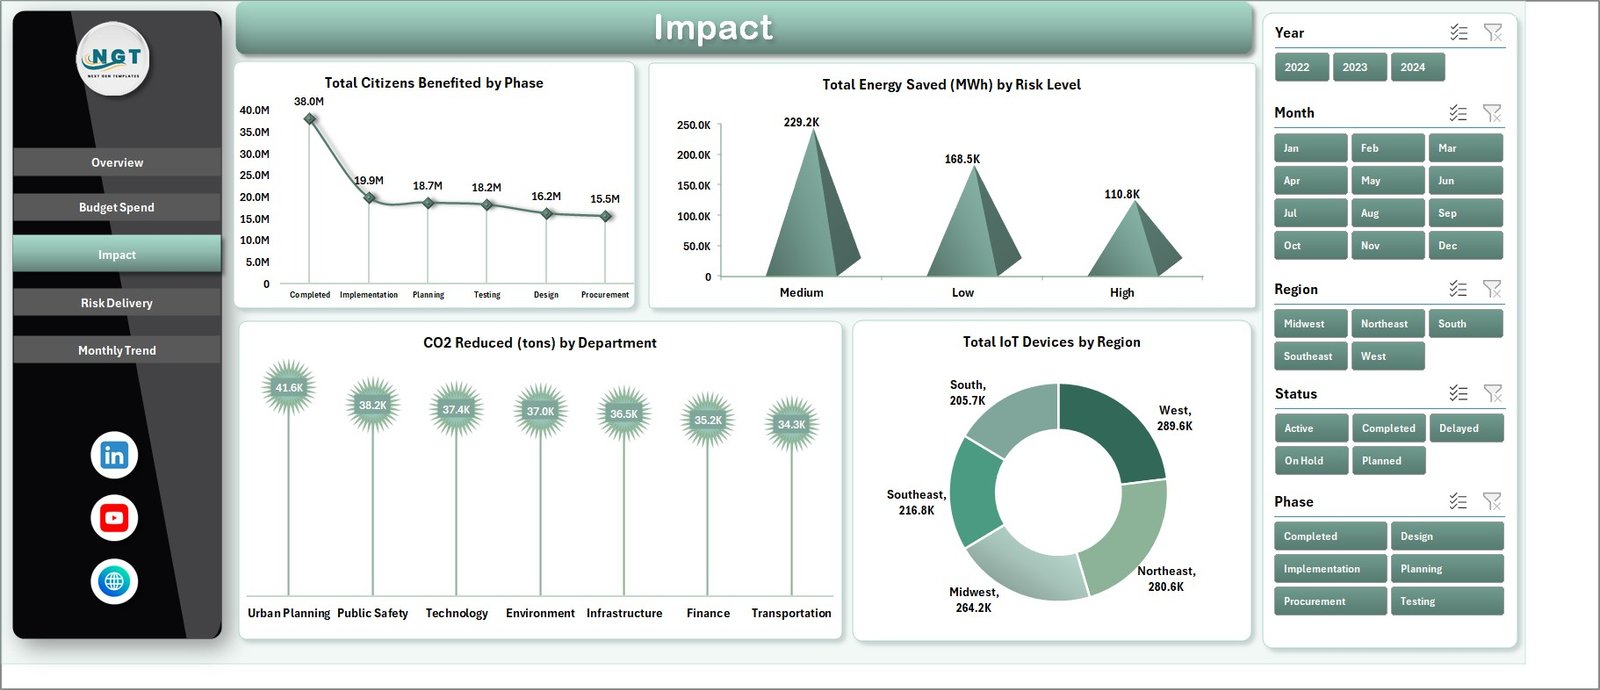
🌱 Impact Analysis Page
Measures environmental and social impact including energy savings, CO₂ reduction, and citizen benefits.
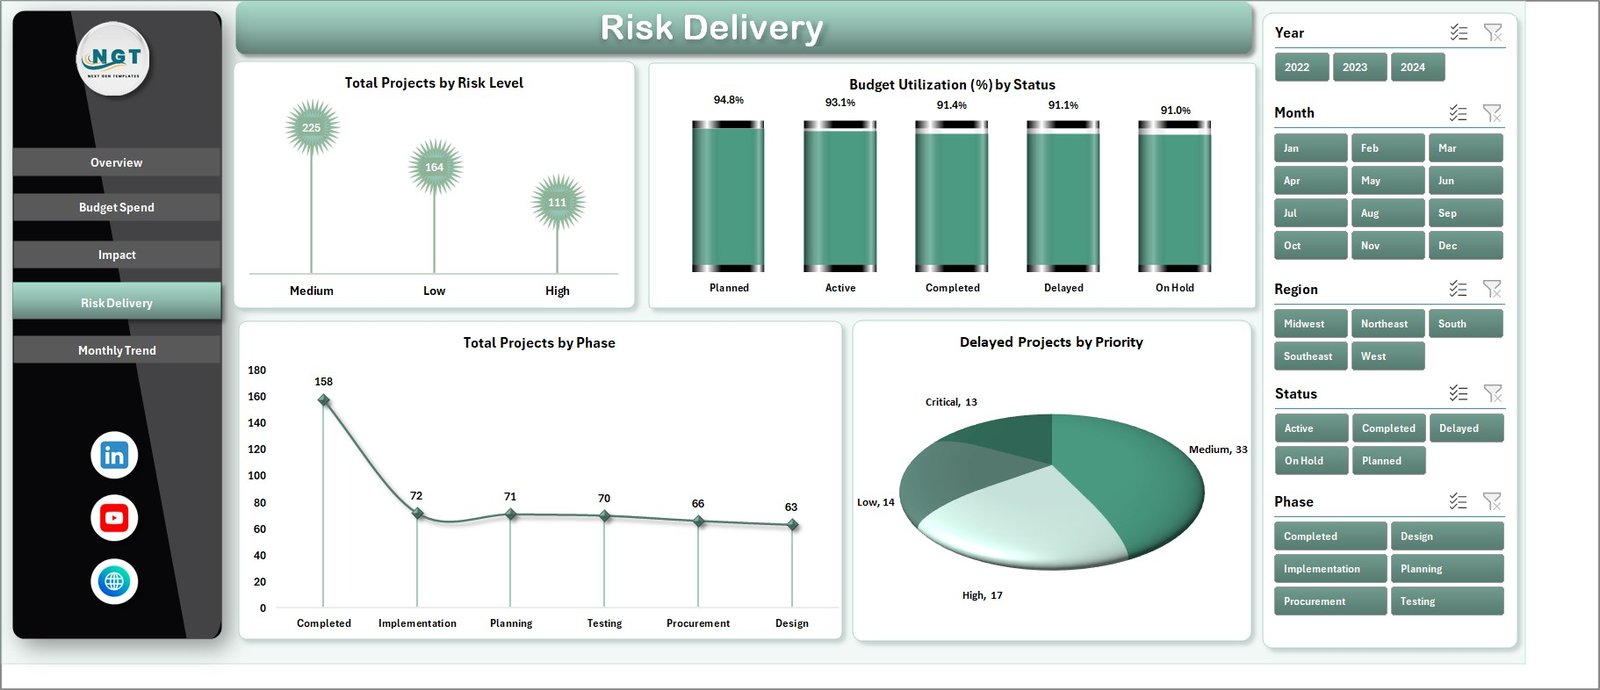
⚠️ Risk Delivery Page
Analyzes project risks, delivery performance, and delayed initiatives.
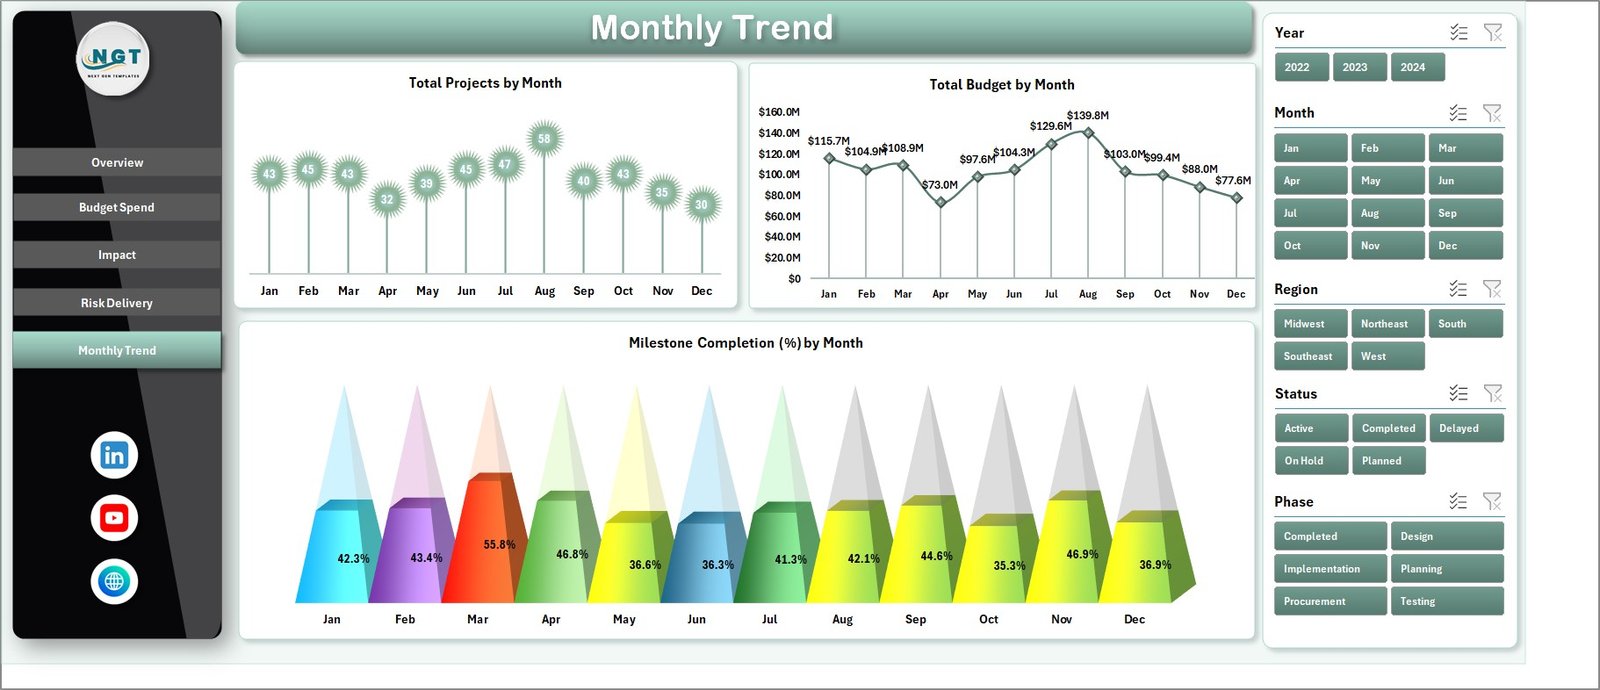
📈 Monthly Trends Page
Tracks project progress across months and analyze milestone completion trends.
Additionally, the dashboard includes a Page Navigator panel, allowing users to easily switch between analytical pages.
How to Use the Smart Cities Project Dashboard in Excel ⚙️
Using the dashboard is simple and requires only basic Excel knowledge.
1️⃣ Enter project data into the data source sheet.
2️⃣ Include project details such as project name, department, region, budget, status, and timeline.
3️⃣ Update environmental metrics such as energy savings, CO₂ reduction, and IoT device deployment.
4️⃣ Refresh the dashboard to update charts and KPI cards.
5️⃣ Use slicers to filter data by region, project status, or department.
6️⃣ Analyze budget spending, environmental impact, and project risks using different analytical pages.
With this simple workflow, city administrators can continuously monitor project performance and make informed decisions.
Who Can Benefit from This Smart Cities Project Dashboard in Excel 👥
The Smart Cities Project Dashboard in Excel is ideal for organizations involved in urban development and public sector initiatives.
🏙 City Administrators – Monitor the progress of urban development initiatives.
📊 Urban Planning Departments – Analyze project performance and resource allocation.
👷 Project Managers – Track project timelines, budgets, and risks.
🌱 Sustainability Teams – Monitor environmental impact such as energy savings and CO₂ reduction.
🏢 Government Agencies – Improve transparency and accountability in city development projects.
📡 Smart Infrastructure Teams – Monitor IoT deployment and digital infrastructure initiatives.
Any organization involved in smart city development, sustainability programs, or urban infrastructure projects can benefit from this dashboard.
Click hare to read the Detailed blog post
Visit our YouTube channel to learn step-by-step video tutorials
🔗 https://www.youtube.com/@PKAnExcelExpert