The Antique Dealers Dashboard is one of the most fascinating industries in the world. Antique dealers handle rare and valuable items such as vintage furniture, collectible coins, historical artifacts, classic paintings, jewelry, and decorative collectibles. These items often carry both historical significance and financial value, making the antique trade both exciting and complex.
However, running a successful antique business involves much more than buying and selling collectibles. Dealers must constantly monitor inventory movement, sales performance, dealer productivity, buyer trends, and category profitability. When businesses rely only on spreadsheets or manual tracking systems, it becomes extremely difficult to understand which antiques sell faster, which categories generate higher profits, and which buyers contribute the most revenue.
This is where the Antique Dealers Dashboard in Power BI becomes a powerful solution.
The Antique Dealers Dashboard in Power BI is a ready-to-use analytics tool that transforms raw antique business data into clear visual insights using interactive charts, KPI indicators, and dynamic filters. Instead of manually reviewing multiple reports, antique dealers can analyze their entire business performance in one centralized dashboard.
Using Power BI’s advanced visualization capabilities, the dashboard enables antique businesses to monitor sales trends, analyze inventory aging, evaluate dealer performance, and understand buyer behavior with ease.
Whether you manage an antique store, auction house, vintage gallery, or collectible business, this dashboard helps you turn complex business data into actionable insights. As a result, dealers can make smarter decisions, optimize inventory turnover, and focus on the most profitable antique categories.
Moreover, the dashboard provides multi-page analytics, allowing users to analyze their business from different perspectives such as category performance, dealer productivity, buyer insights, and monthly sales trends.
If you want to modernize your antique business operations and gain better control over inventory and sales analytics, the Antique Dealers Dashboard in Power BI provides the perfect data-driven solution.
🧭 Key Feature of Antique Dealers Dashboard in Power BI
📊 Interactive Antique Business Analytics
Monitor antique sales, inventory movement, dealer productivity, and buyer behavior using dynamic Power BI visualizations.
📦 Inventory Aging Analysis
Track how long antiques remain in inventory and identify slow-moving items.
💰 Sales Performance Monitoring
Analyze total sales across categories, eras, and buyer segments.
🧑💼 Dealer Performance Tracking
Evaluate individual dealer productivity, commissions, and sales contribution.
🧾 Buyer Behavior Insights
Understand which buyer segments purchase the most antiques and generate the highest value.
📈 Category-Level Sales Analysis
Identify the most profitable antique categories and product segments.
📅 Monthly Sales Trend Monitoring
Track seasonal sales patterns and monthly revenue performance.
🎛 Dynamic Filters and Slicers
Analyze business data by dealer, category, buyer type, or time period.
📊 Professional Power BI Visualizations
The dashboard converts raw data into easy-to-understand charts and reports.
🔄 Scalable Data Integration
Connect Power BI with Excel, databases, or other data sources to refresh insights automatically.
📊 What’s Inside the Antique Dealers Dashboard in Power BI
The dashboard includes five interactive analytical pages designed to analyze different aspects of antique business operations.
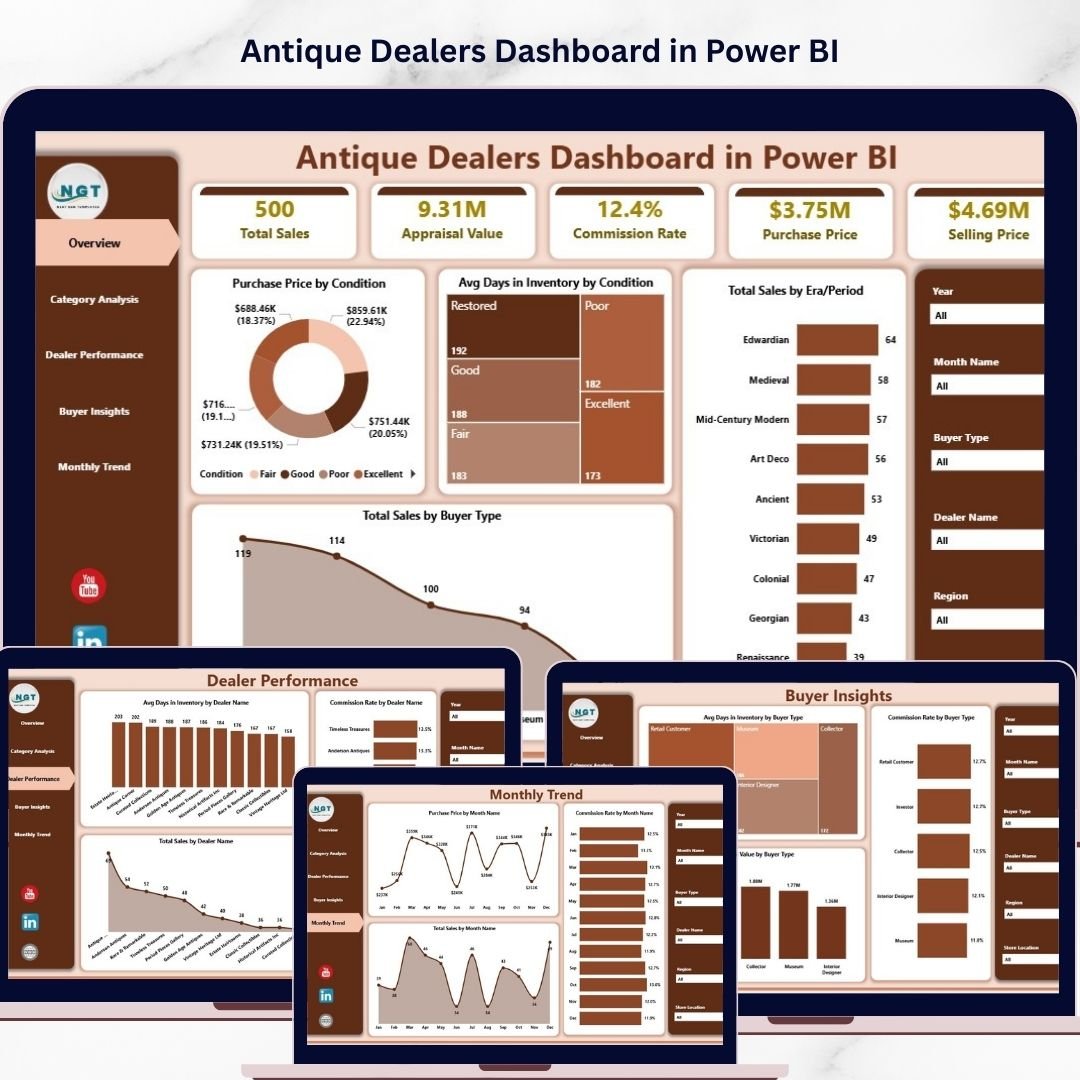
🏛 Overview Page – Business Performance Snapshot
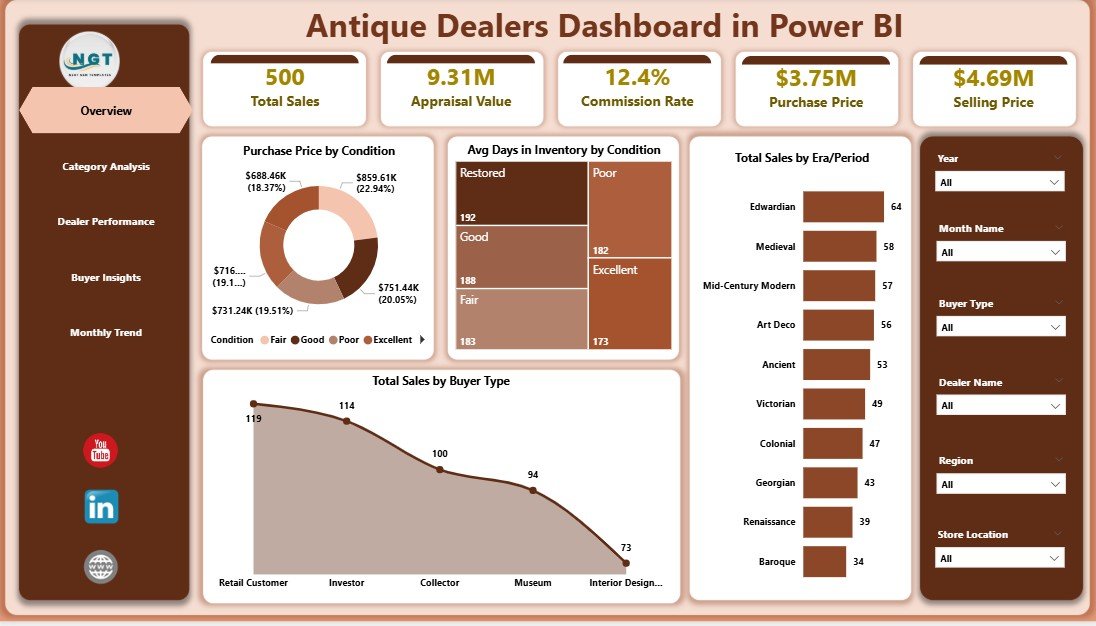
The Overview Page acts as the main dashboard summary where users can quickly understand the overall performance of the antique business.
Key metrics include:
• Purchase Price by Condition
• Average Days in Inventory by Condition
• Total Sales by Era Period
• Total Sales by Buyer Type
These insights help dealers quickly evaluate inventory value, historical era demand, and buyer category performance.
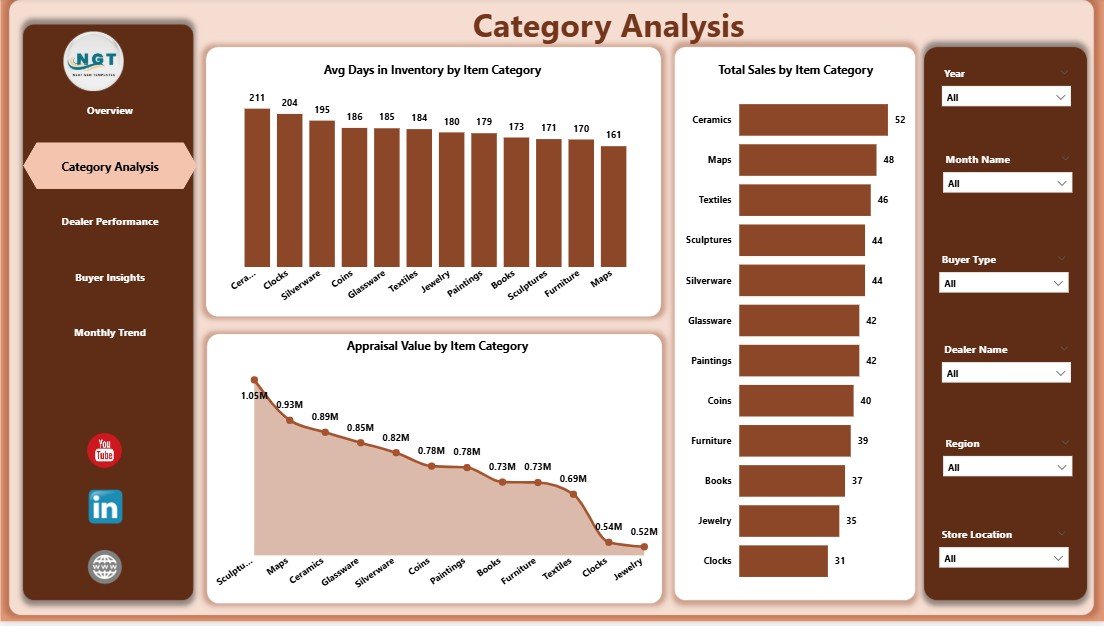
🪑 Category Analysis Page
Antique businesses often sell a wide variety of items such as furniture, jewelry, books, collectibles, and decorative pieces. Therefore, category-level insights are extremely important.
Charts available:
• Average Days in Inventory by Item Category
• Total Sales by Item Category
• Appraisal Value by Item Category
These insights help dealers identify high-performing antique categories and faster-moving inventory segments.
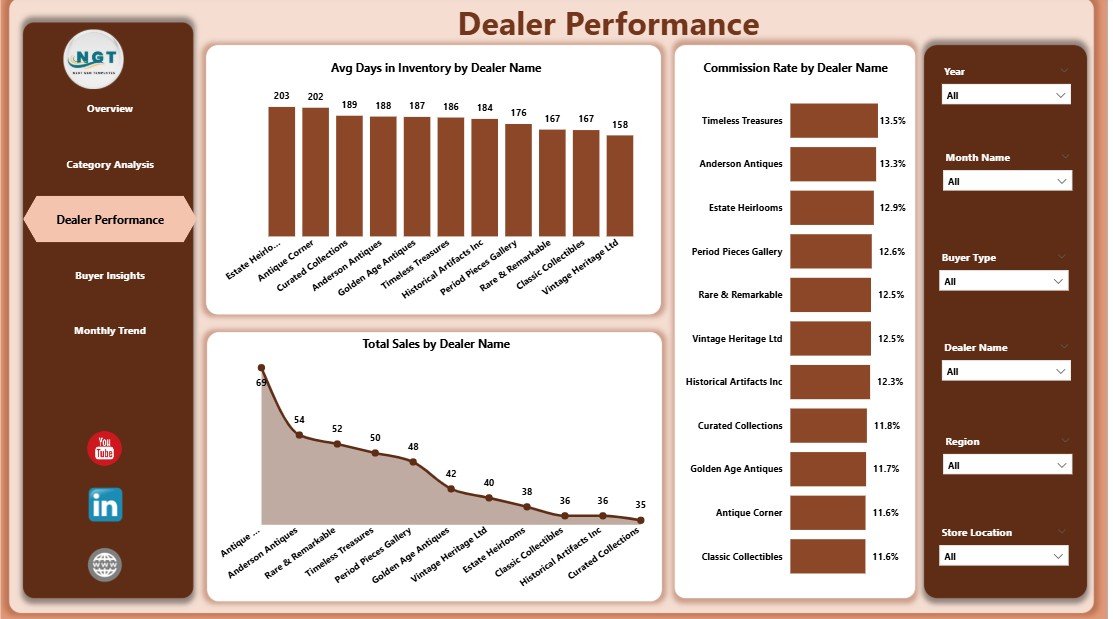
👨💼 Dealer Performance Page
Many antique businesses work with multiple dealers who source or sell antiques. Monitoring dealer productivity is essential for business success.
Charts included:
• Average Days in Inventory by Dealer Name
• Commission Rate by Dealer Name
• Total Sales by Dealer Name
This page allows managers to identify top-performing dealers and improve overall sales efficiency.
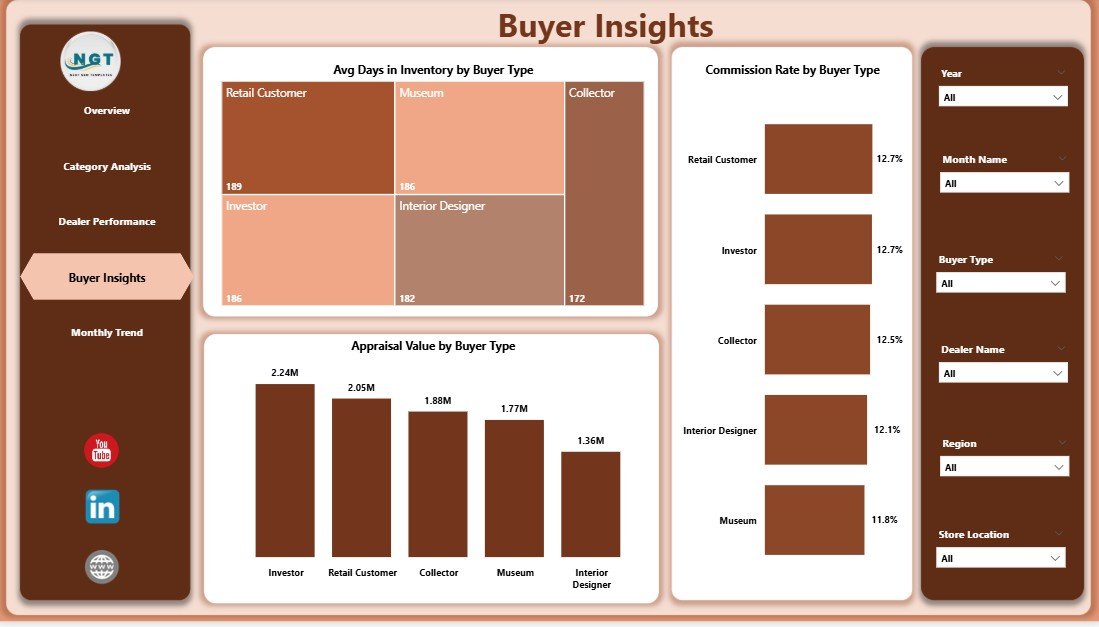
🧑🤝🧑 Buyer Insights Page
Understanding customer behavior helps antique dealers refine marketing strategies and target high-value buyers.
Charts include:
• Average Days in Inventory by Buyer Type
• Commission Rate by Buyer Type
• Appraisal Value by Buyer Type
These insights reveal which buyer segments purchase premium antiques and generate the highest revenue.
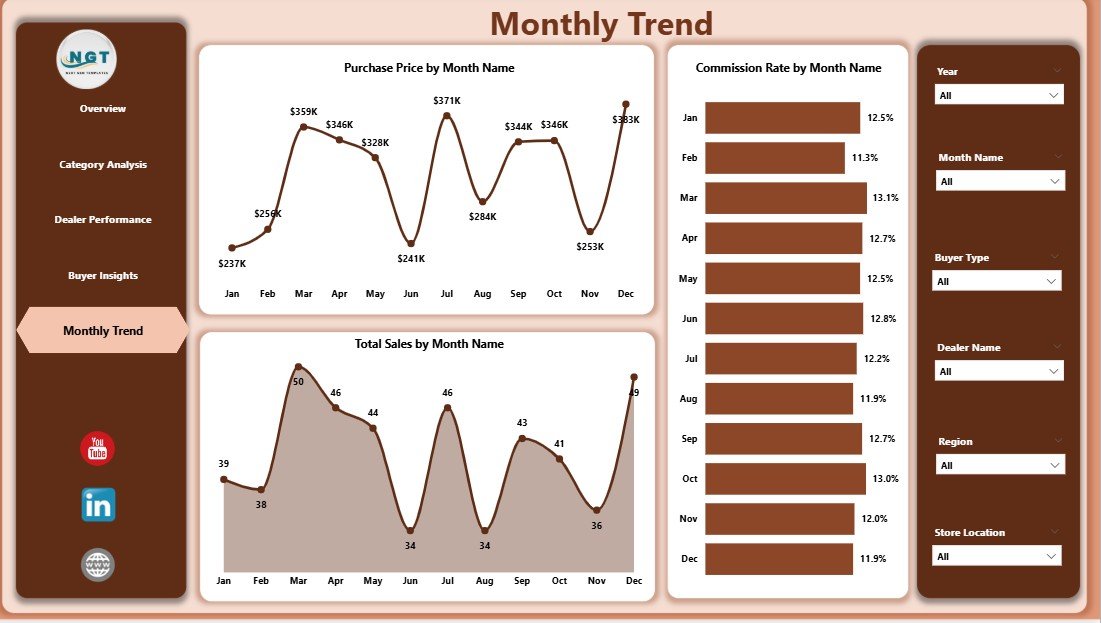
📅 Month Analysis Page
Antique sales often fluctuate based on seasonal demand, auctions, and exhibitions.
Charts included:
• Purchase Price by Month
• Commission Rate by Month
• Total Sales by Month
These insights help businesses plan inventory purchases and promotional campaigns based on seasonal demand patterns.
⚙️ How to Use the Antique Dealers Dashboard in Power BI
Using the dashboard is simple and efficient.
1️⃣ Import antique sales and inventory datasets into Power BI.
2️⃣ Ensure data includes fields such as item category, dealer name, buyer type, purchase price, and sales value.
3️⃣ Use slicers to filter insights dynamically.
4️⃣ Analyze performance across different dashboard pages.
5️⃣ Refresh data regularly to keep insights updated.
Within minutes, users can transform antique business data into powerful visual analytics.
👥 Who Can Benefit from This Antique Dealers Dashboard
This dashboard is ideal for professionals across the antique and collectible industry.
🏺 Antique Shop Owners – Monitor inventory turnover and sales performance.
🪑 Antique Dealers – Track individual productivity and commissions.
🏛 Auction Houses – Analyze auction sales and buyer trends.
🖼 Art & Collectible Galleries – Evaluate category performance and buyer demand.
📊 Antique Market Analysts – Study market behavior and sales trends.
🎓 Students & Data Analysts – Learn Power BI analytics with real-world business datasets.
Organizations that adopt this dashboard gain better business visibility, faster decision-making, and improved profitability insights.
### Click hare to read the Detailed blog post
Visit our YouTube channel to learn step-by-step video tutorials
https://youtube.com/@PKAnExcelExpert